Crude oil is one of the most important energy sources in the world and hence there have been many studies devoted to understand chemical composition of crude oil. Various analytical techniques including NMR, FT-IR, and UV-Vis spectroscopy have been applied to study crude oil.1?5 Among the analytical techniques, gas chromatography mass spectrometry (GC-MS) has played a crucial role in understanding detailed chemical composition of crude oil.6?8 However, typical GC-MS analysis of crude oil is limited to non-polar and light (e.g. molecular weight smaller than 400 Dalton) compounds and there has been expanded demand to study polar and heavy compositions of crude oil.9 Recently, two new techniques, comprehensive two dimensional GC-MS (2D GC-MS)10 and Fourier transform ion cyclotron resonance mass spectrometry (FT-ICR MS)11 have emerged as tools to study heavy compounds of crude oil. With 2D GCMS, two columns with different polarities can be used at the same time so that it can provide more separation capability than conventional GC-MS.12 2D GC-MS has been successfully applied to study oil samples.13?17 FT-ICR MS is a very powerful technique for complex mixture for its unparalleled ultra-high resolution capability.18 Over 10000 chemical compounds existing in crude oil sample can be routinely found by this technique.19 Therefore, there have been many studies where FT-ICR MS has been applied to find detailed chemical compositions of crude oils, oil shale, bitumen and processed oils.20?23
However, since oil originated from crude oil is very complex mixture, no technique alone can provide complete chemical information of it. In this study, that 2D GC-MS and 15T FT-ICR MS were applied to the same oil sample and their analytical capabilities have been evaluated.
For FT-ICR MS analysis, diesel sample was dissolved in toluene to 1 mg/mL. Direct infusion was performed at a flow rate of 500 μL/h with a syringe pump (Harvard, Holliston, MA). APPI source (Bruker Daltonics, Billerica, MA) connected to 15-T FT-ICR MS at the Korean Basic Science Institute (KBSI, Ochang-eup, Korea) was used for the analysis. Nitrogen was utilized as the drying and nebulizing gas. The nebulizing temperature of 350 ℃ was used. The skimmer voltage was set to 15.0 V to minimize in-source fragmentation. 4 M word data points and 2-s transient signal were obtained for spectrum. Signal-to-noise was enhanced by summing 150 time domain transients.
A thermal modulator (Zoex, Houston, TX) connected to Shimadzu GC-2010Plus GC-MS (Kyoto, Japan) was used for comprehensive 2D GC-MS experiment. The thermal modulator was composed of liquid nitrogen cold head, hot gas blower, and 2 stage loop. Two columns of Rtx-1, 30 m × 0.25 mm I.D., 0.25 μm and DB-Wax, 3 m × 0.10 mm I.D., 0.10 μm were connected and employed for 2D separation.
For interpretation of FT-ICR MS data, Statistical Tool for Organic Mixtures’ Spectra (STORMS 1.0) software24 with an automated peak-picking algorithm25 was used. Elemental formulae were calculated from the calibrated peak list and assigned based on
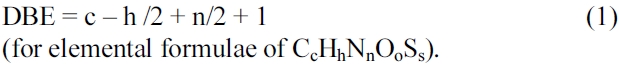
(for elemental formulae of CcHhNnOoSs).
The comprehensive 2D GC data were processed by GCMSsolution Software (Shimadzu, Kyto, Japan) and GC Image Software (Zoex, Houston, TX).
>
Characterization of diesel oil by 2D-GC MS
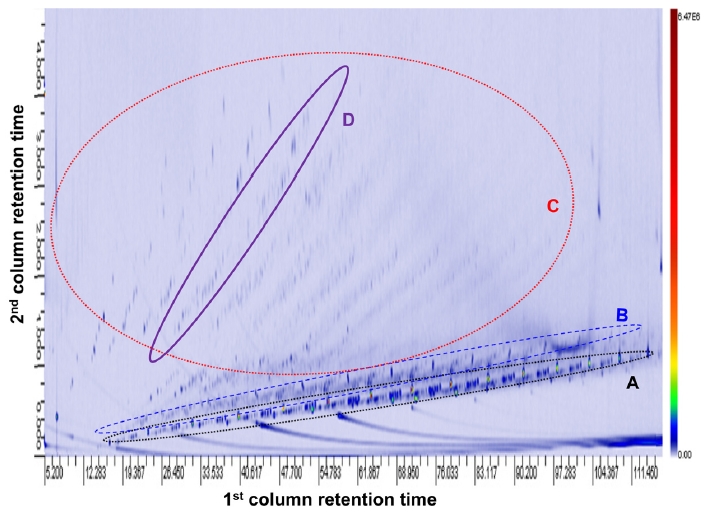
A diesel oil sample was analyzed by comprehensive 2D GC-MS and the obtained 2 dimensional chromatogram26 is presented in Figure 1. The abscissa and ordinate of the chromatogram each represents retention time of the first and second column.26 Since the second column is shorter than the first one, it takes shorter time for analytes to be eluted.27 The total ion current (TIC) at a given retention times of the 1st and 2nd column is reported as color coding. The red color represents larger TIC values and the light
blue color smaller TIC values. Well separated dots in the chromatograms represent individual compounds and the EI spectra comprising the dots can be summed and examined for compound identification.28
In the chromatogram shown in Figure 1, compounds with similar structural features could be grouped together.29 A group of peaks located near abscissa of the chromatograms (circle A) could be assigned to aliphatic alkyl compounds.30 Each group of peaks in circle B and C could be assigned to compounds with saturated cyclic ring structures and the ones with an aromatic ring respectively. Peaks lying in a linear line in the same group could be related to each other by difference of n(CH2). For example, the compounds in circle D were identified as a series of compounds with difference of n(CH2) and their structural isomers. Overall, hydrocarbon compounds ranging from aliphatic alkyl compounds to ones with one aromatic ring structures were mainly identified in the 2D GC spectrum.31 However, the compounds with more than 2 aromatic ring structures could not be clearly identified in the spectrum shown in Figure 1.
>
Characterization of diesel oil by high resolution mass spectrometry
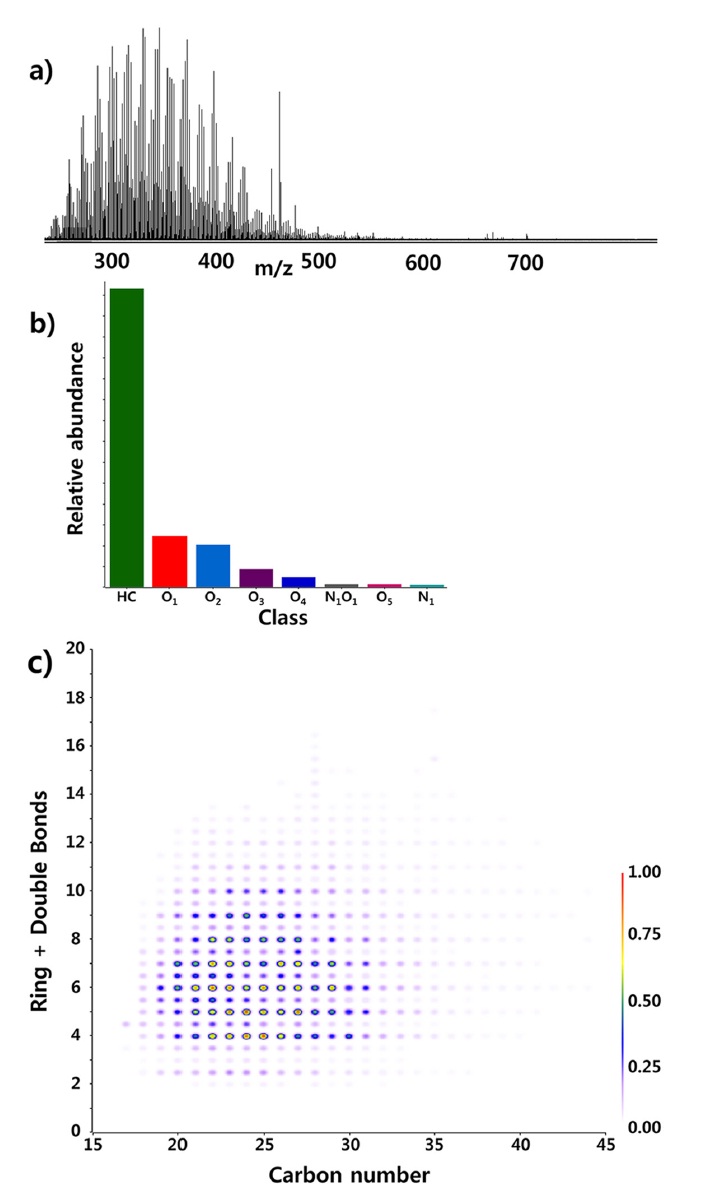
The same diesel oil sample was analyzed by 15T FT-ICR MS and obtained broad band spectrum is presented in Figure 2a. Most of the peaks observed in the spectrum had molecular weight smaller than 500 dalton. The distribution is lower than that typically observed from crude oil sample and this agrees well with the fact that diesel oil represents compounds with relatively lower boiling points. The class distribution calculated from the spectrum is presented in Figure 2b. HC in the notations of Figure 2b represents hydrocarbon class. The other notations stand for heteroatom species. For example, O1 class denotes class of compounds with molecular formulae of CxHyO1 (x, y: unlimited). The hydrocarbon class was the most dominant class in the sample.32 Relatively smaller amount of oxygen containing class compounds were identified.
The carbon number vs double bond equivalence (DBE) plot of hydrocarbon class was constructed and shown in Figure 2c. The carbon numbers of compounds identified by APPI FT-ICR MS ranged mainly between 15 and 35 and the DBE values distributes between 4 and 13. Compounds containing one aromatic ring have DBE value of 4 and ones with four aromatic rings (e.g. chrysene) have DBE value of 13. Therefore, it was concluded that compounds containing between 1 and 4 aromatic rings were mainly observed by APPI FT-ICR MS. Non-aromatic compounds with DBE value of 2 and 3 were also observed. The compounds are likely to have cyclic ring(s) and/or unsaturated bonds in their chemical structures. In summary, aromatic compounds, especially ones with more than 2 aromatic ring structures could be observed but the aliphatic alkyl compounds observed with 2D GC were not observed with APPI FT-ICR MS.
A diesel fuel sample was analyzed by comprehensive 2D GC-MS and high resolution mass spectrometry. It was observed that spectra obtained by two techniques were complimentary to each other.33 With 2D GC-MS, compounds containing aliphatic alkyl, saturated cyclic ring(s), and one aromatic ring were mainly identified.34 However, compounds with between 1 and 3 aromatic ring structures were major classes observed by APPI FT-ICR MS. It is clear that both techniques provide different look of the same sample and this strongly suggests that relying solely on one technique can bias our interpretation. The challenge now is to devise a method to be able to quantitatively combine the data offered by two different techniques for more complete understanding of oil sample. Future study is required to find the method.