Mass spectrometric analysis was carried out using multicollector inductively coupled plasma mass spectrometry (MC-ICP-MS) for the precise and accurate determination of the isotope ratios of ultratrace levels of uranium dissolved in 3% HNO3. We used the certified reference material (CRM) 112-A at a trace level of 100 pg/mL for the uranium isotopic measurement. Multiple collectors were utilized for the simultaneous measurement of uranium isotopes to reduce the signal uncertainty due to variations in the ion beam intensity over time. Mass bias correction was applied to the measured U isotopes to improve the precision and accuracy. Furthermore, elemental standard solution with certified values of platinum, iridium, gold, and thallium dissolved in 3% HNO3 were analyzed to investigate the formation rates of the polyatomic ions of Ir40Ar+, Pt40Ar+, Tl40Ar+, Au40Ar+ for the concentration range of 50?400 pg/mL. Those polyatomic ions have mass-to-charge ratios in the 230?245 m/z region that it would contribute to the increase of background intensity of uranium, thorium, plutonium, and americium isotopes. The effect of the polyatomic ion interference on uranium isotope measurement has been estimated.
Over the past few decades, inductively coupled plasma mass spectrometry (ICP-MS) has been increasingly used for ultratrace elemental analysis owing to its advanced capabilities such as high sensitivity and short measuring time.1?3 ICP-MS is superior to thermal ionization mass spectrometry (TIMS) in that it provides higher ionization efficiencies for a given sample size; this allows ICP-MS tools to be used widely for uranium(U) isotope ratio measurements at ultratrace analyte levels.4,5 The ICP-MS technique is based on the concept that plasma ions, which indicate the presence of an analyte in a sample, are driven by intense electromagnetic fields, and are then directed toward their own intrinsic paths by electric and magnetic sector analyzers.6,7 The ion currents measured by ion collector systems provide valuable information on the isotopic compositions in a sample solution. For ultratrace levels of the analytes of interest, the simultaneous measurement of different isotopes with a multicollector (MC) system is preferable to avoid the uncertainty caused by fluctuation of the ion beam intensity over time.5,8 It is due to the fact that the variations in signal intensity during the measurement period have an almost equal impact on the entire detector. Previous analytical studies demonstrated that MC-ICP-MS is a convenient and accurate approach for measuring U isotope ratios at ultratrace levels of analyte.7,9 However, the mass bias effect, in which the transmission efficiencies of the ion beam depend on the ion’s mass, poses a challenge to an accurate measurement of ion currents for the analytes of interest.4 Hence, mass bias correction is necessary to accurately determine the isotope ratios of a sample. The matrix elements in plasma are susceptible to a combination with the most abundant argon and atmospheric gases, which results in the production of polyatomic ions such as 195Pt40Ar+, 198Pt40Ar+, 193Ir40Ar+, 202Hg40Ar+, 238U1H+, and 207Pb16O2 +. The interference effect due to these polyatomic ions affects the precision and accuracy of isotopic measurements.10 The polyatomic ions of Ir40Ar+, Pt40Ar+, Tl40Ar+, Au40Ar+ whose mass-to-charge ratios are around the 230?245
In this study, the U isotope ratio was measured using CRM 112-A at a trace level of 100 pg/mL obtained from the US Department of Energy, New Brunswick. The standard reference material (SRM) U-005 was used as a bracketing standard for mass bias correction of the measured U isotope ratios from CRM 112-A. In addition, the production rates of the polyatomic ions were investigated using elemental standard solutions of Ir, Au, Pt, and Tl diluted in 3% HNO3.
An MC-ICP-MS (NEPTUNE
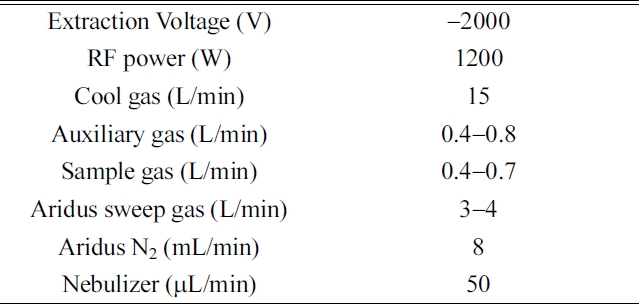
[Table 1.] Operating parameters for MC-ICP-MS

Operating parameters for MC-ICP-MS
radio-frequency fields (27.12 MHz). We used high-purity nitric acid (Merck, Ltd.) and Milli-Q de-ionized water (~18 MΩ·cm) to dilute the reagents in our experiments. The background intensities of 3% HNO3 measured by the ion counter were typically 233U, 236U, 234U < 1cps, 235U < 50 cps, and 238U < 3000 cps. The tuning windows for controlling the torch position, the amount of instrumental gas, and the ion lenses were routinely adjusted to optimize the sensitivity and stabilize the ion beam intensity. We used the SRM U-005 solution (5 pg/mL) and collected its 238U beam intensity in a Faraday cup to tune the MC-ICP-MS system. The typical operating conditions are given in Table 1.
>
Polyatomic ion interference effect
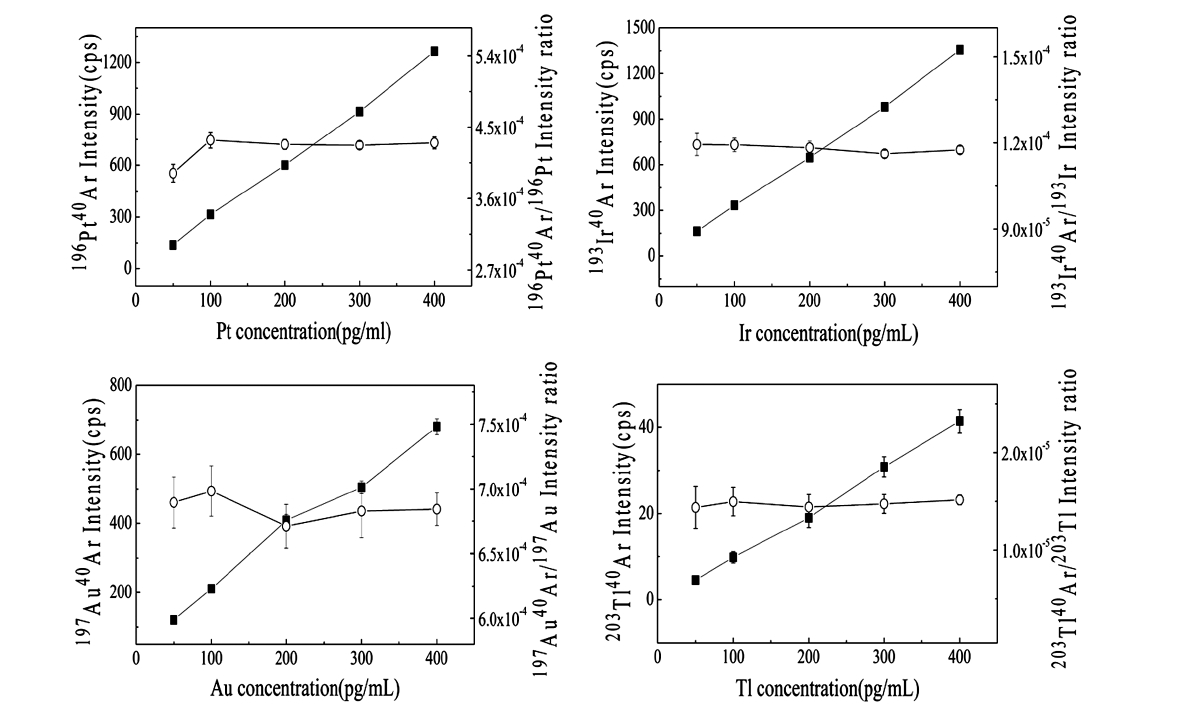
Polyatomic ions were measured using elemental standard solutions of Ir, Au, Pt, and Tl diluted in 3% HNO3 (Anapex Co., Ltd.) to investigate the polyatomic ions that might affect the accuracy and precision of the isotopic measurement of actinide elements. The polyatomic interference arising from the cluster ions generated in the plasma source depends on the sample composition. Heavy matrix elements (Ir, Au, Pt, and Tl) combined with the most abundant atoms (40Ar) in the plasma have mass-to-charge ratios in the 230?245
>
Uranium isotope ratio measurement
U isotope ratios were measured using the standard solution (CRM 112-A, 100 pg/mL) with the isotopic composition of natural U. Mass bias correction was carried out for the measured isotope ratios to enhance the accuracy and precision of the measurements. The mass bias effect in ICP-MS is caused by instrumental mass discrimination, which is largely attributed to the mass-dependent transmission efficiencies in the plasma/vacuum interface region.13,14 We
used the following equation to correct the isotope ratios measured from CRM 112-A:4,14
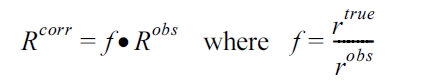
Here,
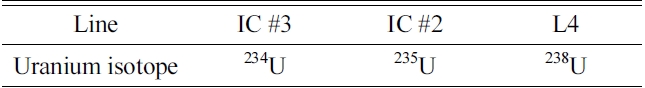
Cup configuration designed for the simultaneous measurement of U isotopes. IC#2 and IC#3 refer to ion counters. L4 refers to the Faraday cup detector
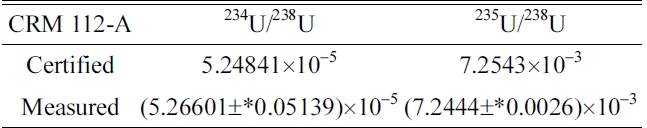
U isotope measurement for CRM 112-A. In the“Measured” results, the average values and standard deviation of 234U/238U and 235U/238U ratios are taken from 15 measurements. The asterisk symbol (*) indicates standard deviation
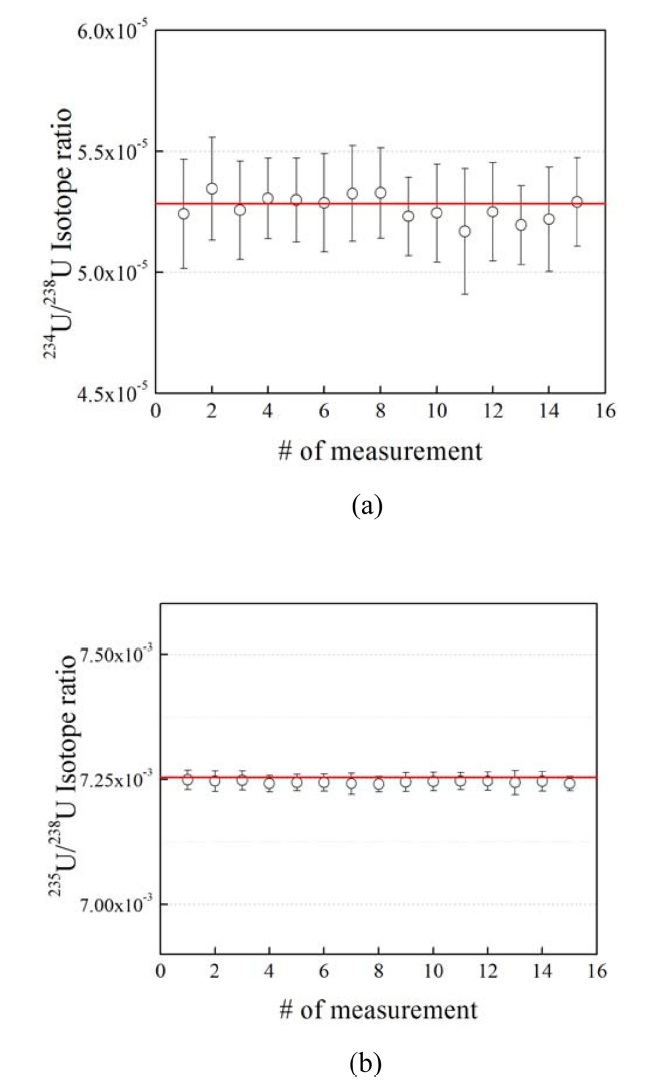
60 s was typically needed, as the signal became stabilized after the sample introduction.8 The integration time, i.e., the length of time used to integrate the ion current signals, was set to 4.194 s. The idle time needed for the magnetic field and Faraday cup detectors to settle was set to 3.0 s. Each measurement was performed over 40 acquisition cycles. For this measurement, a nebulizer with an uptake rate of 50 μ;L/min was used, and the concentration was 100 pg/mL. The total amount of U consumed per measurement was thus deduced to be ~29 pg. Figure 2 shows the corrected U isotope ratios of CRM 112-A. The certified values are within the error bars of the measured isotope ratios. In the sampling sequence, 112-A and U-005 were measured in turn. The isotope ratios of 112-A were then corrected for each measurement. Table 3 presents the average values of the 234U/238U and 235U/238U ratios from 15 measurements. According to reference 16, the expanded uncertainty values of the certified values of 234U/238U and 235U/238U in Table 3 are 8.2 × 10?8 and 4.0 × 10?6. The expanded uncertainty is expressed as k ㆍ uc, where k is the coverage factor (k = 2) and uc is the combined standard uncertainty. The expanded uncertainties for the measured isotope ratios were calculated according to the Joint Committee for Guides in Metrology (JCGM) Guide to the Expression of Uncertainty in Measurement.16
The U isotope ratio was measured using CRM 112-A at ultratrace levels, and mass bias correction was performed. Without mass bias correction, the relative errors in the measured 234U/238U and 235U/238U ratios to the certified values were 1.67% and 1.52%, respectively. On the other hand, the relative errors in the measured 234U/238U and 235U/238U ratios to the certified values were reduced to be 0.34% and 0.14% after mass bias correction as shown in Table 3. Furthermore, we investigated the effect of polyatomic ions that may interfere with the U isotopic measurement. Since natural U contains no 236U and very little of the abundant 234U, the polyatomic ions 196Pt40Ar+ and 194Pt40Ar+ were shown to affect the accuracy of the isotopic measurement of ultratrace levels of uranium. It is important to estimate the formation rates of those polyatomic ions with mass-to-charge ratios in the 234?238