Energy has been playing a key role in the development of modern human society for many years. A person in modern industrialized society consumes approximately ten times more energy than one in the agricultural society because modern human is relying on energy for food production, heating, construction, and transportation.1-3 Fossil fuels especially crude oil have been one of the most heavily used energy resources. It is well-known that oil is a limited resource and hence people are continuously looking for new alternative energy.4,5 However, the transition of our society to adapt to new energy source will take decades6 and it is logical to identify and use more immediately usable energy resources. In fact, as the world’s crude oil deposit becomes heavier, it is less efficient to utilize the crude oils.7 It is because smaller amount of economically viable component is generated from heavy crude oils than lighter ones. Therefore, it is very important to devise methods to increase the efficiency of utilizing heavy crude oils.8
Understanding the heavy component of crude oil at the molecular level has been very important to improve petroleum processing.9,10 Petroleomics refers to a research effort where detailed knowledge of heavy crude oil is pursued.11,12 High resolution mass spectrometry especially Fourier transform ion cyclotron resonance mass spectrometry (FT-ICR MS) has been one of the key components for petroleomics.13 It has not been easy to study the heavy (typically molecular weight over 400 Da) and/or polar compounds by use of traditional analytical methods such as gas chromatography mass spectrometry (GC-MS).14 However, Fourier transform ion cyclotron resonance mass spectrometry (FT-ICR MS) coupled to various ionization sources has enabled us to observe and study heavy compounds up to about 800 Da with and without polar functional groups.15-17 For example, atmospheric pressure photo ionization (APPI) coupled to FT-ICR MS is a powerful tool to study aromatic and/or sulfur containing compounds.10,18 More than thousands of compounds have been routinely observed by use of this technique.19
The successful application of FT-ICR MS to study crude oil at a molecular level has been possible partly due to key advances in data processing methods.20-22 If the data processing methods were not been developed, it would have been very laborious to process and study thousands of peaks contained in each crude oils’ spectra. The complex high-resolution mass spectra are the results of the complex nature of petroleum. It may happen that, spectrum of over 100,000 peaks comes out from a single crude oil sample. Therefore, development of data interpretation methods has played a crucial role in the study of crude oils by highresolution MS.23 For an example, Kendrick mass defect (KMD) and van Krevelen analytical methods have been important data processing methods to simplify and visualize crude oils’ spectra.24,25 There are other important methods developed to visualize the complex spectra as well.26,27 Therefore, the objective of this paper is to provide a review of developments related to data interpretation of very complex spectra of crude oil provided by FT-ICR MS.
Calculation of Kendrick mass is done by multiplying the observed
KMD (C6H6) = 78.04695 × (14.0000/14.01565) ? 78 = 0.9598 (1)
KMD (C7H8) = 92.06300 × (14.0000/14.01565) ? 92 = 0.9598 (2)
KMD (C6H6O) = 94.0418 × (14.0000/14.01565) ? 94 = 0.9368 (3)
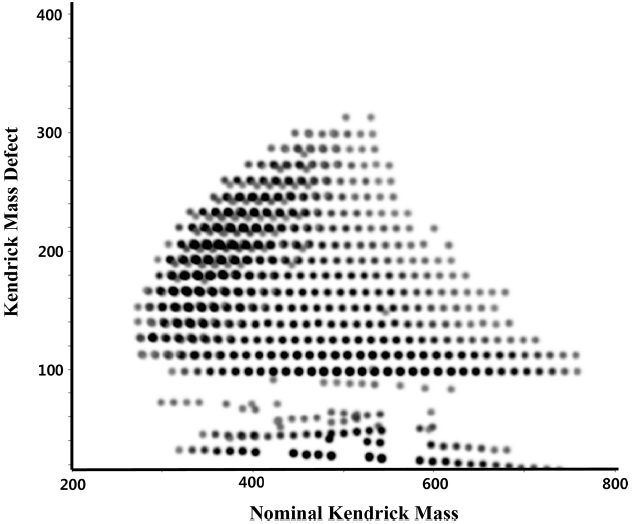
KMD plot is typically generated by plotting nominal KMD vs KMD values. An example of a KMD plot is presented in Figure 1. The dots aligned in each line parallel to x-axis have elemental compositions differing from each other by (CH2)n. The KMD values are particularly useful because they can be calculated directly from mass numbers even before the elemental compositions are calculated and assigned.25 This feature allows ones to use KMD values to sort the mass numbers of calibrated mass spectra with a given neutral units. Relative abundance of peaks can be presented by color or size of dots.
A method analyzing KMD in higher-order was developed and reported.29 For the analysis, mass numbers from spectra are firstly grouped by KMD values (e.g., by the CH2 series), and then the groups are further sorted by the second KMD series (e.g., by the H2 series). A group of peaks in different classes are plotted with the CH2-based KMD values as the abscissa and the ratio of the CH2-based KMD and H2-based KMD of the CH2-based KMD as the ordinate.
The van Krevelen diagram was originally used to study bulk elemental analysis data of coals.30 In the original van Krevelen plot, bulk hydrogen-to-carbon (H/C ratio) ratio was plotted as the ordinate and the bulk oxygen-to-carbon ratio (O/C ratio) as the abscissa. In this way, each sample was plotted as a dot in the diagram.30 Later, Kim et al. applied the van Krevelen diagram to plot the elemental compositions obtained by FT-ICR MS.24 To construct a van Krevelen diagram out of information obtained from high resolution mass spectrometry, accurate mass numbers obtained from the spectra are first converted into elemental formulae. Secondly, each of the molar ratio of hydrogen-to-
carbon (H/C ratio) and the molar oxygen-to-carbon ratio (O/C ratio) of the formulae are plotted as the ordinate and the abscissa. In this way of plotting, each peak (or formulae) observed in a crude oil spectrum is plotted as a dot in the diagram. Van Krevelen diagram can be used to plot heteroatom classes and each heteroatom class can be plotted by these Krevelen diagrams. The van Krevelen diagram can be used to estimate major components observed in complex mass spectra.24
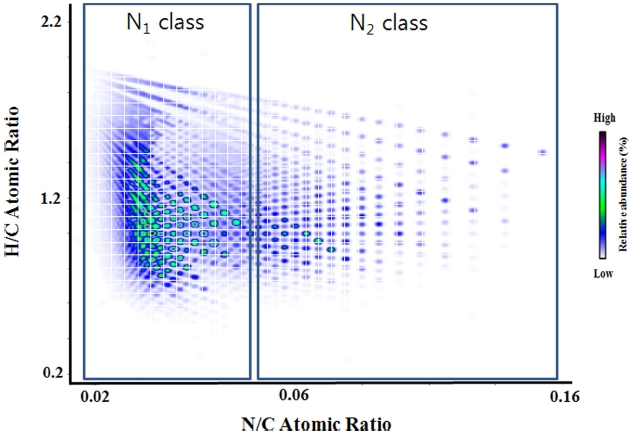
The relative abundance of peak observed in a given spectrum can be color-coded and presented as a contour plot.31 An example of van Krevelen diagram constructed from a crude oil spectrum is presented in Figure 2. In the diagram, molar hydrogen-to-carbon ratios (H/C ratio) were plotted as the ordinate and molar nitrogen-to-carbon ratios (N/C ratio) were plotted as the abscissa. The van Krevelen diagram is very effective in displaying classes containing the same hetero atoms but with different numbers of heteroatoms. The N1 and N2 classes of compounds are displayed in the diagram shown in Figure 2 and it is clear that they are separated in the diagram by N/C ratio.
To plot formulae in the van Krevelen plot, the elemental formulae must have the same types of hetero atoms. Therefore, the van Krevelen plot can’t be used to compare different heteroatom classes. For an example, O2 and N1 classes can’t be compared by use of this technique.
Double-bond equivalence vs. carbon number plot
Double-bond equivalence (DBE) represents the number of double bonds and rings in a given molecular formula and can be calculated by the following equation for elemental formulae CcHhNnOoSs:
DBE = c ? h/2 + n/2 + 1 (4)
DBE is very important because it enables us to predict chemical structures from elemental formulae. For example, a compound with benzene ring structure has DBE value
of 4. Compounds each with naphthalene and anthracene core structure will have DBE value of 7 and 10. This means that addition of aromatic ring would increase DBE value by 3. Therefore, if there are series of elemental formulae which are different from each other by DBE value of 3, one can predict that the series of compounds can have aromatic structures.
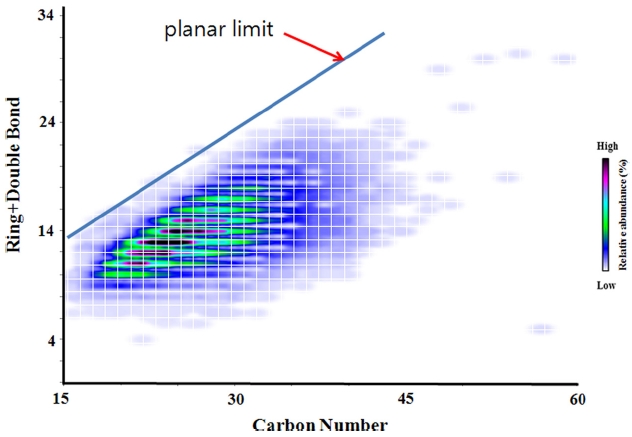
The DBE values calculated from elemental formulae can be plotted against carbon number. The plot is often called “DBE vs carbon number plot”. In the plot, the relative abundance of each peak can be color coded. An example of DBE vs carbon number plot generated from high resolution mass spectrum of a crude oil is shown in Figure 3. DBE vs carbon number plot can be a useful tool to figure out structures of compounds existing in crude oil sample.32 Especially, the concept of planar limits can be used for structural interpretation. In a given DBE vs carbon number plot, planar limits can be defined as a line connecting maximum observed DBE values with carbon numbers.33,34 The planar limit is marked in Figure 3. The structural features of the observed peaks are responsible for the variation of the slopes and intercepts of the planar limits. Structures of molecules existing in the saturates, aromatics, resins and asphaltene (SARA) fractions were proposed based on the slopes and intercepts planar limits and observed elemental formulae.32
Another interesting concept originated from DBE vs carbon number plot is the compositional boundary.35,36 The compositional boundary indicates the maximum DBE values that any synthetic or natural chemical compounds can have. The line defining the compositional boundary can be calculated by the following equation.35, 36
The compositional boundary = carbon number + 1 (5)
The compositional boundary can be used when elemental formulae are assigned. It was reported that 10% of the possible elemental formulae for masses below 1000 Da could be excluded after the concept of compositional boundary was applied.35,36
Application of statistical analysis
In petroleomic study, it is very important to analyze multiple samples and compare the obtained high resolution mass spectra. It is because the relationship between chemical and/or physical properties of crude oils and mass spectral information cannot be fully understood only with a few samples. Instead, many crude oil spectra must be analyzed and interpreted. This means that a large number of peaks easily exceeding 1,000,000 peaks have to be processed at a time. Therefore, it is indeed a great analytical challenge to extract relational information between observed peaks and the properties of crude oils. Statistical analyses have been successfully used to better understand large data sets, and hence it is reasonable to expect that statistical analyses can be successfully applied to study large amount of petroleomic data.
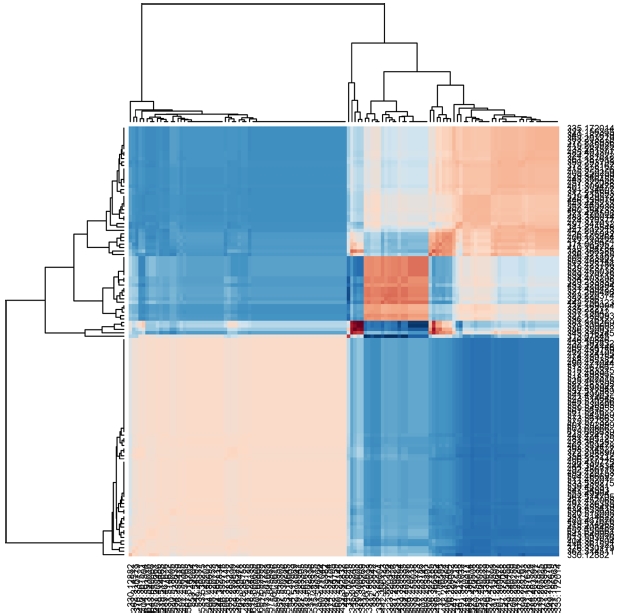
A statistical analysis program was developed and applied it to study 20 different samples.37 In the previous study, principal component analysis (PCA) was successfully applied to group the samples based on their chemical compositions and enabled the identification of compositional differences. Additionally, hierarchical analysis (HCA) was successfully used to compare the samples. Figure 4 shows the results obtained from HCA of petroleum samples. The resulting data are presented by heat map and clustering.
For the statistical analyses to be more effective, data obtained by petroleomic technique should be more quantitative. However, at this moment, data provided by FT-ICR MS is semi-quantitative at best. Therefore, there
should be more effort devoted to improve quantitative nature of petroleomic data.
Correlation is one of the important statistical methods by which relationship between two variables are identified. The correlation analysis has been applied to verify the validity of the key assumption of petroleomics that the spectral findings from high resolution mass spectrometry are related to crude oil properties.38 If the assumption is not valid, the practical usefulness of petroleomics will be greatly limited. Therefore, the assumption is very important for petroleomics. The assumption was validated by seeking correlational relationships between peaks identified by high-resolution MS and the chemical/physical properties of crude oils.38
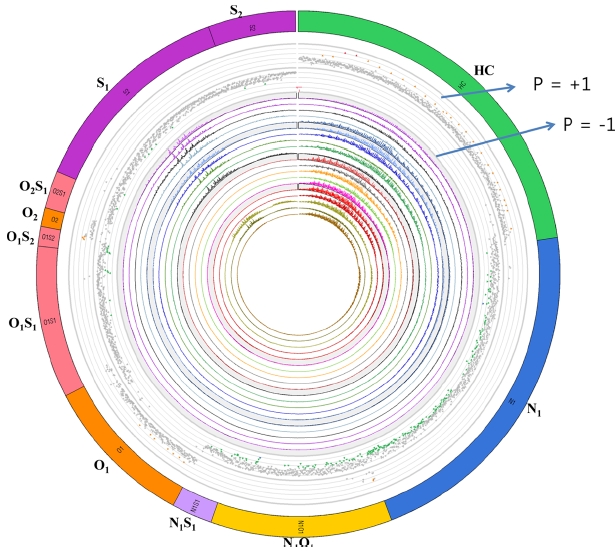
The result of correlation analysis was presented using a Circos diagram (Figure 5). The Circos diagram was originally developed for genomic research and it is a very effective in visualizing complex data. In the diagram shown in Figure 5, the outside shell designates heteroatom classes. Dots located in the second shell inside the class shell represent peaks in the heteroatom classes with significant correlation with the property. The peaks located near the line just inside the second shell have correlation value (P value) of +1 and the ones located near the third shell have correlation value of ?1. The peaks with P value of +1 mean that they have positive correlation with the property and ones with ?1 denote negative correlation. The circle at the center shows the distribution peaks in the studied spectra.
In the previous study,38 it was shown that high resolution mass spectra of crude oils showed correlational relationships with important chemical and physical properties of crude
oils such as sulfur and nitrogen contents, and total acid number. Therefore, this opens up the door for chemicalcomponent- based prediction of the properties of crude oils.
Conclusions and future studies
The application of FT-ICR MS to the analysis of crude oils has begun a new era to improve the knowledge of these materials at the molecular-level. However, these complex mixtures still remain mysterious with many issues. For example, quantitative understanding of the numerous compounds observed by FT-ICR MS is still very difficult. Future research will need to be focused on (i) quantitative interpretation, (ii) improving separation, and (iii) combining data obtained with other techniques such as ion mobility mass spectrometry to do structural interpretation.39,40