Various methods have been investigated to increase photon density in soft tissue, an important factor in low-level laser therapy. Previously we developed a compression-controlled low-level laser probe (CCLLP) utilizing mechanical negative compression, and experimentally verified its efficacy. In this study, we used Bezier curves to numerically simulate the skin deformation and photon density variation generated by the CCLLP. In addition, we numerically modeled changes in optical coefficients due to skin deformation using a linearization technique with appropriate parameterization. The simulated results were consistent with both human in vivo and porcine ex vivo experimental results, confirming the efficacy of the CCLLP.
Ultraviolet (UV), visible, and near infrared (NIR) light have been extensively used in therapeutic and diagnostic modalities [1-3]. However, the depth of light penetration is still limited to a few centimeters because of the light scattering property of tissue, resulting in low photon densities.
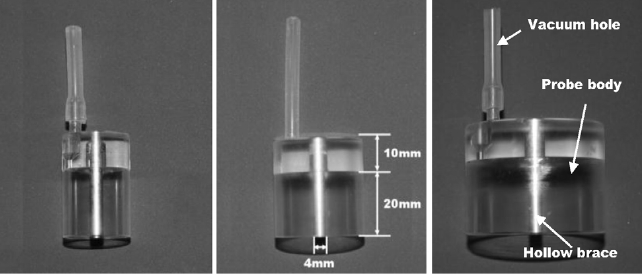
Various methods such as increasing the power and diameter of the incident beam [3-5], application of optical clearing agents [6,7], and skin compression [8-10] have been suggested to increase the photon density in tissues. In a previous study, we developed a compression-controlled low-level laser probe (CCLLP) to increase the photon density in tissues by applying negative compression [11]. Figure 1 represents the CCLLP, which consists of a vacuum hole to supply negative compression, a hollow brace for guiding and supporting the optical fiber, and an acrylic probe body to maintain the negative compression applied to the tissue. We experimentally validated the efficacy of the CCLLP by measuring the photon density in ex vivo porcine skin samples [11].
In another previous study, we mathematically modeled and simulated the effects of tissue compression [10]. We simulated tissue compression in two ways: (1) non-uniform skin deformation with constant optical coefficients and (2) uniform skin deformation with variable optical coefficients depending on changes in skin thickness. However, neither of these approaches accurately simulated the mechanism of the CCLLP.
Although several numerical simulations for non-flat boundaries or layers have been reported [12,13], the geometry
of the outer boundaries and inner layers similar to the skin affected by the CCLLP has not been described. The skin region affected by the CCLLP swells outward except for the area under the optical fiber probe. In the previous uniform compression study [10], the photon density did not increase in the swollen areas but increased in the region of skin under the optical fiber probe. In this study, which is a fundamental generalization of the simulation reported in [10], we numerically simulated such competing effects between the swollen and compressed regions in the CCLLP.
In three subjects, we experimentally measured the change in skin thickness due to negative compression and used the values for the numerical simulations. We represented the deformation of the skin surface associated with the CCLLP using three quadratic Bezier curves. We also numerically modeled the changes in optical coefficients with changes in skin thickness using a linearization method. We obtained simulation results as functions of the modeling parameters, radius of the CCLLP, and negative compression, and compared these with results from an
The photon density in tissues was modeled using the radiative transfer equation or its diffusion approximation [14]. The diffusion approximation in the frequency domain was represented by the following elliptic partial differential equation in the region of interest Ω :
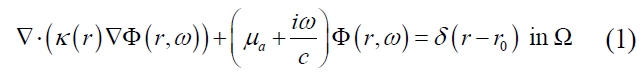
where
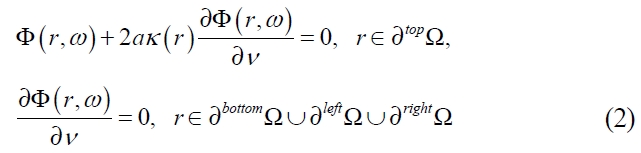
To solve (1) using the finite element method (FEM), the geometrical domain Ω was assumed to be bounded, and appropriate boundary conditions were assigned to the boundary
∂top Ω =[-w, w]×{0}: the top of the skin contacting the air
∂bottom Ω =[-w, w]×{-d}: the bottom of the skin region of interest
∂left Ω ={-w}×{-d,0}: the left of the skin region of interest
∂right Ω ={-w}×{d,0}: the right of the skin region of interest
Note that only
Let us divide Ω into small triangles or rectangles, which are called finite elements, and {
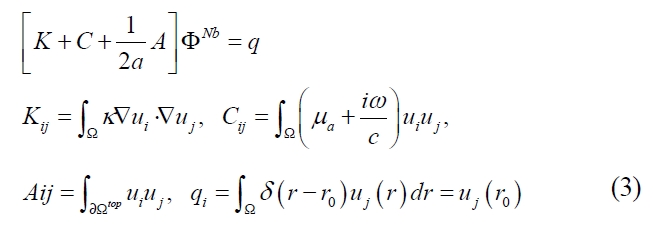
The finite element solution for (3) was found using COMSOL 3.4 (COMSOL AB, Stockholm, Sweden). In the simulation, the photon density, or light fluence rate, was measured at the bottom ∂bottomΩ of the domain of interest and at a distance 7.5 cm away. However, we could neglect the 7.5 cm distance in the air for the photon density measurement since light is mostly absorbed and scattered in the tissue rather than in the air.
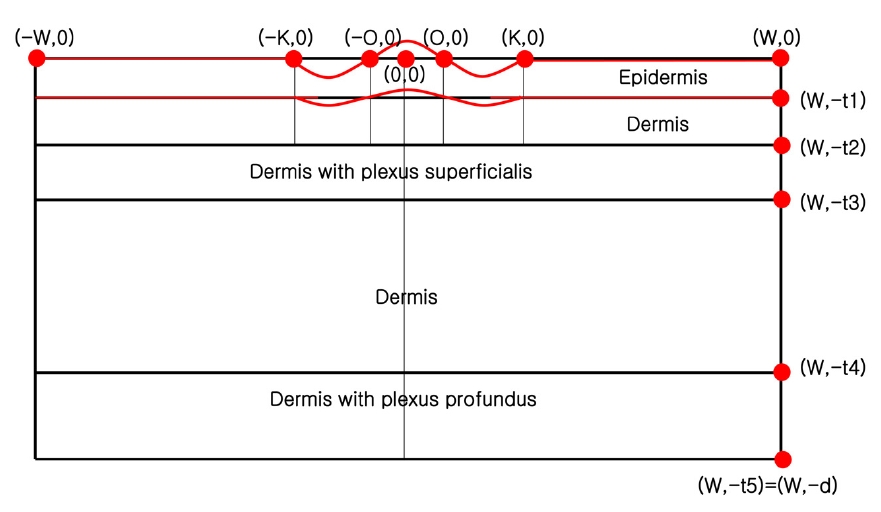
The optical properties of human tissues have been reported in several studies [3,15]. Based on these studies, a five-layer skin model was used for a 633 nm light [3].
2.1. Skin Deformation by Negative Compression
For simplicity, we modeled the domain of interest Ω in two dimensions by neglecting the y-axis. When there is no compression, Ω is given as follows:
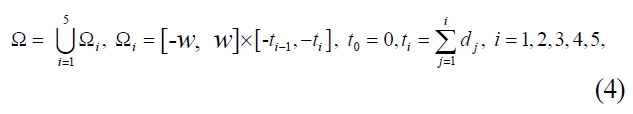
where Ω
We then formulated the layers Ω
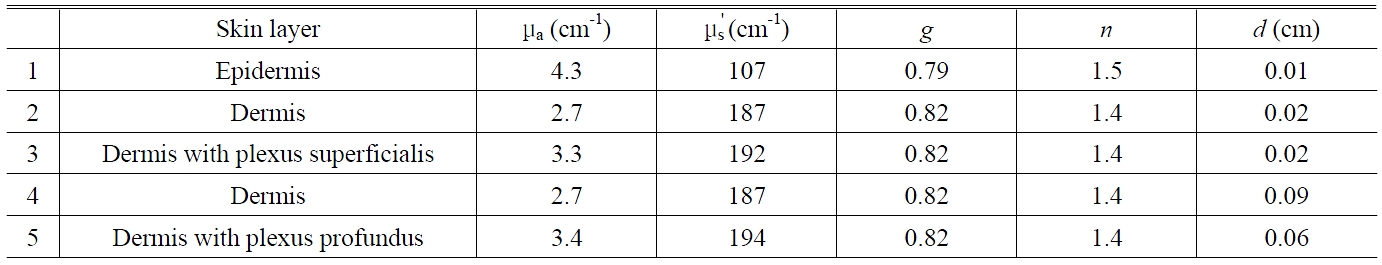
Five-layer skin model for 633 nm light used to numerically model the photon density profile in tissue
the length of the region contacting the guide for the optical fiber, respectively. Let
where C was chosen as
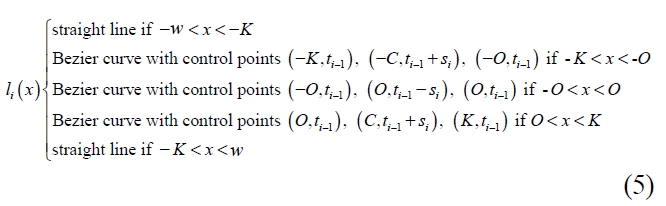
Using the definition of a quadratic Bezier curve, we obtained the following detailed representations for
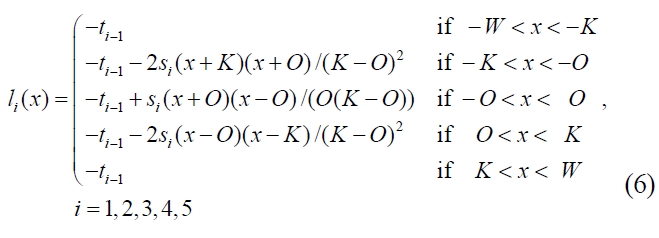
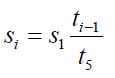
Therefore, the thicknesess of the i layers are as follows:
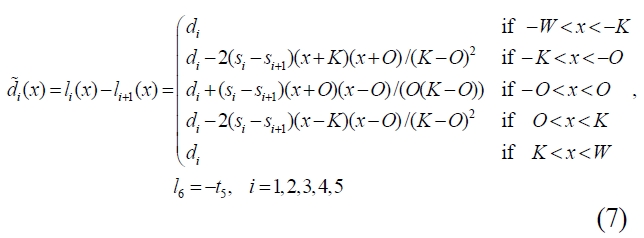
Assuming the thickness changes for the third, fourth, and fifth layers are relatively small and the change for second layer is half of the change in the first layer, we let
s3 = s4 = s5 = 0 and
2.2. Change in Optical Coefficients with Negative Compression
In the CCLLP, negative compression is applied to the skin surrounding the central area

and
be the optical coefficients for the i-th layer (

respectively. Using an analysis similar to that in [10], we assumed that the relationship between the thickness and the absorption coefficient is:
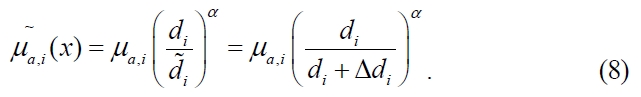
The coefficient
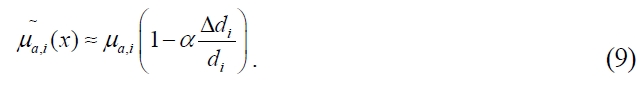
Equation (8) is linearly approximated as follows:
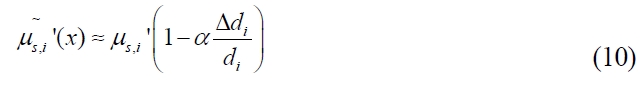
Similarly, we obtained the following relationship between the thickness and the reduced scattering coefficient:
Given that the diffusion coefficient is defined as a constant multiplied by the reciprocal of the sum of the absorption and reduced scattering coefficients, using (9) and (10) we obtained:
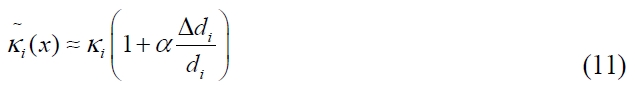
In (9), (10), and (11), we used first-order Taylor series approximations.
Using (7) and (11), we obtained an explicit representation of the diffusion coefficient as follows:
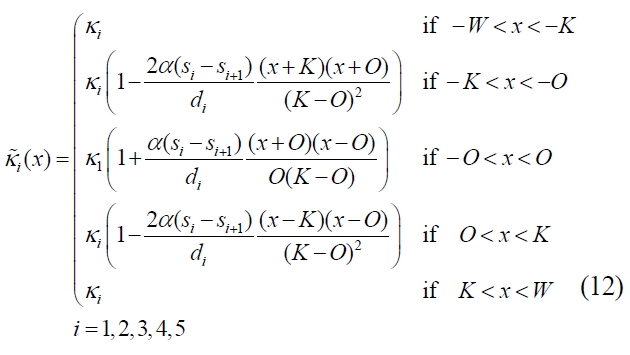
We chose the value for s1 based on the data shown in Figure 4, and
decreased with the ratio of the depth from the surface to the entire depth of the skin. Thus, (12) becomes:
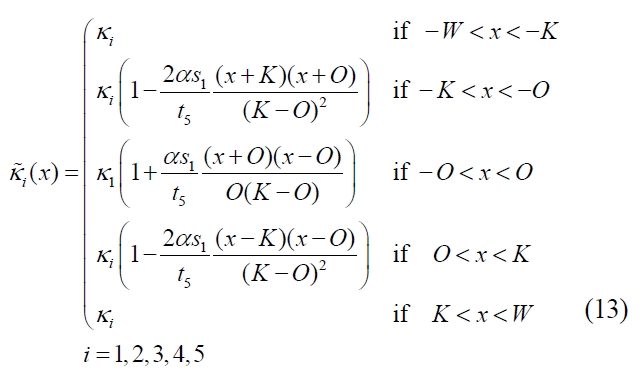
and (9) becomes:
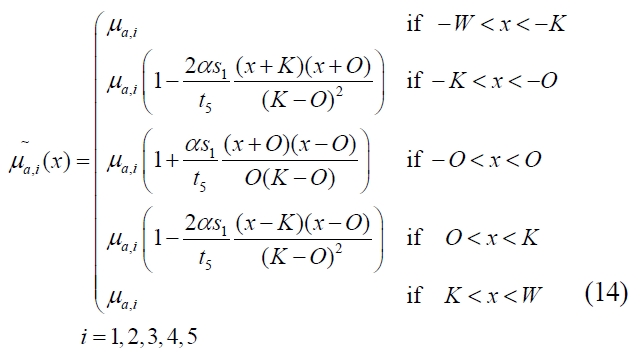
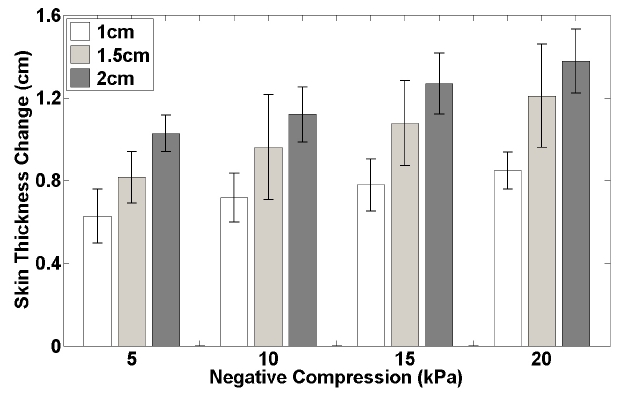
Figure 1 shows CCLLPs with radii of 1, 1.5, and 2 cm. In Figure 3, Skin deformation by negative compression was investigated in the left arms of three subjects. Figure 4 shows the change in skin thickness averaged across the three subjects during negative compression as a function of the radius of the CCLLP. As described in the section II.1, the change in skin thickness was modeled using three Bezier curves with continuous tangential lines.
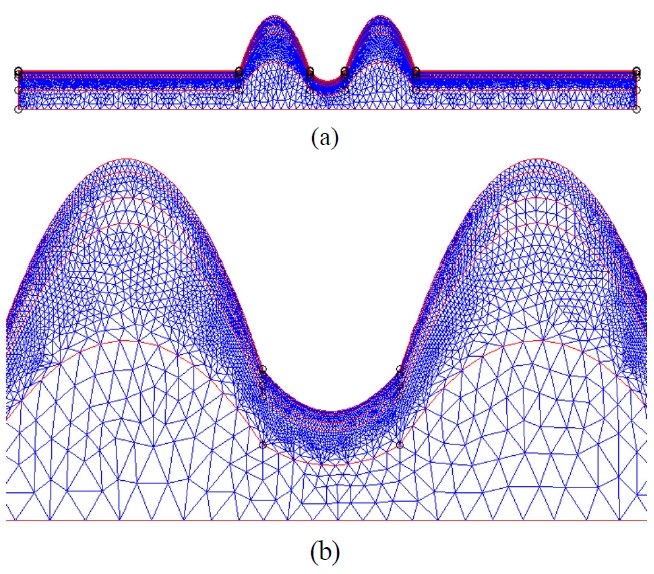
For the FEM analysis of the CCLLP, a finite element mesh was applied to the modeled geometry of the skin. We used meshes shown in Figure 5 for the skin deformation geometry to obtain the photon density distribution by FEM. The mesh is finer in the upper layers and coarser in the lower layers because skin deformation is expected to be less pronounced in the lower layers.
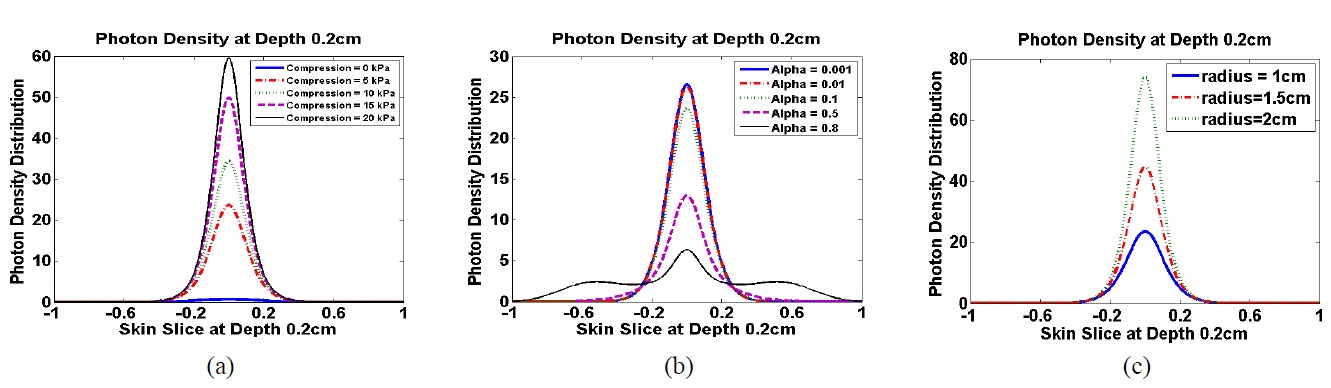
The optical coefficients for the five layers used in modeling the skin structure are shown in Table 1 [3]. The resulting photon density distributions at a depth of 0.2 cm below the skin surface are presented in Figure 6 as functions of negative compression, the thickness-coefficient
relation parameter
In our previous study [11], we investigated the efficacy of CCLLP by measuring the photon density distribution in
The photon density in the tissue due to negative compression was influenced by two successive and competing physical phenomena: (1) the change in skin thickness due to compression and (2) the change in optical coefficients due to the change in skin thickness. In previous studies, the correlation between the change in skin thickness and negative compression was mathematically modeled using elastic equations [18,19]. In this study, the correlation was experimentally obtained from three subjects, and the data (Figure 4) was used to mathematically simulate the mechanism of the CCLLP. The changes in skin thickness for all three subjects were approximately proportional to the logarithm of the negative compression, which corresponds well with the results of previous studies [18,19].
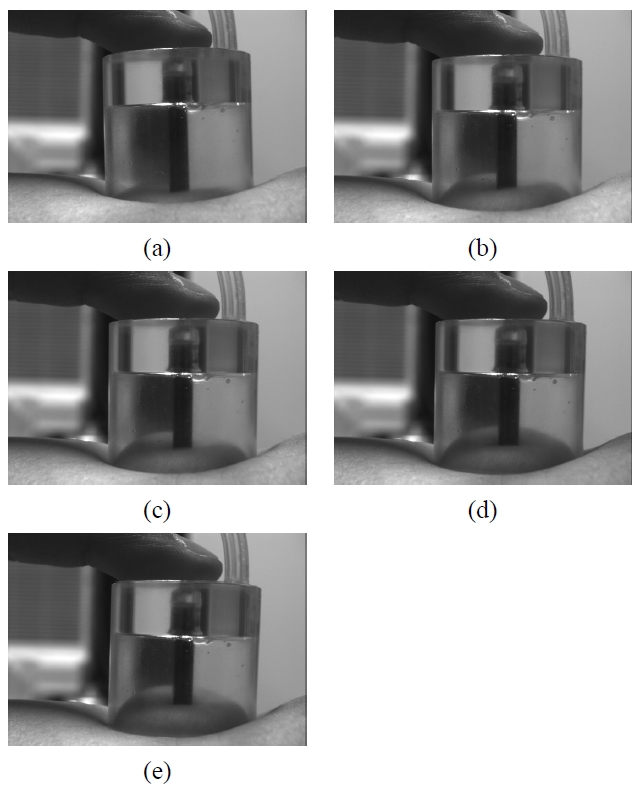
Skin surface deformation by the CCLLP was experi
mentally measured as a function of negative compression (Figure 3). The region of skin contacting the optical fiber probe was compressed for two reasons: (1) this region of the skin was pressed down and thus could not swell up, and (2) the skin in the contacted region was pushed aside to the surrounding region, which swells outward. In other words, the skin inside the CCLLP, except for that in contact with the optical fiber probe, swells outward, whereas the contacted region is compressed inward. Thus, the skin surface can be modeled by: (1) two straight lines representing the two flat areas of skin outside the CCLLP, (2) two concave Bezier curves representing the raised skin region inside the CCLLP not contacting the optical fiber probe, and (3) one convex Bezier curve representing the compressed skin region contacting the optical fiber probe. The two concave Bezier curves and the convex Bezier curve were constructed to satisfy the C1 assumption at the two points where the curves meet, representing the boundary of the optical fiber probe. The C1 assumption states that the tangential lines representing the skin surface, as well as the skin surface itself, are continuously connected across the optical fiber probe inside the CCLLP. In other words, the skin surface deformation due to negative compression should be smooth and not have any discontinuities along the skin surface. The resulting skin surface deformation was shown in Figure 5.
The optical coefficients are known to be inversely proportional to skin penetration depth [8,9]. However, the relationship has been experimentally investigated with only a limited number of samples and is not well established for human or animal skin samples. Therefore, the relationship was mathematically modeled [10] when uniform compression was applied to the skin surface, corresponding to
The skin thickness at the center decreased because of negative compression, resulting in increased photon density. At the same time, by the result of [8,9,10], we assumed that the optical coefficients (including the absorption coefficient (8),(9), the reduced scattering coefficient (10), and the diffusion coefficient (11)) per unit skin penetration depth increased through the optical modeling coefficient
The peak intensities of photons in the
The CCLLP was developed to increase the photon density in tissues by applying negative compression. Skin deformation due to the CCLLP was numerically modeled using three Bezier curves. The finite element simulation used experimental data on changes in skin thickness from three human subjects, skin deformation modeling, and changes in optical coefficients as a function of the optical modeling coefficient
Φ : The photon density profile [W/cm2]
q : The light source function [W/cm3]
R : The Robin function, which is the photon density profile with respect to the Dirac delta source [W/cm2]
μ a : The absorption coefficient [cm-1]
μ s : The scattering coefficient [cm-1]
g : The anisotropy factor
μ s' : The reduced scattering coefficient [cm-1] [μ s' = (1-g) μ s]
κ : The diffusion coefficient [cm] [κ = (3(μ a μ s'))-1]
n : The refractive index
a : The reflection coefficient on the surface
c : The speed of light in a vacuum [cm/sec] (c = 2.99×1010 cm/sec)
ω : The angular modulation frequency of the source intensity [sec-1]
Ω : The region of interest (skin structure)
∂ Ω : The boundary of Ω (∂ Ω = ∂
∂
∂
∂
∂
N


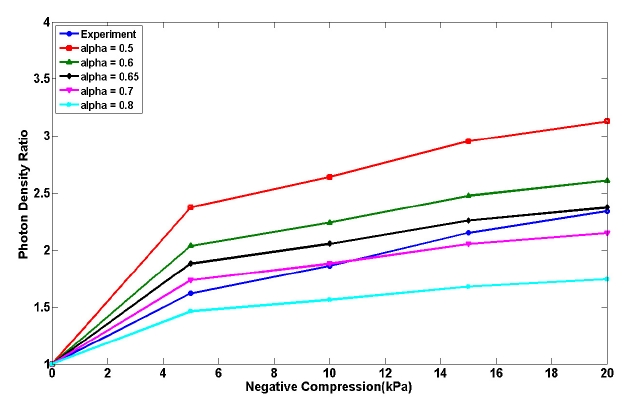
![The comparison of experimental photon density ratios [11] and modeling results with respect to the various values of the optical coefficient modeling parameter α . The photon density ratio is defined as the ratio of the photon density distribution with negative compression (0, 5, 10, 15, or 20 kPa) to that without compression (0 kPa)](http://oak.go.kr/repository/journal/11509/E1OSAB_2011_v15n4_321_f007.jpg)