검색 전체 메뉴
PDF
맨 위로
OA 학술지
In Situ Fluorescence Optical Detection Using a Digital Micromirror Device (DMD) for 3D Cell-based Assays
  • 비영리 CC BY-NC
  • 비영리 CC BY-NC
ABSTRACT
In Situ Fluorescence Optical Detection Using a Digital Micromirror Device (DMD) for 3D Cell-based Assays
KEYWORD
Optical microscopy , Digital micromirror device , Fluorescence optical detection
  • I. INTRODUCTION

    Use of microfluidic cell culture systems has been widespread for the investigation of precise in vitro cell-based models, because the systems can be made to provide an in vitro environment that closely mimics an in vivo condition by adjusting various cell culture parameters focused on specific issues, such as cell-to-cell interactions to co-culture responses to biochemicals [1-3]. Most of the cell culture systems are constructed for two-dimensional (2D) monolayer cell cultures where the behavior of cultured cells may differ signifi-cantly from that of cells in tissue matrix in vivo. In other words, the quest of implementing an in vitro cell culture system that truly mimics in vivo environment has been largely compromised by the use of 2D cultures. For this reason, three-dimensional (3D) cell cultures have been developed and they have shown markedly distinctive behaviors from their 2D counterparts [4, 5]: for instance, higher enzymatic activity was reported when a HepG2/C3A human hepatoma cell line was employed using 3D cultures, while the cell line lacked a specific enzymatic activity in conventional 2D cultures [6, 7].

    One of the issues in 3D cell-based assays is the require-ment of a noninvasive analytical method that allows measurement of precise dynamics or behaviors of 3D cell cultures. Among various analytical methods, optical approaches using fluorescence indicators have consistently produced a convenient yet reliable tool for various cell-based assays[8-10]. In particular, we have developed optical analytical tools for monitoring cell status in situ to address multi-cellular microfluidic cell culture systems, e.g., a 2D in situ fluorescence optical detection system (ISFODS) for studying 2D cultures[11, 12] and indirect and direct 3D measurement of cell dynamics of 3D HepG2/C3A cultures[7, 13]. These approaches are limited in the sense that detailed cellular processes were averaged out in the lateral plane and only axial information of thick biological samples was acquired. More importantly, out-of-focus light scattering is not blocked and thus can affect the result to the degree that layer-by-layer dynamics in 3D cultures are completely drowned in the background.

    Here, we address this limit by using a DMD-based ISFODS(DMD-ISFODS) for studying 3D cell cultures. The DMD-ISFODS is designed to provide fluorescence signals from 3D cell cultures with enhanced depth resolution by employing a DMD for fast lateral scanning. Also, the DMD-ISFODS allows us to monitor biological responses with flexible optical sectioning strength because an aperture can be adjusted during observation. For example, a DMD can be used to form multiple pinholes, multiple line slits, or an S-matrix based pseudorandom sequence to reduce photobleaching and photodamage while improving resolution via structured illumination [14-17]. A DMD consists of multiple micromirror arrays which can be controlled electronically [18, 19].Thus, lateral scanning can be implemented in a short time compared to using a motorized stage and structured wavefront modulation can be performed for flexible fluorescence microscopy. Furthermore, a DMD is compact and portable in size, making a DMD-ISFODS much smaller than one based on motorized stages. To date, DMDs have been evaluated in confocal microscopy for imaging 2D cultures [20, 21]and used in optical computed tomography of tissue samples with moderate thickness up to 20 ㎛ [22]. Also, compressive sensing microscopy based on a DMD was investigated for optical sectioning of pollen grains [23]. Time-resolved 3D confocal fluorescence microscopy was developed using a DMD with limited maximum scan thickness [24].

    In this feasibility study, we have constructed a DMD-ISFODS to be installed in a conventional cell culture incubator and tested initially with a USAF target for resolution evaluation and fluorescence microbeads as cell substitutes. We have then applied the DMD-ISFODS to real-time monitoring of cell statics in 3D cell cultures.

    II. MATERIALS AND METHODS

       2.1. Schematics of DMD-ISFODS

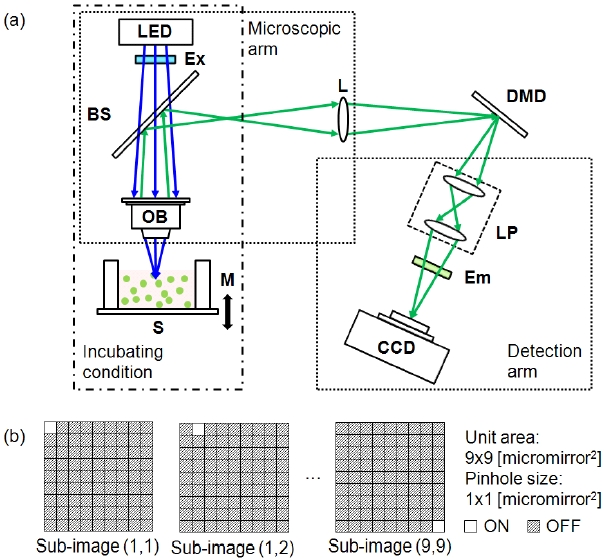
    Figure 1 illustrates a simple schematic of the DMD-ISFODS.

    The optical detection system consists of three parts: microscope arm, detection arm, and DMD. The microscope arm is made up of a light emitted diode (LED; λ0 = 447.5 nm, OT16-5100-RB, Rhopoint Components, Hurst Green, UK), an excitation filter (Ex; 455/70, Chroma Technology, Bellows Falls, VT, USA), a beam splitter (BS; CM1-BS013, Thorlabs, Newton, NJ, USA), and an objective lens (OB; Olympus, Tokyo, Japan). Various objective lenses were tested for optimal performance. Excitation and emission wavelengths of the DMD-ISFODS can be easily changed by replacing LEDs and filter sets. In order to extend an image focal plane to DMD, an achromatic lens (L; f = 100 mm, AC254-100-A-ML, Thorlabs) is placed between the microscope arm and the DMD. The depth scan was performed by a linear motorized stage (M;M00UTM100CC1DD, Newport, Irvine, CA) at a speed of 5 ㎛/sec. The detection arm consists of a matched achromatic doublet pair (LP; f1 = f2 = 100 mm, MAP10100100-A, Thorlabs) that is attached to an adjustable-length lens tube for focusing, an emission filter (Em; 540/25, Chroma Technology), and a charge-coupled device (CCD) camera (QIC-F-M-12, pixel size: 4.65 × 4.65 ㎛2, Qimaging, Surrey, BC, Canada). For the acquisition of fluorescence signals in sectioned images, a CCD camera with a high dynamic range is desired. The microscope arm and the DMD are aligned in the same axis while the detection arm is tilted 24° for the CCD camera in the detection arm to acquire optical signals from on-state micro-mirrors only. For alignment of a DMD, we employ two rotation stages (RSM-2, Nam-il Optical Com-ponents, Incheon, Korea) and a linear translation stage (ACS-26, Nam-il). In addition, a rotation stage and a linear translation stage (BTS-25, Nam-il) are attached to a CCD camera for obtaining precise alignment of a CCD camera with the DMD. The DMD (DiscoveryTM 3000 kit, Texas Instrument, Dallas, TX, USA) is based on a 0.7 XGA chip (1024 ×786, mirror size: 13.68 × 13.68 ㎛2), a DMD controller and an ALP-3, a supporting board for external communication to a personal computer. DMD pattern-scanning and acquisition of images are controlled by a customized program written by LABVIEWTM (National Instruments, Austin, TX, USA).

       2.2. Scanning and Imaging Reconstruction

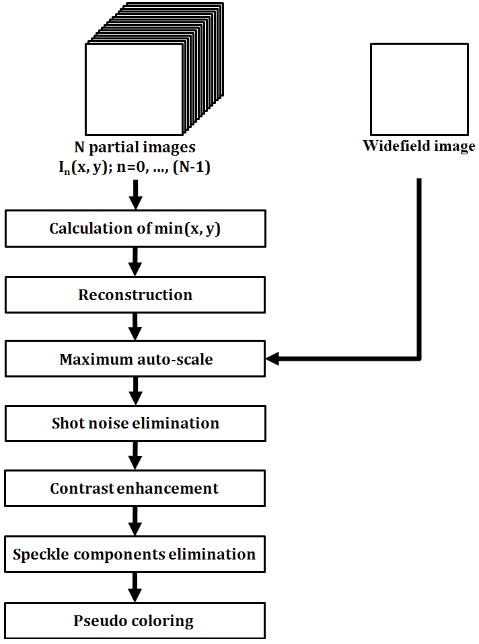
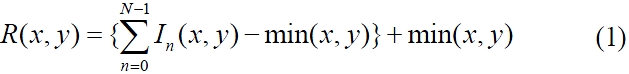
    Multiple pinhole apertures were used for a DMD to produce fluorescence images with fast image acquisition.In particular, 48 × 35 pinhole arrays were employed for lateral scanning. Each pinhole aperture was a single on-state DMD micro-mirror pixel sized 13.68 × 13.68 ㎛2 and scanned in a 9 × 9 matrix of a 187.14 × 187.14 ㎛2 area. The separation between pinholes is an indicator of image clarity, because pinholes farther apart would enhance depth resolution at the expense of slower scanning. For our study, pinholes were separated by 8 pixels, which was the closest distance with no visible image crosstalk. A final image was reconstructed from the intensity measured by the CCD through pinhole aperture arrays and after background correction in a 696 × 520 elements for each lateral scan. We tested two image reconstruction algorithms, (max - min) and [{summation of (image-min)} + min],

    for 3D optical sectioning images [25]. After adjusting the fluorescent bead.algorithm to make it less prone to background noise, we have mainly employed the latter, which is given by

    image

    The overall image reconstruction scheme is presented in Fig. 2. Based on this scheme, the reconstruction of a single lateral image took approximately 3-4 seconds.

    For the determination of the axial point spread function(PSF) of the DMD-ISFODS, measured intensity of fluorescence microbeads was deconvoluted as follows: first, we assumed the shape of a single fluorescence microbead as a perfect sphere and the emission intensity distribution as a constant.Fluorescence intensity of microbeads (diameter Φ = 10 ㎛)is then given by by

    image

    with |z| < 5. Here, z denotes the depth axis.

       2.3. Sample Preparation

    The 3D matrix for evaluating DMD-ISFODS was alginate-based and embedded with fluorescent beads or stained cells and was 1 mm thick in a single circular chamber fabricated on a PDMS (Polydimethylsiloxan) substrate. Fluorescent beads were sized to be 10 ㎛ in diameter (F8836, Invitrogen, Carlsbad, CA, USA). For cell imaging, we have used A431 human epidermoid carcinoma cell-line that was obtained from the ATCC (Manassas, VA, USA). Cells were cultured in T-flasks in Eagle’s Minimum Essential Medium with 10% fetal bovine serum (FBS) in a mammalian cell culture incubator

    with 37℃ temperature and 5% CO2. The details of cell culture protocol and preparation of 3D cell cultures in extracellular matrix and cell culture systems are described elsewhere [13].

    III. EXPERIMENTAL RESULTS

       3.1. PSF of DMD-ISFODS

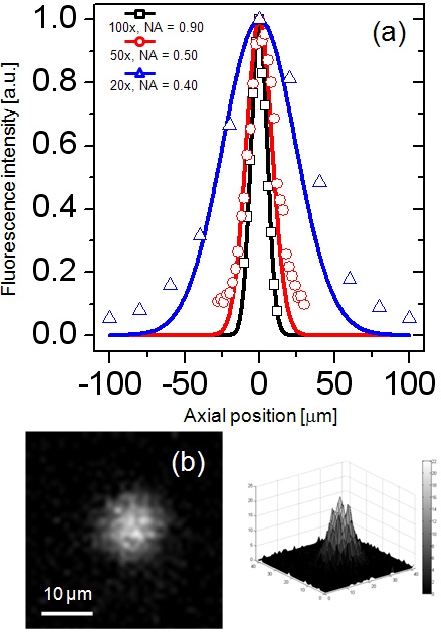
    Axial PSF of the DMD-ISFODS was measured using various types of objective lenses on fluorescence beads as shown in Fig. 3. The depth of focus (DOF) was ± 6.3 ㎛ with an objective lens at 100x and NA = 0.90, which is in good agreement with the Berek formula. Overall imaging performance of the DMD-ISFODS is diffraction-limited. Note that in analyzing 3D cultures, an extremely long working distance is required because the cultures can be easily several hundred ㎛ thick while sub-cellular optical sectioning may not be critical. For this reason, we used an objective lens with lower magnification (20x, NA = 0.40) in actual acquisition of images, in which case measured DOF was ± 28.7 ㎛, because its large working distance allows depth scanning through a thick 3D culture matrix.

       3.2. Evaluation of DMD-ISFODS

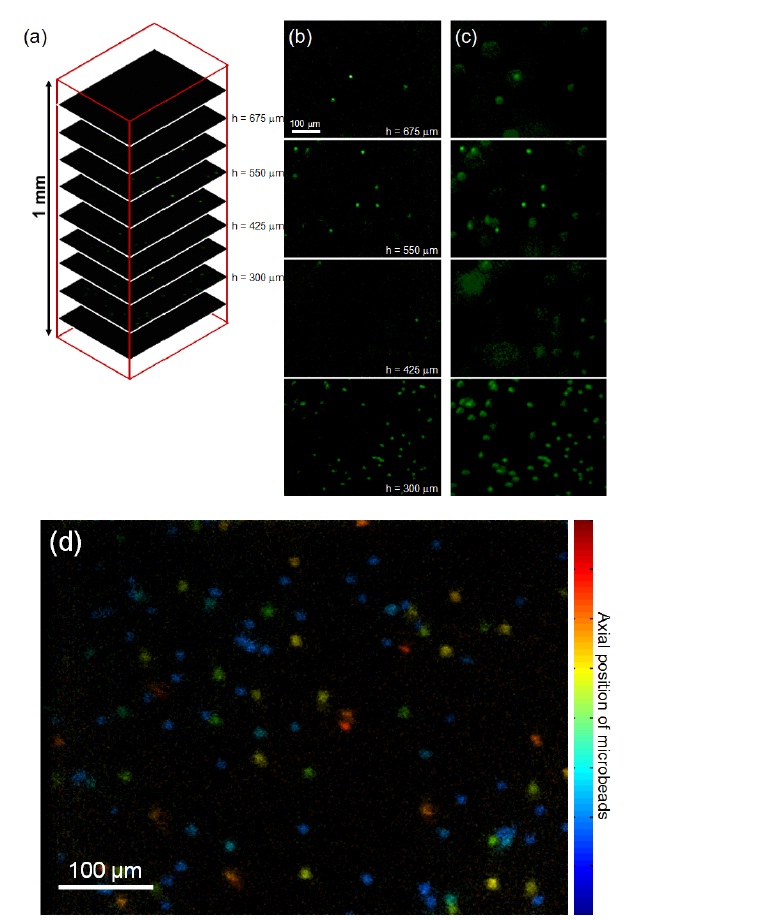
    Figure 4 (a) presents the image stacks captured by DMDISFODS.The depth is indexed by h such that h = 0 represents the bottom of 3D matrix and h = 1 mm the top.

    In total, 37 images were captured for a 1-mm scan, although only 9 images are shown in Fig. 4(a) for image presentation. Figure 4(b) shows the images of fluorescent beads captured by DMD-ISFODS. For comparison, wide-field images are provided in Fig. 4(c). Wide-field microscopy here is based on the same optical set-up illustrated in Fig. 1, except that the DMD does not produce pinhole aperture arrays and all DMD pixels reflect light. As expected, the fluorescence images taken by multiple pinhole aperture-based DMD-ISFODS provide much more crisp images of the beads by filtering the out-of-focus component of scattered light, although out-of-focus fluorescence is not completely blocked because of a large DOF. The large DOF is entailed by the long working distance that is needed for visualizing a thick 3D matrix.

    For quantitative comparison of multiple pinhole aperture-based DMD-ISFODS and wide-field microscopy, we have introduced image blur ratio of a single fluorescence microbead. Image blur ratio here is defined as the ratio of the number of pixels with non-zero intensity to the total number of pixels

    that are analyzed. This ratio can represent the amount of in-focus component over out-of-focus blur and be an indicator of image clarity when the DOF is much larger than the pixel size. Under the definition, measured images are sharper with a smaller image blur ratio. In Fig. 4, we have analyzed 52 fluorescence microbead images, each occupying an area of 35 × 35 pixels. Image blur ratio was determined as 0.18± 0.04 for DMD-ISFODS and as 0.43 ± 0.16 for wide-field images. In other words, DMD-ISFODS provides improved images over wide-field microscopy by 2.5 times in terms of image clarity.

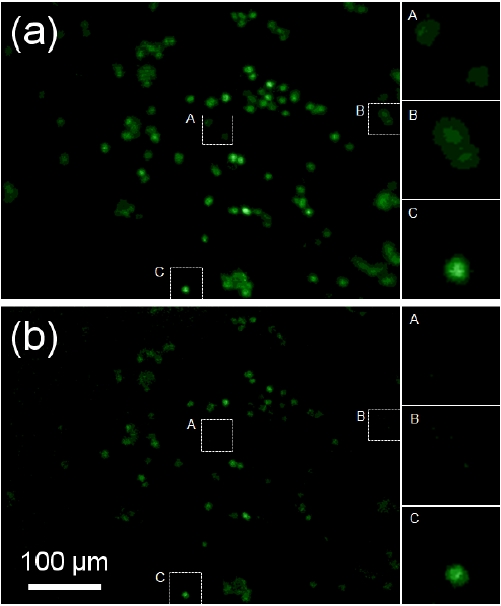
    For imaging cells embedded in the 3D matrix, scanning was limited to a relatively short distance under 100 ㎛,because fluorescence emission efficiency of intracellular labels was low compared to that of fluorescent beads. However, similar to Fig. 4, improved images of cells were obtained with DMD-ISFODS as it removes background fluorescence more efficiently, as clearly shown when A and B are compared in Fig. 5(a) and (b). C in Fig. 5 also presents improvement of blurs in capturing cells in the focal plane. Regarding the limit in the scanning distance, we believe that the use of a more sensitive detector such as an EM-CCD, possibly combined with a coherent light source, would improve the efficiency and the scanning distance, although this would make DMD-ISFODS less portable.

    The image clarity of DMD-ISFODS can further be improved, for example, by using structured illumination, which may require a high-power laser and a highly sensitive photo-imager because of low spatial filtering efficiency of a DMD [26]. Also, pinhole aperture scanning schemes may be improved: for example, modified scrambled-block Hadamard ensemble provides effective elimination of out-of-focused components [23].

    IV. CONCLUSION

    In summary, we have designed and implemented a DMD-based fluorescence imaging system in situ for analyzing 3D cell cultures. The DMD-ISFODS was found to improve the clarity of fluorescence images over wide-field microscopy by 2.5 times by removing out-of-focus optical signals based on sophisticated scanning of multiple pinhole apertures. In contrast to optical detection systems developed previously, DMD-ISFODS can provide both lateral and axial information of thick biological samples over a very long working distance. The smallest depth resolution achieved was 6.3 ㎛ with a 100x objective lens. The feasibility was demonstrated over full 1-mm scanning through 3D alginate-based matrix embedded with fluorescent microbeads and A431 human carcinoma cells. This study suggests two directions of further research. First, both illumination and detection arms need multiple pinhole aperture scanning for additional improvement of image clarity. Also, complex multiple-layered microfluidic devices should be developed.

참고문헌
  • 1. El-Ali J, Sorger P. K, Jensen K. F (2006) “Cells on chips” [Nature] Vol.442 P.403-411 google cross ref
  • 2. Goto M, Sato K, Murakami A, Tokeshi M, Kitamori T (2005) “Development of a microchip-based bioassay systemusing cultured cells” [Anal. Chem.] Vol.77 P.2125-2131 google cross ref
  • 3. Viravaidya K, Sin A, Shuler M. L (2004) “Development ofa microscale cell culture analog to probe naphthalene toxicity” [Biotechnol. Prog.] Vol.20 P.316-323 google cross ref
  • 4. Pampaloni F, Reynaud E. G, Stelzer E. H. K (2007) “Thethird dimension bridges the gap between cell culture andlive tissue” [Nature Rev. Mol. Cell Biol.] Vol.8 P.839-845 google cross ref
  • 5. Justice B. A, Badr N. A, Felder R. A (2009) “3D cell cultureopens new dimensions in cell-based assay” [Drug Discovery Today] Vol.14 P.102-107 google cross ref
  • 6. Sivaraman A, Leach J. K, Townsend S, Iida T, Hogan B. J, Stolz D. B, Fry R, Samson L. D, Tannenbaum S. R, Griffith L. G (2005) “A microscale in vitro physiological model of the liver: predictive screens for drug metabolism andenzyme induction” [Curr. Drug Metab.] Vol.6 P.569-591 google cross ref
  • 7. Sung J. H, Choi J, Kim D, Shuler M. L (2009) “Fluorescence optical detection in situ for real-time monitoring of cytochromeP450 enzymatic activity of liver cells in multiple microfluidic devices” [Biotechnol. Bioeng.] Vol.104 P.516-525 google cross ref
  • 8. Novak L, Neuzil P, Pipper J, Zhang Y, Lee S (2007) “An integrated fluorescence detection system for lab-on-a-chipap plications” [Lab Chip] Vol.7 P.27-29 google cross ref
  • 9. Sung J. H, Shuler M. L (2009) “A micro cell culture analog (μCCA) with 3-D hydrogel culture of multiple cell lines toassess metabolism-dependent cytotoxicity of anti-cancer drugs” [Lab Chip] Vol.9 P.1385-1394 google cross ref
  • 10. Kim W, Kim C, Lee S, Lim S, Park C, Lee H, Park M (2010) “Particle image velocimetry of the blood flow in amicro-channel using the confocal laser scanning microscope” [J. Opt. Soc. Korea] Vol.14 P.42-48 google cross ref
  • 11. Tatosian D, Shuler M. L, Kim D (2005) “Portable in-situ fluorescence cytometry of microscale cell-based assays” [Opt.Lett.] Vol.30 P.1689-1691 google cross ref
  • 12. Oh T, Sung J. H, Tatosian D. A, Shuler M. L, Kim D (2007) “Real-time fluorescence detection of multiple microscale cell culture analog devices in situ” [Cytometry A] Vol.71 P.857-865 google
  • 13. Choi J, Sung J. H, Shuler M. L, Kim D (2010) “Investi-gationof portable in situ fluorescence optical detection for microfluidic 3D cell culture assay” [35] Vol.35 P.1374-1376 google cross ref
  • 14. Dlugan A. L. P, MacAulay C. E (1999) “Update on the use of digital micromirror devices in quantitative microscopy” [Proc. SPIE] Vol.3604 P.253-262 google
  • 15. Liang M, Stehr R. L, Krause A. W (1997) “Confocal pattern period in multiple-aperture confocal imaging system withc oherent illumination” [Opt. Lett.] Vol.22 P.751-753 google cross ref
  • 16. Verveer P. J, Hanley Q. S, Verbeek P. W, van Vliet L. J, Jovin T. M (1998) “Theory of confocal fluorescence imaging in the programmable array microscopy (PAM)” [J. Microsc.] Vol.189 P.192-198 google cross ref
  • 17. Bansal V, Patel S, Saggau P 2003 “A high speed confocal laser-scanning microscope based on acousto-optic deflectors and a digital micromirror device” [in Proc. IEEE Conferenceon Engineering in Medicine and Biology] P.2124-2127 google
  • 18. Dudley D, Duncan W. M, Slaughter J (2003) “Emerging digital micromirror device (DMD) applications” [Proc. SPIE] Vol.4985 P.14-25 google
  • 19. Lee D (2010) “Optical system with 4 μm resolution for maskless lithography using digital micromirror device” [J. Opt. Soc.Korea] Vol.14 P.266-276 google cross ref
  • 20. Hanley Q. S, Verveer P. J, Gemkow M. J, Arndt-Jovin D, Jovin T. M (1999) “An optical sectioning programmable array microscope implemented with a digital micromirror device” [J. Microsc.] Vol.196 P.317-331 google cross ref
  • 21. Fukano T, Miyawaki A (2003) “Whole-field fluorescence microscope with digital micromirror device: imaging of biological samples” [Appl. Opt.] Vol.42 P.4119-4124 google cross ref
  • 22. Chamgoulov R, Lane P, MacAulay C (2004) “Optical computed-tomographic microscope for three-dimensional quantitative histology” [Cellular Oncol.] Vol.26 P.319-327 google
  • 23. Wu Y, Ye P, Mirza I. O, Arce G. R, Prather D. W (2010) “Experimental demonstration of an optical-sectioning compre-ssive sensing microscope (CSM)” [Opt. Express] Vol.18 P.24565-24578 google cross ref
  • 24. Schellenberg M, Peev E, Kloster M, Napier J, Neu W (2010) “Time-resolved 3D confocal fluorescence microscopy on living cells” [Proc. SPIE] Vol.7376 P.737612 google
  • 25. Neil M. A. A, Ju?kaitis R, Wilson T (1997) “Method of obtaining optical sectioning by using structured light in a conventional microscope” [Opt. Lett.] Vol.22 P.1905-1907 google cross ref
  • 26. Fainman Y, Botvinick E, Price J, Gough D (2001) “3-D quantitative imaging of the microvasculature with the Texas Instruments digital micromirror device” [Proc. SPIE] Vol.4457 P.137-144 google
OAK XML 통계
이미지 / 테이블
  • [ FIG. 1. ]  (a) Optical set-up of the DMD-ISFODS for imaging3D cell cultures. The DMD-ISFODS consists of amicroscopic arm a DMD module and a detection arm. (b)Scanning strategy of multiple pinhole apertures used inacquisitions of fluorescence images by DMD-ISFODS.
    (a) Optical set-up of the DMD-ISFODS for imaging3D cell cultures. The DMD-ISFODS consists of amicroscopic arm a DMD module and a detection arm. (b)Scanning strategy of multiple pinhole apertures used inacquisitions of fluorescence images by DMD-ISFODS.
  • [ FIG. 2. ]  FIG. 2. Flow chart of the image reconstruction and post-processing algorithm: In(x y): each sub-image acquired by DMD-ISFODS and N: number of measured sub-images.
    FIG. 2. Flow chart of the image reconstruction and post-processing algorithm: In(x y): each sub-image acquired by DMD-ISFODS and N: number of measured sub-images.
  • [ FIG. 3. ]  (a) Axial PSF: open symbols represent measured datawith Gaussian fits using different objectives (black □: 100xand NA = 0.90; red ○: 50x and NA = 0.50; blue △: 20x andNA = 0.40). The DOF was respectively measured to be ± 6.310.2 and 28.7 ㎛. (b) Measured 2D and 3D image of a for 3D image of a fluorescent bead.
    (a) Axial PSF: open symbols represent measured datawith Gaussian fits using different objectives (black □: 100xand NA = 0.90; red ○: 50x and NA = 0.50; blue △: 20x andNA = 0.40). The DOF was respectively measured to be ± 6.310.2 and 28.7 ㎛. (b) Measured 2D and 3D image of a for 3D image of a fluorescent bead.
  • [ FIG. 4. ]  (a) Image stacks measured by DMD-ISFODS. (b) DMD-ISFODS and (c) wide-field images of fluorescencemicrobeads embedded in 3D alginate matrix in z-sections. hrepresents the z-location from the bottom of the 3D matrix (d) image stacks of DMD-ISFODS when axial positions offluorescence microbeads are represented different colors.
    (a) Image stacks measured by DMD-ISFODS. (b) DMD-ISFODS and (c) wide-field images of fluorescencemicrobeads embedded in 3D alginate matrix in z-sections. hrepresents the z-location from the bottom of the 3D matrix (d) image stacks of DMD-ISFODS when axial positions offluorescence microbeads are represented different colors.
  • [ FIG. 5. ]  Fluorescence images of cells measured by (a) wide-field microscopy and (b) DMD-ISFODS.
    Fluorescence images of cells measured by (a) wide-field microscopy and (b) DMD-ISFODS.
(우)06579 서울시 서초구 반포대로 201(반포동)
Tel. 02-537-6389 | Fax. 02-590-0571 | 문의 : oak2014@korea.kr
Copyright(c) National Library of Korea. All rights reserved.