We present a display-based visual stimulator for psychophysical and electrophysiological visual sensitivity measurements. The stimulator offers various psychophysical visual stimuli and transfers the signals from external devices along with the stimulation signals to an electrophysiological recorder. As an experimental demonstration, we perform a visual sensitivity experiment in the mesopic vision range by using the display-based stimulator. The intensity of the steady-state visual evoked potential is observed to correlate with the luminance of the flickering visual stimulation. For the psychophysically determined detection thresholds, we determine the mesopic luminance, showing agreement with the perceived brightness within the uncertainty of the luminance measurement.
Understanding of human color vision has been greatly improved and then applied to the color-related technologies, since many different techniques used in the various fields, such as psychophysics, electrophysiology, retinal densitometry, and microspectrophotometry, have been introduced into color science [1]. Among them, psychophysical techniques have made the leading achievements; the color matching functions and the spectral luminous efficiency functions provide the measurement standards of color related quantities, and the color appearance models and the color-difference equations quantify and predict human color perception [2]. On the other hand, with the development of the recording instrumentation, electrophysiological techniques measuring the bio-electrical signals have attracted growing attention. They include electroretinogram, electrooculography, and visual evoked cortical testing techniques. The electrophysiological techniques are important in response detection, i.e., the detection of the various bio-signals from retina, eye, and brain allows the investigation of the visual process [3]. In particular, the electrophysiological time-resolved measurements are in strong demand for studying mesopic vision where both the rod and cone photoreceptors are active, since the rod and cone are different in response time [4].
The human color-vision system is so complicated that any specific technique cannot provide a complete description of human color vision. In addition, due to increasing technical progress, the lighting and display industries require deeper understanding of human vision under the various viewing environments. In the present study, therefore, we developed a display-based stimulator for the application of psychophysical and electrophysiological visual sensitivity measurements. The stimulator consists of software generating light stimulation and a display showing the visual stimulation. Since the visual stimulation generated by the software appears on a display, the display-based stimulator has the advanced features of easy-to-use and low-cost when compared with the visual stimulators consisted of several optical components. The stimulator provides various visual stimuli and environments. When compared with other display-based visual stimulators, the developed visual stimulator focuses on the stimuli for the visual color sensitivity measurement; it has a menu providing the psychophysical methods for the visual color sensitivity experiments. Also, the stimulator easily transfers the stimulation signals to electrophysiological recorders.
Next, the main functions and the demonstrations of the stimulator will be explained in the instrumentation section. In the experiment section, we will present a psychophysical and electrophysiological visual sensitivity experiment as an experimental demonstration of the developed visual stimulator. The experimental setup and method will be presented. Finally, we will discuss the results of the steady-state visual evoked potentials (SSVEPs) and the psychophysically determined detection thresholds.
II. INSTRUMENTATION: DISPLAY-BASED VISUAL STIMULATOR
We developed a display-based visual stimulator consisting of software and a display. The software has various algorithms of the psychophysical methods for visual sensitivity experiments. We easily adjust the characteristics of the visual stimulation, such as the color properties of hue, brightness, and saturation, and the temporal and spatial modulation properties.
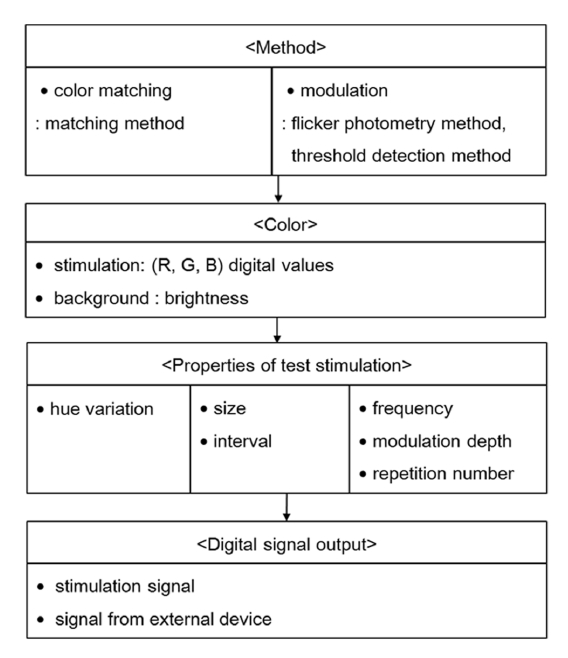
Figure 1 shows the main functions of the developed software. The software has four main panels, i.e., method, color, properties of test stimulation, and digital signal output,
wherein the individual properties of the stimulation are selected.
In the method panel, the psychophysical methods for the visual sensitivity experiments, which are largely divided into the flicker photometry method, the matching method, and the threshold detection method [5], can be selected. The matching menu offers the matching method, while the modulation menu provides the flicker photometry and the threshold detection method.
In the color panel, the color of stimulation and the brightness of background are selected. The color of stimulation is adjusted by selecting the (R, G, B) digital values of the display employed. The selected value is applied to the reference field in the matching method, while the value is used for the test field in the modulation-related methods. The fine and coarse adjustments of background brightness can be performed in the menus of the background brightness.
In the panel of the properties of test stimulation, the properties of test stimulation are set. The size and temporal interval between test stimuli are selected. The hue variation and the modulation properties (e.g., frequency, modulation depth, and repetition numbers) are controlled for the matching method and the modulation-related method, respectively.
In the digital signal output panel, the signals from external devices as well as the stimulation signals can be sent as input signals to an electrophysiological recorder. This function allows both the psychophysical and electrophysiological visual sensitivity measurements. For example, by combining the display-based visual stimulator with an electroencephalogram (EEG) recorder and a push-button device, we can simultaneously record the visual stimulation, EEG signals, and the psychophysically determined matches or thresholds. A psychophysical and electrophysiological visual sensitivity experiment will be presented in the section on the experiment.
Figures 2 and 3 show the visual stimulation realizing the psychophysical methods for visual sensitivity experiments. For a visual stimulator, a 17″ liquid crystal display (LCD) monitor with a cold cathode fluorescent lamp (CCFL) backlight was used. Figure 2 shows the screen shots of the
visual stimulation for the matching method. A circle is divided into two parts; a half circle in the left side is a reference field, and the other half circle is a test field. The color of the reference field does not change, while the color of a test field gradually changes in hue from yellow to sky-blue, red and green. This function is used for a color sensitivity experiment. That is, when a subject perceives the colors of both fields to be identical, the subject pushes a button to record the color property of the test field. We note that the spectral visual sensitivity measurements at short, middle, and long visible wavelength ranges are possible by using an LED-backlight lighting display with the quasimonochromatic RGB primaries.
The test field of the increment threshold method is given as a circle as shown in Figure 3. The red circle, as test stimulation, gradually varies in brightness. In a color sensitivity experiment, the test field is dark at the beginning so that a subject cannot distinguish the test field from the background. As the brightness of the test field increases, the subject begins to perceive the test field. The recording procedure is identical with the procedure of the matching method. The minimum radiance required by a subject to perceive the test field corresponds to the increment threshold for that color and for the given background.
The display-based visual stimulator can produce the visual stimulation of flicker photometry. In the flicker photometry method, the task given to a subject is to determine the minimum flicker for the temporarily altering test and reference fields. The procedures of recording and analysis are same with those of increment threshold method described above.
III. EXPERIMENT: VISUAL SENSITIVITY MEASUREMENT
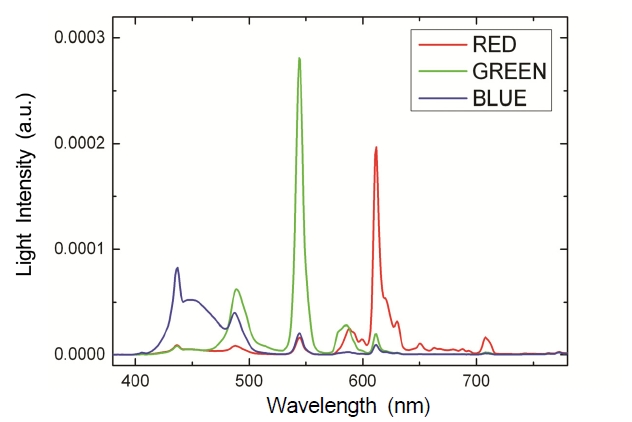
We used a 17″ LCD monitor with a CCFL backlight with a refresh rate of 16 Hz for a visual stimulator. The spectral power distributions of R, G, B primaries of the monitor are shown in Figure 4. For luminance calibration of the monitor, we used a CCD-based spectro-radiometer (Minolta, CS-1000). During the experiment, the spectroradiometer was also used in measuring the spectral power distributions of the monitor at the psychophysically determined detection thresholds. The luminance and spectral responsivities of the spectro-radiometer were calibrated traceable to the luminance scale of the Korea Research Institute of Standards and Science and the spectral irradiance scale of the National Institute of Science and Technology, respectively. The calibration procedure of the spectroradiometer is described in detail in ref. [6].
The calibration procedure of the monitor for luminance is as follows. First, we assigned the (R,G,B) digital values of the monitor from 0 to 255 with an interval of 25, i.e., (0,0,0), (25,0,0),… (255,0,0) for R, (0,0,0), (0,25,0),… (0,255,0) for G, and (0,0,0), (0,0,25)… (0,0,255) for B.
Second, at each level, we measured luminance by using the CCD-based spectro-radiometer, obtaining the relation between the (R,G,B) digital values and luminance for practical use in experiments.
For the electrophysiological and psychophysical measurements, we used an EEG recorder (Nuromedi, Poly G-A) and a push-button device. The push-button, generating TTL level signals, was interfaced to a digital input port of a USB digital input-output interface, of which the output port was connected to an external input port of the EEG device. Using software controlling both the EEG device and the visual stimulator, we simultaneously collected all the signals of the stimulation, EEG, and the push-button device.
The visual sensitivity experiment was performed for a 10° viewed test field at a background luminance of 0.2 cd/m2, corresponding to the mesopic vision range. The color of background was black with CIE 1931 (x,y) of (0.263,0.267). The test field was modulated with a rate of 16 Hz. The modulation rate and the viewing angle of the test field were selected to activate both the rod and cone photoreceptors. It was reported that high-frequency flickers above 20 Hz suppress the activities of the rods and cones [7]. In addition, both the rod- and cone-mediated vision is expected for the 10° test field, due to the different spatial distributions of the rods and cones. The 10° test field was a 10°-diameter circular field with a field eccentricity of 0°. For the test field, we adjusted the diameter of the test field as 87.5 mm and the distance between a subject and the visual stimulator as 500 mm.
For the measurement of the steady-state visual evoked potentials (SSVEPs), we used the red primary of the monitor, of which Commission Internationale de l’Eclairage (CIE) 1931 (x,y) chromaticity coordinates and luminance were measured as (0.584, 0.326) and 1.4 cd/m2, respectively. The flickering visual stimulation and the EEG signals of the subjects were simultaneously recorded for 200 s. Low frequency components (under 12 Hz) of EEG signals were filtered out for analysis.
For the measurement of the psychophysically determined detection thresholds, we used a detection threshold method which corresponded to a modified increment-threshold method [8]. The method is described as follows. First, a flickering circular target of a test field was superimposed on a background field as shown in Figure 3. In the experiment, we used a test field with a flickering frequency of 16 Hz. Second, the test field gradually varied in brightness. For the varying test field, the (R,G,B) digital values of the test field and the brain waves of a subject were simultaneously recorded. In the experiment, we recorded the signals for 600 s. Third, during the recording, the subject pushed a button when they perceived the test field. As a result, the psychophysically determined detection thresholds were recorded with the signals of stimulation and brain waves. After recording, we measured the luminance and the spectral power distributions of the test stimulation using the CCD spectroradiometer at the psychophysically determined detection thresholds. We repeated the procedure for the R, G, B primaries of the LCD monitor. The R,G, B targets varied from 0 to 50 with an interval of 1 in (R,G,B) digital values, that is, (0,0,0) ), (1,0,0),…(50,0,0) for R, (0,0,0), (0,1,0),… (0,50,0) for G, and (0,0,0), (0,0,1),…(0,0,50) for B. The resulting luminance ranged from 0.2 cd/m2 to 1.4 cd/m2 for R, 0.2 cd/m2 to 3.3 cd/m2 for G, and 0.2 cd/m2 to 0.5 cd/m2 for B, which corresponded to the upper mesopic vision range. At each level of (R,G,B) digital value, the stimulus was repeated 10 times. Accordingly, the period of the target variation was 10.2 s. The target variation was repeated for the recording time of 600 s.
Two normal trichromatic subjects (the authors; a female of age 25 and a male of age 43) participated in the experiment after 20 minute dark adaptation. Three electrodes of the EEG device were attached to the positions of Oz (active electrode), Cz (reference electrode), and Fpz (ground electrode). In attaching the electrodes to the subjects' heads, we referred to the International 10/20 system on visual evoked potential recording [9]. We will discuss the experimental results for a subject (a female with age of 25) in the section of results and discussion, since the results for both subjects are identical to each other within the experimental errors. We note that the work described here is for the verification of the visual stimulator and experimental method. We plan to perform the visual sensitivity experiments for the various subjects to obtain the experimental data representing the human visual sensitivity.
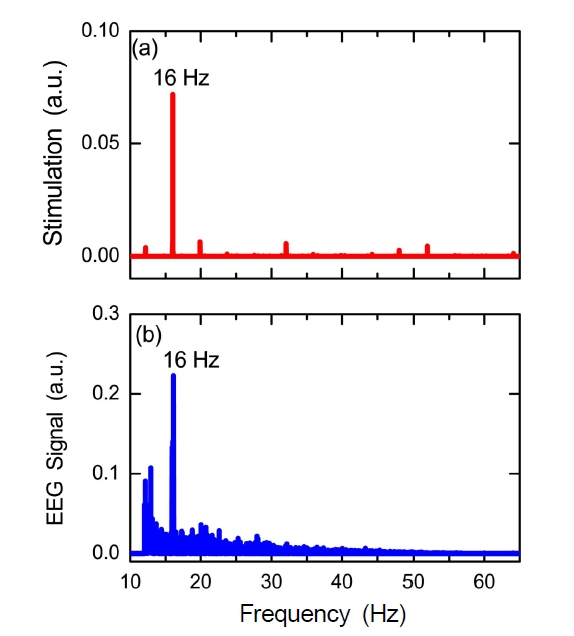
To evaluate the experimental setup, we first measured SSVEPs. SSVEP is defined as a visual evoked potential synchronized to flickering vision stimulation [10]. We observed SSVEPs as shown in Figure 5. Figure 5(a) and (b) correspond to the fast Fourier transform (FFT) spectra of the
visual stimuli and the brain waves, respectively. The brain wave-versus-frequency plot has a large peak at 16 Hz, corresponding to the frequency of the flickering stimulation. We note that the beating between the flicker frequency and the monitor refresh rate was not observed.
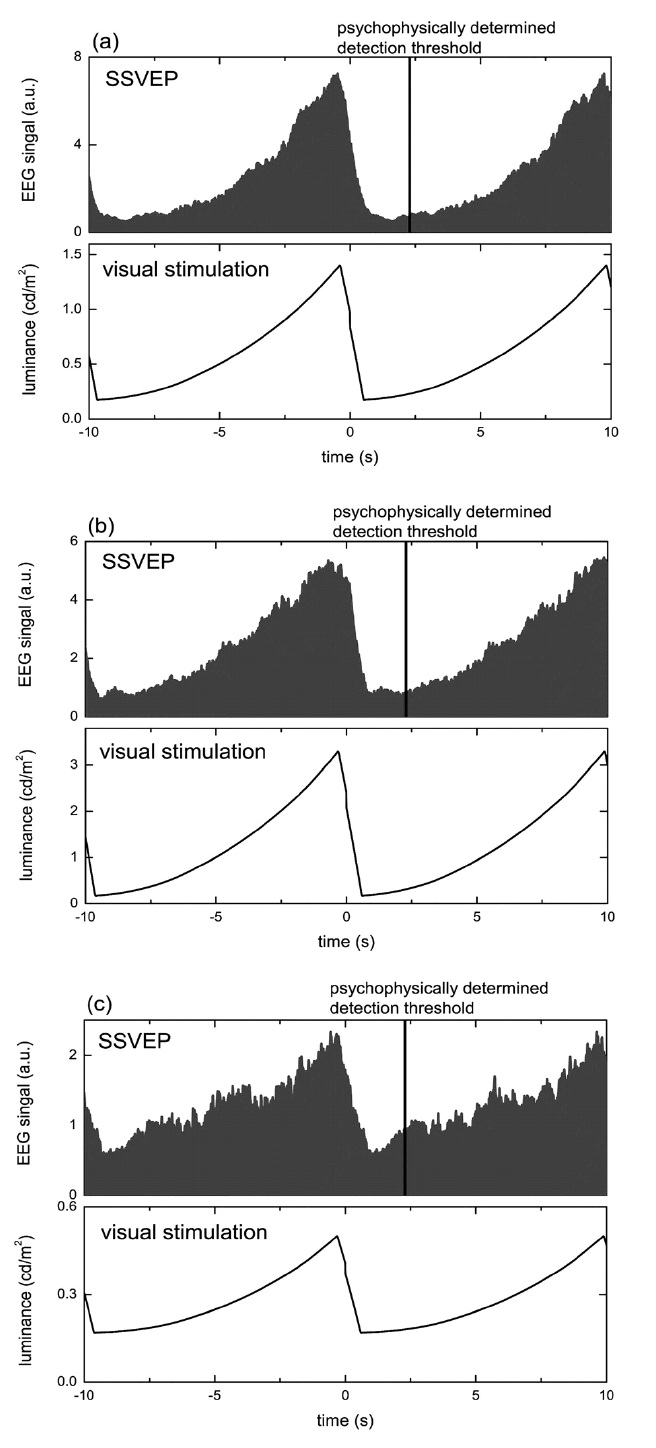
Next, we performed a visual sensitivity experiment. In Figure 6, we plotted the intensity changes of SSVEPs (top figure of each pair) with the luminance changes of the visual stimuli (bottom figure of each pair). The results were obtained through ensemble averaging of 58. For all the R, G, B stimulation, we determined the correlation coefficients between the SSVEP intensity and the test-stimulation luminance above 0.9.
The psychophysically determined detection thresholds are marked with vertical lines in Figure 6 (top figure of each pair). We confirmed that the psychophysically determined detection thresholds corresponded to the minimum EEG signals, which is consistent with the previously reported result [11]. At the thresholds, we measured the spectral power distributions and photopic luminance of the test stimuli using the CCD-based spectro-radiometer. With these measured values, we calculated mesopic luminance
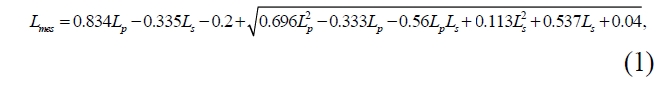
where
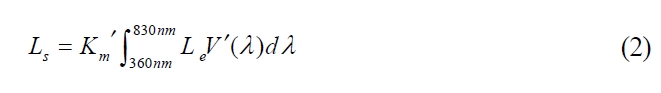
To obtain scotopic luminance, we used the following equations
that express the relation between scotopic luminance
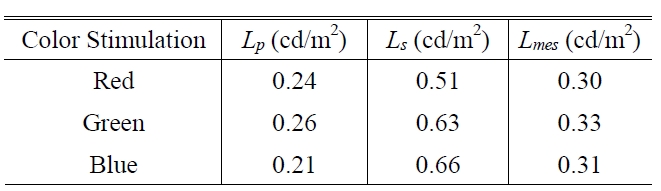
Photopic, scotopic, and mesopic luminance, Lp, Ls, and, Lmes, at the psychophysically determined detection thresholds.
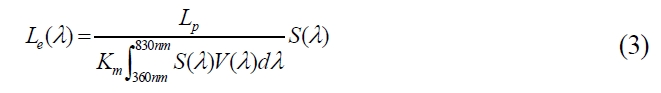
Here,
Table 1 shows the results of luminance at the psychophysically determined thresholds for the R, G, B test stimulation. The thresholds are interpreted to be equal in brightness, since we performed the experiment under the fixed background. On the other hand, when considering the measurement uncertainty in luminance with a CCD-based spectroradiometer for a LCD with a CCFL backlight that ranges from 5% to 9% (
We examined the possible effect of the flickering stimulation for the measurement results. It was reported that the repeated stimulation may change the adaptive state of the eyes [15]. However, through the repeated SSVEP measurements for 600 s, we observed negligible temporal variation in the SSVEPs for the test stimuli with identical luminance. Also, for each R, G, B stimulation, the psychophysically determined thresholds showed no temporal variation. Even though we cannot rule out the possibility of the adaption change, the observation concluded that, in this experiment, the luminance change predominates over the possible effects of the adaption change.
In summary, we developed a display-based visual stimulator for psychophysical and electrophysiological visual sensitivity measurements. The visual stimulator was calibrated with a CCD-based spectro-radiometer, of which the luminance and the spectral power distributions were traceable to the luminance scale of the Korea Research Institute of Standards and Science and the spectral irradiance scale of the National Institute of Science and Technology, respectively.
As an experimental demonstration, we measured visual sensitivity in the mesopic vision range, obtaining the correlation coefficients between the SSVEP intensity and the stimulation luminance above 0.9. We determined the mesopic luminance at the psychophysically determined detection threshold, resulting in agreement with the perceived brightness within an uncertainty of luminance measurement.
With its advantage of easy control in generating various stimuli and transferring signals, the display-based visual stimulator described here has wide potential application in the psychophysical and electrophysiological vision research. In particular, we expect that the visual stimulator combined with bio-signal detection technology will be useful in studying mesopic vision where both rods and cones operate. We plan to perform electrophysiological and psychophysical time-resolved measurements for human visual sensitivity by utilizing the display-based stimulator to investigate how rods and cones influence the mesopic vision.