The Fourier modal method (FMM) is one of the most popular numerical electromagnetic analysis methods for periodic optical structures [1]. With recent developments of the initial theoretical framework, such as perfect matched layer (PML) [2, 3] and the generalized scattering-matrix method [4, 5], the range of applications of the FMM was extended to include aperiodic, anisotropic device structures and more generalized photonic network structures [5]. Furthermore, with the performance improvement of modern computers, the FMM has become a crucial tool in the development of various optical and optoelectronic devices, such as anti-reflection coatings [6], broadband reflectors [7,8], narrowband bandpass filters [8], solar cells [9], waveguides [2, 10], and optomechanical devices [11].
Perhaps the most important development in the history of the FMM is Li’s Fourier factorization rule for improving the convergence of the FMM in analyzing metallic gratings under transverse-magnetic (TM) polarization [12-14]. Since the FMM with Li’s factorization rule shows good convergence in analyzing such structures, it has become one of the most important analysis tools in the field of plasmonics [15, 16]. However, through FMM analyses of metallic structures under surface plasmon resonance (SPR), we have found that the coefficients of transmission and reflection have peculiar small fluctuations when plotted versus the number of Fourier terms used, even though the FMM has a large number of Fourier terms and is featured with Li’s factorization rule.
This motivates the investigation of the origins of the fluctuations observed in the FMM analysis of a one-dimensional lamellar metallic grating with discontinuities in the permittivity profile. An in-depth discussion on the internal modal structure of the FMM and the Gibbs phenomenon arising in the Fourier representation of discontinuous metallic structures is presented. To systematically study this problem, we modify the conventional formulation of the FMM to control the number of Fourier harmonics representing the fields independently of that of Fourier terms associated with the permittivity profile, and examine the respective effects of the numbers of the field and structure harmonics on the convergence behavior of the FMM. Based on the analysis, we discuss the origins of the fluctuations in the convergence of the FMM, and conclude with perspective and a future plan for enhancing the accuracy of the FMM.
This paper is organized as follows. In Sec. 2, the numerical framework of the FMM is reviewed. In Sec. 3, the main problem of interest is stated with an example of the FMM analysis. The reason for the problem is explained within the conventional FMM framework by discussing the Gibbs phenomenon and its physical relation to fluctuations. In Sec. 4, we modify the conventional FMM by de-coupling the linkage between the numbers of the field and structure harmonics, examine the resulting convergence behaviors of reflection and transmission efficiencies of a metallic grating, and clarify the origins of the fluctuations, followed by concluding remarks in Sec. 5.
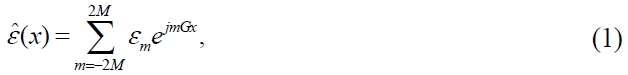
Before investigating the convergence behaviors of the FMM for electromagnetic simulations of a metallic grating structure, we briefly review the numerical framework of the FMM [1]. For a one-dimensional grating structure investigated in the following sections (Fig. 1), the permittivity in the grating layer, ε(x), is approximated by a truncated Fourier series,
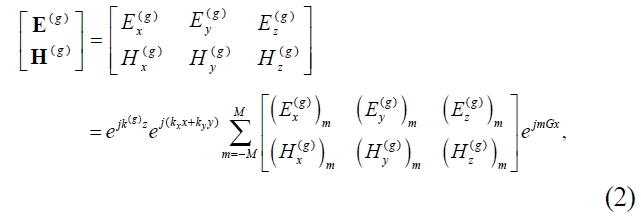
where G=2/Λ, and Λ is the grating period. In the FMM, the internal electric and magnetic eigenmodes, E(g) and H(g), in the grating structure take the form of a truncated pseudo-Fourier series:
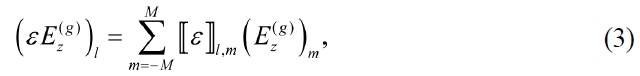
where ejk(g)z is the Bloch eigen-phase term, (Ex(g))m, (Ey(g))m, (Ez(g))m and (Hx(g))m, (Hy(g))m, (Hz(g))m are the Fourier coefficients of the electric and magnetic field envelope functions, respectively, and kx and ky are determined by the wave vector of the incident plane wave. The Fourier coefficients and Bloch eigen-phase terms are calculated by substituting Eqs. (1) and (2) into Maxwell’s equations and solving the resulting algebraic eigenvalue equation [1]. In doing so for TM-polarized (magnetic field parallel to the y-axis) waves, the Fourier coefficients of the axial (z-directional) electric displacement vector, ε(x)Ez(g), are given by the Laurent’s rule:
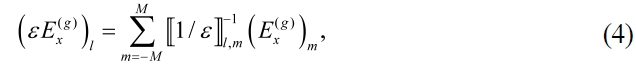
where?ε?l,m are the (l, m) matrix element of the Toeplitz matrix?ε? generated from the Fourier coefficients of ε(x), εm. The Fourier coefficients of the transversal (x-directional) electric displacement vector, ε(x)Ex (g), are obtained in a different fashion, known as Li’s rule [12, 13]:
where
are the (l, m) matrix elements of the inverse of the Toeplitz matrix generated from the Fourier coefficients of 1/ε(x). Li’s factorization rules are critical for fast convergence of the FMM for the case of metallic gratings under TM illumination [13]. In the case of transverse-electric (TE, electric field parallel to the y-axis) waves, the Fourier coefficients of ε(x)Ey(g) are obtained as in Eq. (3).
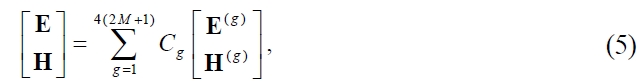
In the conventional formulation of the FMM, the 4(2M+1) internal Bloch eigenmodes are obtained numerically, and the total electromagnetic field inside the grating structure is described by the coherent superposition of 4(2M+1) internal Bloch eigenmodes as
where Cg is the coupling coefficient that represents the degree of coupling between the external excitation and the gth internal electromagnetic Bloch eigenmode, and is matched by electromagnetic boundary conditions.
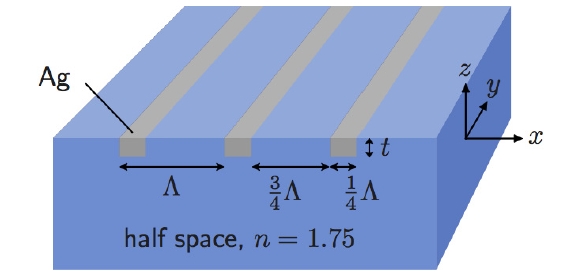
A grating structure that we analyze to examine the convergence behaviors of the FMM is illustrated in Fig. 1. An optical plane wave from the free-space region is
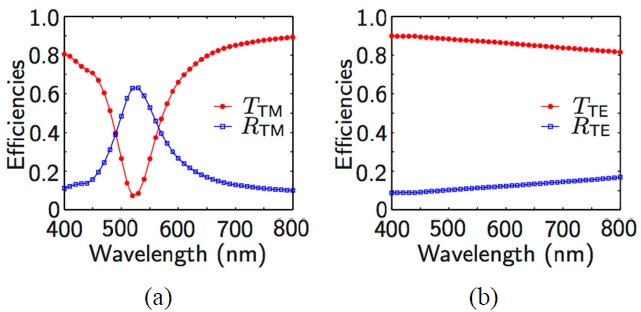
incident normal to the xy plane on a substrate with an index of refraction (n) of 1.75, occupying the lower half space, in which a Ag periodic binary grating, with a period (Λ) of 250 nm, a fill-factor of 0.25, and a thickness of 20 nm, is embedded. Figure 2(a) shows the spectra of external transmission and reflection efficiencies (TTM and RTM), calculated using the FMM, for a TM-polarized incident plane wave, whose wavelength λ is varied from 400 nm to 800 nm. The results calculated for a TE-polarized plane wave (TTE and RTE) are shown in Fig. 2(b). The calculations were performed with M= 500, and the complex permittivity of Ag is taken from the literature [17].
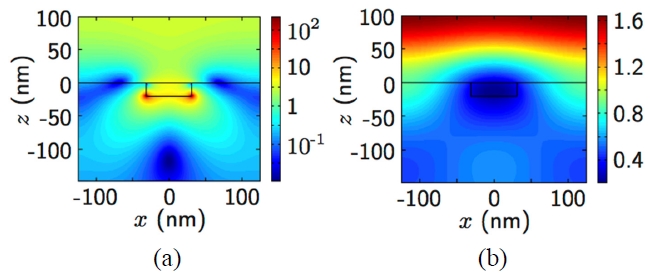
The RTM spectrum has the main peak at λ =520 nm and a small shoulder at λ =420 nm, both of which are attributed to SPRs. In contrast, the TTE and RTE spectra are nearly featureless [Fig. 2(b)]. In Figs. 3(a) and 3(b), the TM and TE electric field intensity profiles for λ =520 nm are shown, respectively. For TM polarization, the electric field is tightly concentrated on the sidewalls and the bottom surface of the grating due to SPRs. In contrast, the field enhancements near the grating boundaries are not observed for the case of TE polarization, as shown in Fig. 3(b).
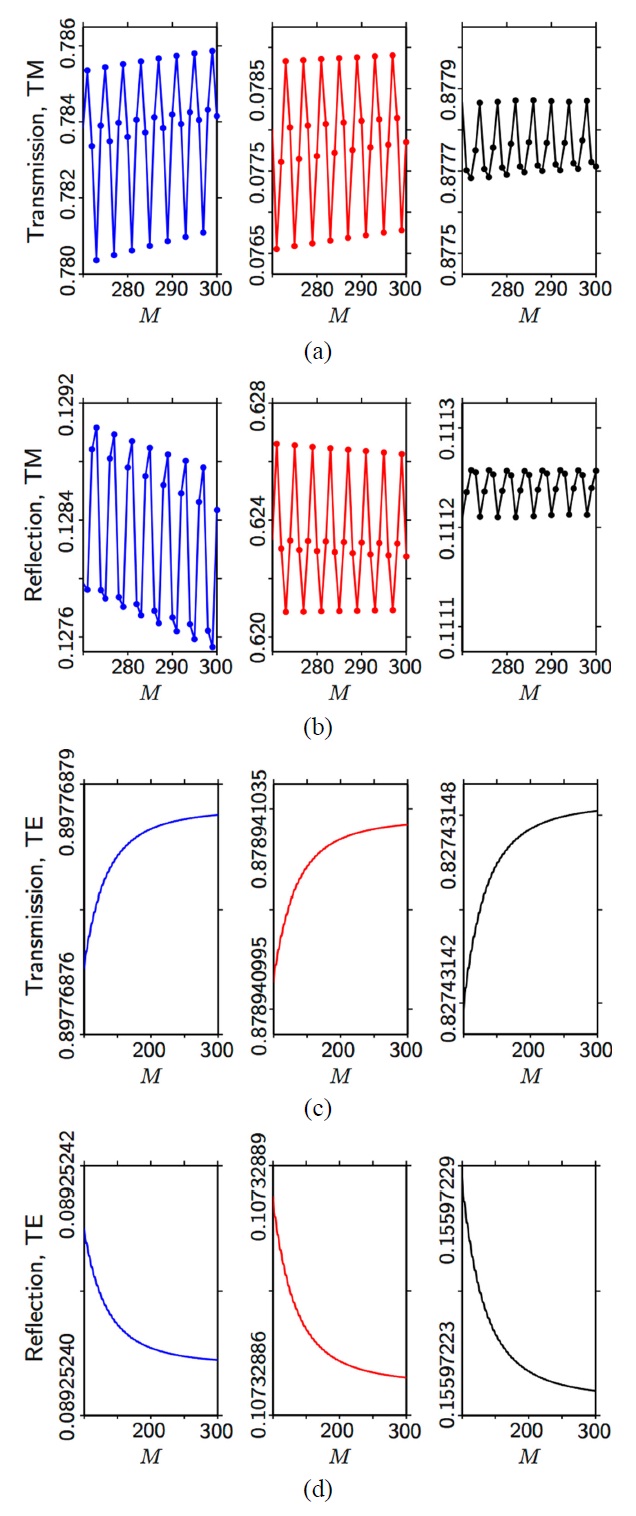
Next, we investigate the convergence characteristics of the FMM calculation. In Fig. 4, TTM [(a)], RTM [(b)], TTE [(c)], and RTE [(d)] are plotted as a function of M for the three selected wavelengths, 420 nm (blue), 520 nm (red), and 750 nm (black). For the TM case, the results for all three wavelengths seem to be converged for sufficiently large M (>100) but close examinations reveal that they
have fluctuations, as shown in Figs. 4(a) and 4(b). In contrast, the results for the TE cases converge much faster, and their variations in M > 100 are negligible [Figs. 4(c) and 4(d)].
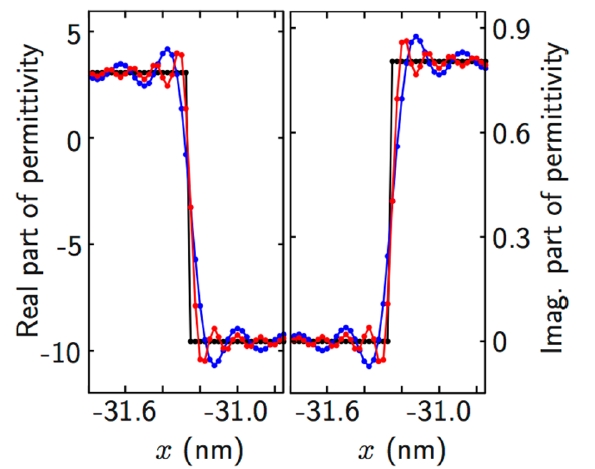
Considering the field profiles shown in Fig. 3, the contrast in convergence characteristics between the TM and TE cases suggests that the fluctuations in TTM and RTM are related to the inherent inaccuracies in the Fourier-series approximation of the permittivity profile near the grating boundaries. Figure 5 shows the exact permittivity profile in the grating layer (black), ε(x), compared with its Fourier-series approximation,
calculated at λ =520 nm by Eq. (1) for M= 500 (blue) and 1000 (red). The
profiles have oscillations near the grating boundary, and in each (metal or dielectric) region, the oscillation occurring nearest to the grating boundary has the largest magnitude ? the characteristic of the Fourier-series representation of a piecewise continuous function with jump discontinuities, known as the Gibbs phenomenon [18]. This observation provides a qualitative and physical explanation that the fluctuations in TTM and RTM are, at least in part, ascribed to non-negligible responses of edge-concentrated electromagnetic fields to the fluctuation in
near discontinuous grating boundaries due to the Gibbs phenomenon. Consequently, TTM and RTM show the fluctuations even with M= 270 and the correct Fourier factorization rules, as shown in Figs. 4(a) and 4(b). Meanwhile, the Gibbs phenomenon does not result in fluctuations in TTE and RTE, since the extent of regions near the grating boundaries where
and ε(x) differ is very small compared with Λ (= 250 nm), and the field concentration near the grating boundaries does not occur for TE-polarized illumination [Fig. 3(b)].
We examine the numerical framework of the FMM and focus on its internal modal structure to identify the origin of the fluctuations in TTM and RTM. In the conventional FMM framework, 4(2M+1) Bloch eigenmodes are numerically obtained with (2M+1) field harmonics, where the coupling between field harmonics is specified by (4M+1) εm’s [1]. Here, it is noted that the number of structure harmonics in Eq. (1) (= 4M+ 1) and that of field harmonics in Eq. (2) are linked and varied together.
Upon increasing M in the FMM framework, many highly evanescent Bloch eigenmodes are generated, and the degree of evanescence of each mode can be evaluated by the magnitude of the imaginary part of the Bloch eigenvalue kz(g) [1]. By examining the convergence of kz(g)’s with respect to M, we find that for given M, the calculated 4(2M+ 1) internal Bloch eigenmodes can be categorized into (i) lower-order non-evanescent or weakly evanescent Bloch modes that are converged, in a sense that their eigenvalues and field profiles are identical to those obtained with smaller M’s, and (ii) a few highly evanescent modes that are not converged yet. The coupling coefficients, in expressing the total field profile as in Eq. (5), of the internal Bloch eigenmodes in categories (i) and (ii) are denoted by Cg(i)’s, and Cg(ii)’s, respectively.
The convergence of the eigenmodes in category (i) means that kz(g)’s and the corresponding field profiles of these eigenmodes are not affected by the oscillating change in

near the grating edges as M is further increased. Meanwhile, for the eigenmodes in category (ii) to be converged, more higher-order Fourier terms need to be included by increasing M. Then, the values of kz(g) for newly generated higher-order terms are different from their converged values; in other words, for any M, there are always eigenmodes belonging to category (ii). This finding strongly suggests that the fluctuations in TTM and RTM are mainly ascribed to the Bloch eigenmodes in category (ii). More specifically, for TM-polarized illumination, Cg(ii)’s are not negligible. In viewpoint of the numerical framework, the internal mismatch between the number of field harmonics used (= 2M+ 1) and that required to accurately represent all 4(2M+ 1) Bloch eigenmodes causes parameters, such as TTM and RTM, to exhibit fluctuations. In contrast, Cg(ii)’s in the case of TE polarization are negligible, meaning that the unconverged evanescent modes do not contribute to the total field distribution. Consequently, TTE and RTE converge without fluctuating features despite the harmonic number mismatch.
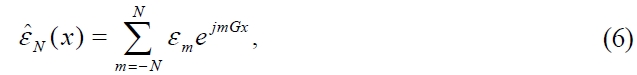
To address this issue more clearly, we perform numerical experiments by modifying the conventional FMM framework, where the number of structure harmonics (= 4M+ 1) representing ε(x) is directly linked to that of field harmonics (= 2M+ 1) as seen in Eqs. (1) and (2), to de-couple these two numbers. Specifically, ε(x) is approximated by
and the electromagnetic fields are given by Eq. (2), where M and N can be independently varied. If M is increased sufficiently beyond the value in the conventional FMM (= N / 2) for fixed N, we expect that the evanescent Bloch eigenmodes with non-negligible coupling coefficients will be converged, and consequently the TTM- and RTM-vs.-M plots are expected to converge without fluctuations. This procedure may be considered as band-limiting
However, we emphasize that it is a means to provide a sufficient number of field harmonics required to accurately represent Bloch eigenmodes involved in diffraction by the approximate grating profile
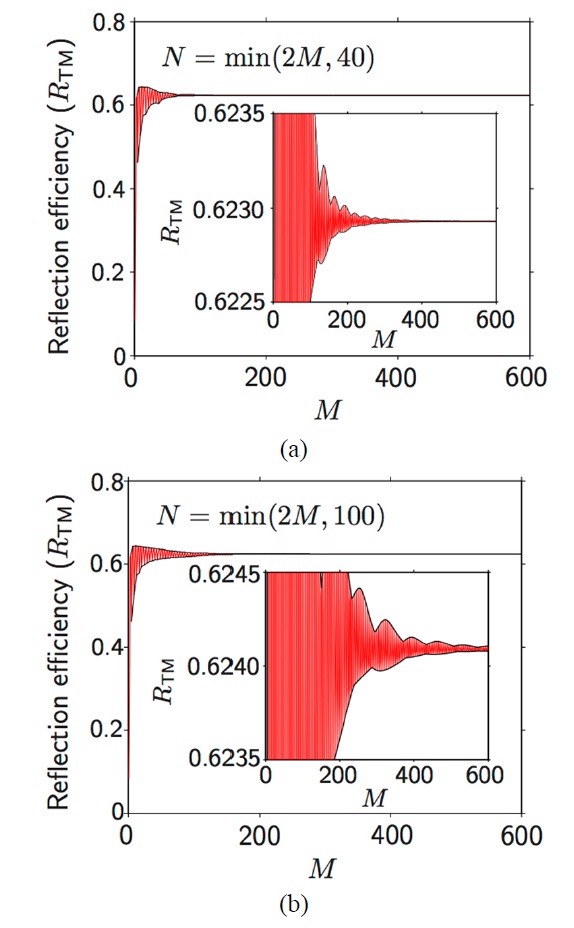
To show this, we plot RTM of the one-dimensional grating analyzed in Sec. 3 under SPR (λ = 520 nm) as a function of M with N equal to its value in the convenional FMM (= 2M) only until a certain value (Fig. 6). Figure 6(a) shows the result when the maximum N (≡Nmax) is 40, showing that quick convergence of RTM is obtained with significantly reduced fluctuations, as evident in the inset. This indicates that if M > ~300, kz(g) and the corresponding field profiles of Bloch eigenmodes with non-negligible coupling with the incident wave are completely converged, and this band-limited
does not couple the incident
wave with the highly evanescent eigenmodes that are not converged yet. Figure 6(b) shows the result for Nmax = 100, where the height of the envelope within which RTM oscillates becomes larger. We also note that the values of RTM in Figs. 6(a) and 6(b) converge to different values, since the permittivity profile is slightly different, near the grating boundaries in particular, in each simulation.
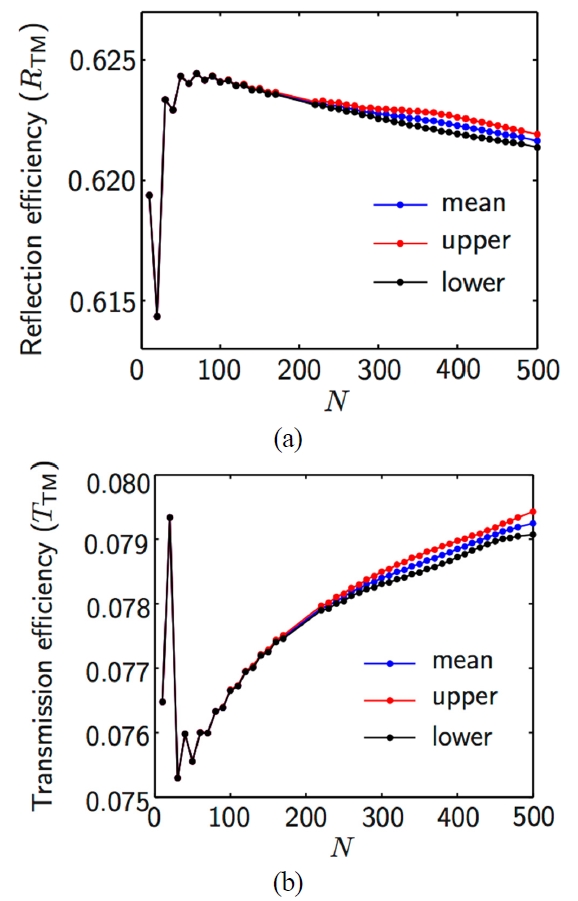
These results indicate that calculations of RTM and TTM as a function of N for sufficiently large M are free from errors due to unconverged kz(g) of highly evanescent modes, therefore demonstrating fluctuations attributed to the Gibbs phenomenon only. To confirm this, we plot, in Fig. 7, RTM and TTM of the grating under the same illumination condition as in Fig. 6, as functions of N for M?600: for each N, envelopes outlining oscillations in RTM- and TTM-vs.-M plot, such as those shown in Fig. 6, are calculated, and the values of the upper and lower envelopes at M= 600 are marked as red and black dots in Fig. 7. Also shown is the mean of the upper and lower envelopes at M= 600, marked as blue dots. For N < ~200, the upper and lower envelopes of both RTM and TTM are indistinguishable, meaning that they are converged with respect to M for each

This indicates that M (= 600) is sufficiently large to accurately evaluate kz(g) of Bloch eigenmodes whose coupling to the incident plane wave is non-negligible for
with N < ~200, and that the very small fluctuations for N < ~200 are due to variation in
However, as N is increased beyond ~200, the number of field harmonics (= 2M+1?1200) becomes insufficient, resulting in separation between the upper and lower envelopes. This means that both types of errors ? one in representing true ε(x) and the other in evaluating kz(g) of highly evanescent Bloch eigenmodes with non-negligible coupling coefficients ? contribute to the fluctuations. The magnitude of fluctuations at each N in Fig. 7, i.e., the difference between the upper and the lower envelopes, is much smaller than that of fluctuations around M= N/2 in Fig. 4, which indicates that the errors arising from coupling with unconverged higher order evanescent eigenmodes are reduced in the modified FMM. Although the values of M in our simulations are limited, we infer that if N approaches to infinity while keeping M ≫ N/2, the modified FMM will converge with negligible, or much smaller, fluctuations compared to the expected asymptotic behavior of the conventional FMM.
We have unveiled that two types of errors are present in the FMM analysis of a one-dimensional metallic gratings: one in representing true ε(x) by a Fourier series with a finite number of Fourier terms, which is related to the Gibbs phenomenon, and the other in evaluating field profiles of highly evanescent Bloch eigenmodes. We have found that the number of field harmonics in the FMM framework, 2M+ 1, is always insufficient to accurately represent a few most highly evanescent eigenmodes, and it is an inherent structural limitation of the conventional FMM framework with Li’s Fourier factorization rule. We have shown that the fluctuations arising from inaccurate calculations of these eigenmodes can be eliminated in the modified FMM, by increasing M sufficiently beyond the value in the conventional FMM (= N / 2)
Due to highly concentrated fields near the grating boundaries, TM-polarized cases are sensitive to this inaccuracy, resulting in fluctuations in RTM and TTM even with large M. We expect that fluctuations similar to what is observed here to be present in dealing with general metallic structures supporting SPRs, whenever the electric fields are highly concentrated in metal around its discontinuous boundaries. Moreover, in analyzing the electric field enhancement in a deep-subwavelength structure, for example, a metallic slit whose width is significantly smaller than the wavelength of interest [19], the coupling between the excitation field and very-high-order evanescent eigenmodes must be considered. Since the errors investigated in this paper are the inherent characteristics of the conventional FMM, its application to deep-subwavelength structures can be inaccurate. To obtain accurate results in such cases using the FMM with finite computing resources, the method of representing permittivity profiles may need to be modified. A good strategy may be a form of truncated Fourier series with a specific apodization in the spatial-frequency domain. This topic will be studied based on what is established in this paper.