We measured small optical beam deflection in an image rotating Sagnac interferometer. We used a weak value measurement scheme that involves a pre-selection, weak perturbation, and a post-selection procedure to obtain the amplified value of beam deflection. The amplification factor of the measured beam deflection varied from 11 to 63 depending on the settings of the post-selection polarizer in front of the photodetector and the settings of polarization compensator in the interferometer.
Optical techniques often provide us ultrasensitive measurement tools for detecting a small change in a physical system. The measurement of an optical beam displacement due to a small change in a physical system can reach nano-scale sensitivity nowadays and the limit of the measurement sensitivity in standard techniques has been studied in relation to shot noise [1]. Weak value was introduced in 1988 by Aharonov et al. [2]. They claimed that a measurement of the spin component of a spin 1/2 particle can yield the value 100, which is far outside the range of spin eigenvalues. Standard measurement of the spin cannot yield such a value. By analyzing the von Neumann model of standard measurements in quantum physics, Aharonov et al. found that one can obtain the amplified value of a physical observable by using a technique that involves the pre-selection of initial quantum state, weak interaction of the system with a meter, and the post-selection of a final quantum state. In the following year, a paper by Duck et al. presented a detailed analysis of the weak value in a more realistic form [3]. An optical experiment to prove the validity of the weak value theory was reported shortly after [4]. Several interesting studies followed afterwards. A theoretical study showed that the weak values are natural values that one can measure in open systems [5]. Several experiments were reported; the weak value measurement of single photon polarization [6], the observation of spin Hall effect of light [7], an ultrasensitive beam deflection measurement [8-10], the measurement of small longitudinal phase shift [11], and a precision frequency measurement with weak values [12]. Weak value measurement can be applied to many optical systems in general [13]. The weak value measurement with realistic incoherent measuring devices has been considered recently [14].
An interesting fact is that most of the previous experiments have used strong laser and photodiodes so that the experiments seemed to be classical. There has been an attempt to explain the result of weak value measurement results by a classical interference [11]. However, the quantum weak value theory seems to give the most general and consistent result for the several different experiments in the references 6-12, while the classical theory is somewhat phenomenological and specific to the particular set-up. Therefore, the classicality of the measurement is under debate. The quantum nature of weak value measurement has to be examined in many more different situations.
We investigated experimentally the weak value measurement of beam deflection in an image rotating Sagnac interferometer. Our set-up has evolved from the one-dimensional beam deflection measurement with a Sagnac interferometer [8-10]. In our Sagnac interferometer set-up, optical image rotation in the transverse plane occurs during the beam propagation, which results in beam displacements in two-dimensional plane, instead of in one-dimension. Moreover, we have found that a small rotation of the Dove prism in our set up can make a two dimensional beam shift as well. This opens the possibility of measuring the amount of image rotation by using the weak value measurement method.
We varied several parameters in experimental set up to find the valid region for weak value measurement and then measured the amplification factor for the beam deflection. Our result shows large amplification of the beam displacement and a couple of typical characteristics of the weak value measurement.
The weak value measurement is typically performed in the following three steps [2-3]: (1) pre-selection of an initial quantum state; (2) a weak interaction of a system and a meter; and (3) post-selection of a final state that is nearly orthogonal to the initial state. The weak value of a physical observable, represented by an operator

is defines as
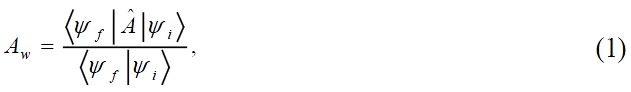
where
are the pre-selected initial state and the post-selected final state, respectively. If we change the final state to be the same as the initial state, i.e.,
then the weak value becomes
where A represents the usual standard measurement result. However, when we choose the final state to be nearly orthogonal to the initial state such that

then the weak value can become much larger than the standard measurement value, i.e.,
The post-selection of the final state is closely related to the von Neumann model of system-meter interaction, where the interaction Hamiltonian is given as

where

is a canonical variable of a measuring device with conjugate momentum

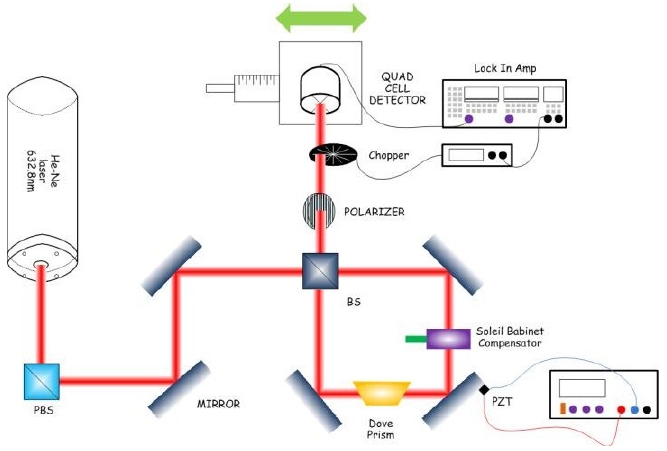
The interaction changes the state of the meter, yielding eigenvalue-dependent shift of the meter’s wave function. In our case, the shift happens in a momentum space. Our set up is shown in fig. 1, which is analogous to the one-dimensional scheme used by Dixen et al. [8], but we are going to generalize the theory to two-dimension.
In the Sagnac interferometer, the beam travels either by the clockwise direction or by the counter-clockwise direction, denoted by the basis states
respectively. The operator for the measurement is

In the case of one-dimensional case [8], the quantum state of the system and the meter in interaction picture was represented as

where
Now,

is given by Eq. (4), and the optical image rotation depends on the direction of propagation, say, +90° - δ for
Here,
Let us suppose that the beam profile or the image is a smooth and slowly varying function, for instance, a Gaussian. Then, because we are measuring the result of interference of two overlapping beams at the output port, the effect of very small rotations of two beams can be represented by an overall phase shift in interfering beams. If we further assume that the beam profile is symmetric, then we can also assume that the overall phase shift is +
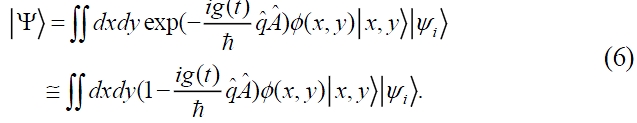
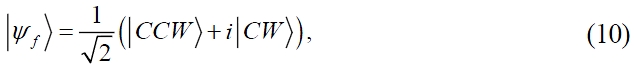
In this simplified case, we can make use of the interaction picture and set the initial state as
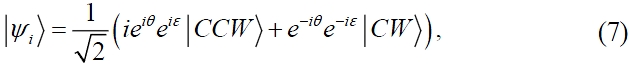
where the phase shift
By choosing an output state

the projection to the state

would yield
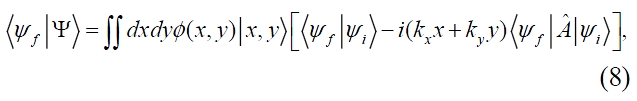
where we have used
Assuming that the final state satisfies the conditions in Eq. (2), we now obtain

which is the usual expression for the weak value measurement. The beam is deflected by the small perturbation caused by a tilt of a mirror in the interferometer and the rotation of the Dove prism, and the beam shift is proportional to
The weak value

For the case of tilting the PZT driven mirror in fig. 1, without changing the Dove prism angle, the amount of beam shift in the measurement plane is proportional to 2k
The experimental set-up is shown in Fig. 1. We used a HeNe laser with 632.8 nm wavelength. A polarizing beam splitter was used to set the polarization to be vertical. The laser beam enters the Sagnac interferometer that is made of one non-polarizing beam splitter, three mirrors, a Dove prism that is mounted with 45° rotation, and a Soleil Babinet compensator (SBC). At first, the interferometer was carefully aligned to give a bright fringe at the output port. Due to the phase shift related to the rotation by the Dove prism (CVI DP-050-C-450-694-ENDS), the light polarization becomes elliptical [15,16]. The SBC (Special Optics 8-400-IR-25- unct) is set to compensate the polarization change so that the output beam has the same linear polarization as the input beam polarization. Then we changed the polarizer angle at the output port by 90° + 2° to make a post-selection. By applying a voltage to the PZT actuator (Piezomechanik PCh 50/5*5/2), we could make the momentum shift
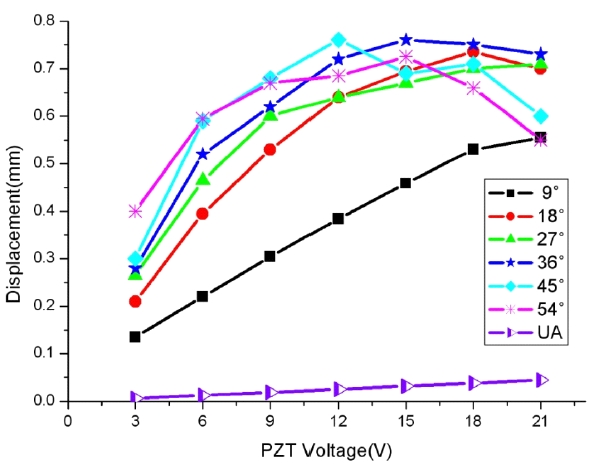
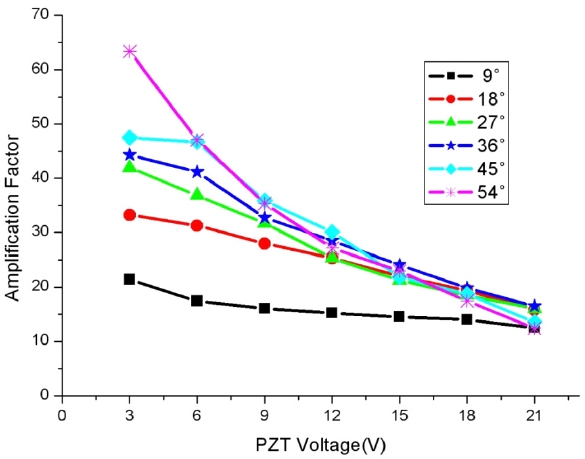
The curve marked as UA shows the value of beam shift, which is given by classical ray optics theory. We call it an unamplified value, and it is calculated as follows; in fig 1, the PZT actuator is pushing the edge of the mirror mount, and the distance from the rotation axis of the mirror mount to the PZT is 0.038 m. According to the calibration we had with the Michelson interferometer, an applied voltage of 3 V makes a 240 nm length change of PZT, and that would make a 6.32 μm beam shift at a detector plane which is 1 m away from the PZT driven mirror mount. For most of the data set, the amplification of the beam shift seems to get saturated for large mirror tilt angles. This is expected from the weak value measurement theory, because the approximation we used for the weak value does not hold in the case of large variation of the physical system. The experimental data shows large amplifications of the beam shift, which is plotted in fig. 3. The amplification factor varies from 11 to 63 depending on the setting of the SBC and the mirror tilt amount, and the largest amplification occurs at the small value of mirror tilt (small system variation), as expected from the weak value theory.
We have successfully measured the beam shift by using the weak value measurement technique. The experimental result showed that larger amplification of the beam shift is obtained for lower (weak) variation of the physical system, and also showed that the amplification factor decreases for larger variation of the system. These two phenomena are typical characteristics of weak value measurements.
The classical theory of ray optics gives the value of unamplified shift in fig. 2. Our experimental result agrees with the weak value theory well. It may be possible to develop a classical physical optics theory including the effect of interference in the future, but it is beyond the scope of this paper.
We could obtain even larger amplification for smaller values of mirror tilt, with amplification factor more than 80, but the experimental data was not consistent enough to report. The inconsistency seems to originate from the poor operation characteristics of the detector and the data acquisition circuit at low light level. In our experiment, the measurement of beam deflection is currently down to a few