Lithium ion batteries are widely used in mobile phones, notebook computers, electronic equipment, electric vehicles and other applications. The cathode material plays a decisive role in determining the capacity and life time of the battery. Among cathode materials of lithium ion batteries, LiFePO4 with olivine structure has attracted extensive attention due to a high theoretical specific capacity (~170 mAh/g), environmental friendliness, excellent thermal stability, and low cost. However, its weakness in diffusion limitation and poor electrical conductivity lead to poor electrochemical performance and makes it difficult to be used as a cathode material for commercial lithium ion batteries [1].
In recent years, many researchers have improved the electrochemical performance by coating with carbon [2-4] or preparing suitable procedures to minimize the particle size of the material [5-8], or doping supervalent metal ions to Li sites [9] or Fe sites [10,11]. As an active additive, graphite nanofiber (GNF) can be added to LiFePO4 cathode material. As a carbon source, it can possibly improve the electrochemical characteristics of LiFePO4 through increasing the electronic conductivity [12,13]. Furthermore, various synthesis methods have been developed to prepare LiFePO4 materials. Among these methods, olivine-type LiFePO4 can be synthesized by a solid-state reaction method. The solid-state reaction is widely adopted for synthesis of pure crystalline olivine phase LiFePO4 [14].
In this study, LiFePO4 cathode material was synthesized by solid-state reaction method followed by one-step heat treatment. To improve the electrochemical characteristics, graphite nanofiber (GNF) was added to the LiFePO4 cathode material. The electrochemical characteristics of LiFePO4/Li cells were analyzed by cyclic voltammetry (CV), electrochemical impedance spectroscopy (EIS), and galvanostatic charge/discharge performance at 25℃.
LiFePO4 was prepared from starting materials of Li2CO3 (Aldrich, 99.0%), FeC2O4·2H2O (Aldrich, 99.0%), and NH4H2PO4 (Aldrich, 99.999%). The starting materials were mixed in a molar ratio for Li/Fe/P=1:1:1 by ball-milling with N-methyl-2-pyrrolidone (NMP) solvent at 300 rpm for 24 h. After that, the obtained LiFePO4 slurry was dried at 90℃ for 12 h in air. The prepared
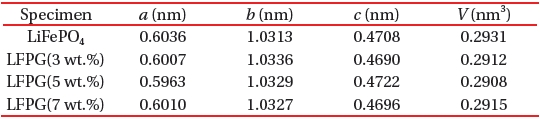
[Table 1.] The unit cell parameters of LiFePO4 and LiFePO4-GNF.

The unit cell parameters of LiFePO4 and LiFePO4-GNF.
LiFePO4 was pelletized then calcined at 650℃ for 5 h in a nitrogen atmosphere, then ground and ball-milled with NMP at 300 rpm for 6 h. Lastly, it was dried at 90℃ for 24 h in air and ground into powder.
In order to improve the low electronic conductivity of LiFePO4, 3 wt.%, 5 wt.%, and 7 wt.%, amounts of graphite nanofiber (GNF) (Diameter: ~300 nm, Length: ~30 um, purity: 90%) were respectively added to different samples.
The cathode electrode was fabricated onto Al foil using a homogeneous slurry. The slurry was prepared with 70 wt.% of the synthesized LiFePO4 (LFP) or LiFePO4-GNF (LFPG), 25 wt.% carbon black (SP-270), and 5 wt.% polyvinylidene di-fluoride (PVDF) binder, which was dissolved in NMP solvent. The slurry was spread onto the Al foil. After drying at 90℃ and being roll pressed, the area of the coated cathode electrode was cut to 2×2 cm2. The electrodes were dried in a vacuum oven under a vacuum pressure of 760 Torr at 110℃ for 24 h.
The LFP/Li cell and LFPG/Li cells were assembled in an argon filled glove box using lithium metal foil as the anode electrode. Polypropylene film (Celgard 2500) was used as the separator and a solution of 1M LiPF6 in ethylene carbonate (EC) and dimethyl carbonate (DMC) (1:1 in volume) was used as the electrolyte.
The samples were charged and discharged over a voltage range of 2.5-4.0 V using a current density of 0.1 mA/cm2 for both processes by WBCS-3000 8ch substation. Cyclic voltammetry (CV) measurements were performed using an IM6 instrument at a 0.1 mV/s scanning rate. AC impedance measurement was performed over the frequency range of 2 MHz to 10 mHz.
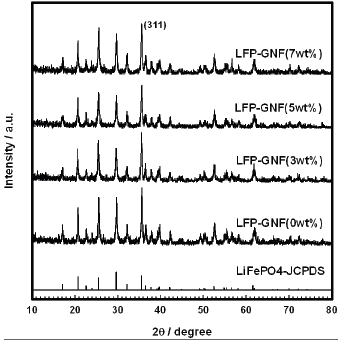
Figure 1 shows the XRD pattern of the LiFePO4 and LiFePO4- GNF samples. All the patterns can be indexed to a single-phase material having an orthorhombic olivine-type structure with a space group of
evidence for crystalline carbon, nor were there any amorphous peaks present. This is undoubtedly due to the small amount of carbon present and the thinness of the layer on the LiFePO4 and LiFePO4-GNF.
The unit cell parameters of the prepared samples are given in Table 1, which was calculated in the XRD analysis. The cell parameters for the LiFePO4 sample are
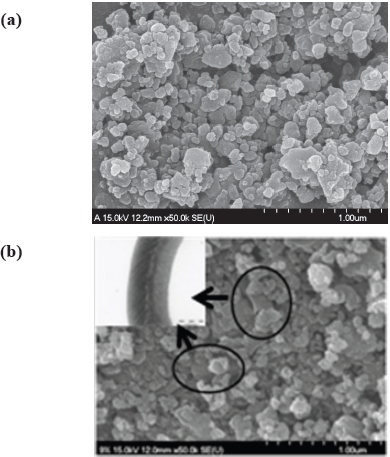
FE-SEM was tested to confirm the particle size and image of LiFePO4 and LiFePO4-GNF samples. Figure 2 show the FE-SEM images of LiFePO4 and LiFePO4-GNF. The figure shows that the particle size of all the samples is about 200~300 nm. For LiFePO4, small particle size is important for enhancing the electrochemical properties [15]. In particles with a small diameter, the lithium ions may diffuse over smaller distances between the surfaces and center during lithium intercalation and de-intercalation. And as
shown in Fig. 2(b), the typical morphology of tubular graphite nanofiber was observed (the image of the graphite nanofiber is shown in the inset, which is on the left). It can be seen that the LiFePO4 particles are homogenously adhered to the surface of the graphite nanofiber. The bridging graphite nanofiber can form an effective conducting network. At the same time, a porous structure between LiFePO4 and graphite nanofiber was formed by the random hybrid composite, which can facilitate the penetration of the electrolyte to the surface of active materials. As a result, LiFePO4-GNF has a superior rate capability and higher reversible capacities in comparison with the LiFePO4 [13].
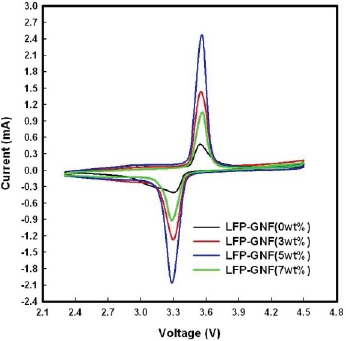
Figure 3 shows cyclic voltammograms of the LFP/Li cell and LFPG/Li cells taken at a scan rate of 0.1 mV/s, between 2.3~4.5 V at the 50th cycle. As for CV, the voltage difference between the oxidation peak and reduction peak is an important parameter to evaluate the electrochemical reaction reversibility [16]. All of the cells’ oxidation and reduction peaks appear at about 3.6 V and 3.3 V. The voltage difference between the oxidation and reduction peak is 0.3 V. Furthermore, the CV of the LFPG/Li cells shows more symmetry and a sharper shape of oxidation and reduction peaks, which indicates better electrochemical activity [17]. Particular, the intensity of the LFPG (5 wt.%) cell peak is highest. The well-defined peaks and smaller potential peak separation
indicate higher electrochemical reactivity and lower ohmic resistance for the LFPG(5 wt.%)/Li cell.
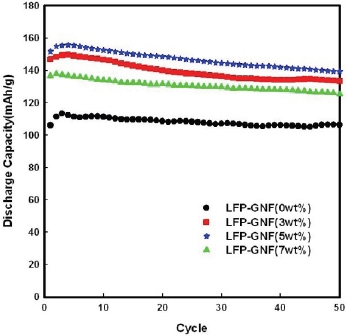
Figure 4 shows the discharge curves of the LFP/Li cell and LFPG/Li cells at a current density of 0.1 mA/cm2. The initial discharge capacity of the LFP/Li cell is 106.03 mAh/g. The highest capacity, which appears in the 3rd cycle, is 113.43 mAh/g. After 50 cycles, the discharge capacity is retained 106.32 mAh/g. To improve the capacity of LiFePO4, graphite nanofiber was added in amounts of 3 wt.%, 5 wt.%, 7 wt.% to LiFePO4. The initial discharge capacity of LFPG(5 wt.%)/Li cell is 151.73 mAh/g. The highest capacity is achieved in the 4th cycle at 155.63 mAh/g. After 50 cycles, the discharge capacity is retained at 139.45 mAh/ g. These results are the same as the FE-SEM and CV test results, which were analyzed above. In addition, compared to the LFP/Li cell, the discharge capacity of the LFPG(5 wt.%)/Li cell increased by 37.20%.
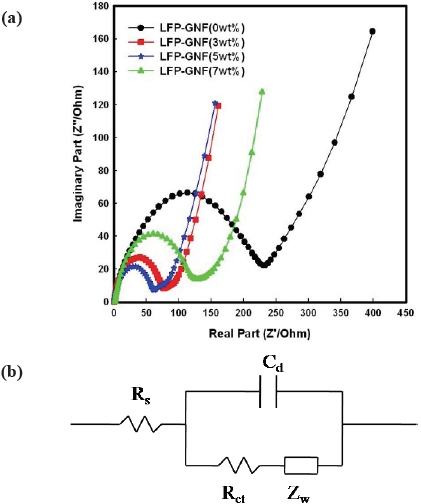
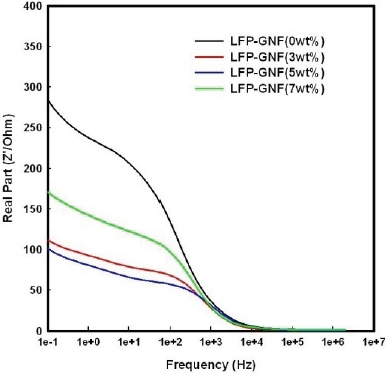
Figure 5(a) shows the impedance performance of the LFP/ Li and LFPG/Li cells at 25℃. The frequency range was from 2 MHz to 10 mHz, and amplitude was 5 mV. The AC impedance response of the cells consisted of a broad semicircle in the highmiddle frequency region and a sloping line in the low frequency region. The impedance spectra can be interpreted on the basis of an equivalent circuit with ohmic resistance (Rs), charge-transfer resistance (Rct), capacitance of the double layer (Cd), and Warburg impedance (Zw), as indicated in Fig. 5(b). It has been recognized that the high-middle frequency semicircles might correspond to the charge-transfer impedance that resulted from the electrochemical reaction at the electrode and electrolyte interface. The sloping line in the low frequency region is attributed to the Warburg impedance, which is associated with lithium ion diffusion in the LiFePO4 electrode. In the 10th cycle, the resistance of the LFP/Li cell is 280 Ω, and the resistance of the LFPG(5 wt.%)/Li cell is 100 Ω, which are shown in figure 3.6. It is obvious that the resistance decreased after adding the graphite nanofibers.
In this research, LiFePO4 cathode material with olivine structure was synthesized by solid-state method followed by one-step heat treatment. To improve the electrochemical characteristics of LiFePO4, graphite nanofiber was added, and the morphology properties were analyzed. During the lithium-ion intercalation and de-intercalation processes, the lithium-ion diffusion coefficient was boosted after adding GNF. Impedance results show that the conductivity was enhanced by the added GNF, because the charge-transfer resistance was significantly reduced. Cyclic voltammetry results indicated that the electrode redox reaction reversibility was excellent due to adding GNF. The LFPG(5 wt.%)/ Li cell exhibited superior high discharge capacity and cycling stability at 25℃. The results demonstrate that a feasible route of adding GNF by solid-state reaction has been offered.