Inclusion Compounds (ICs) including PEO-urea complexes have extraordinary structures and each polymer chain is surrounded by nano-channels that are composed of small molecules. The structures of ICs have been studied with much interest, as the characteristics of each polymer chain exclude the interactions with other polymer chains and this differs from the characteristics of bundles of other ordinary polymers [1]. Studies of PEO-urea complexes have focused particularly on the extent of the unique structures of ICs [2-6]. PEO-urea complexes are known to form two different structural phases. One is the stable α-phase complexes with a urea/PEO ratio of 1.8 and the other is the metastable β-phase complexes with a urea/PEO ratio of 1.0. Some parts of the β-phase complexes can be transformed into α-phase complexes by increasing the urea mole fraction or by heating. The β-α transition of PEO-urea complexes and their structural phase diagrams have been intensively studied [2,5-10]. While their fundamental chemical properties, structural phases, and stabilities have been widely reported, very little is known about the electrical I-V characteristics or conductivities of PEOurea complexes. In this study, the dependence of the electrical characteristics on the phase of PEO-urea complex films was investigated. The three different phases of the complex films were first examined and then, the electrical I-V characteristics obtained from the different phase composites were compared with the corresponding phases. Finally, the dependence of the electrical characteristics on the phase of complex films was analyzed and discussed.
Poly(ethylene oxide) (PEO, Mw = 900,000 g/mol) and urea (Sigma-Aldrich, U5378) were used without further purification. The chemical structures of the PEO and urea molecules are shown in the inset of Fig. 1. 0.1 g of PEO powder was mixed with various concentrations of urea (0~1 M) in 1 ml of D.I. water and then stirred for 2 h. For the FT-IR, XRD, and SEM measurements, the mixture solutions of PEO and urea were spin-coated on glass substrates at 800 rpm for 30 s, 2,000 rpm for 90 s, and 5,000 rpm for 30 s, sequentially. In order to examine their electrical
characteristics, the PEO-urea complex films were formed on patterned glass substrates with gold electrodes that were thermally deposited by using a finger pattern metal mask with a length of 500 μm. The dc conductivities were obtained through four-probe measurements. The dimensions of the complex film present between the two adjacent electrodes of the four Au electrodes were about a length of 100 μm and width of 3 mm. All the measurements were taken at room temperature.
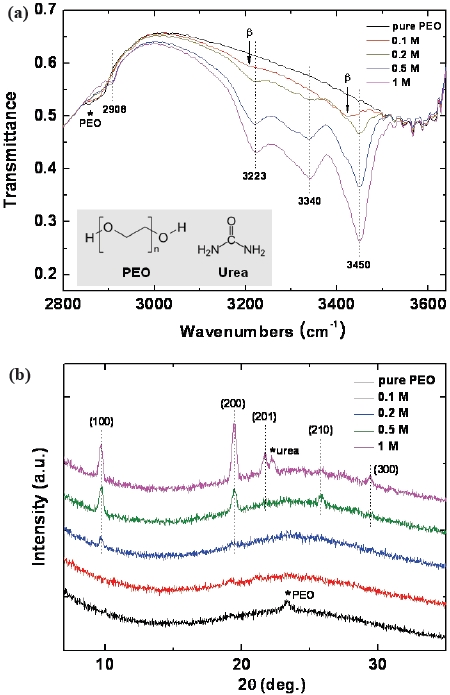
Figure 1(a) shows the FT-IR spectra of the PEO-urea complex films with various concentrations of urea (0~1 M). First, the spectrum of the pure PEO film is characterized by examining the symmetric stretching vibrations of the CH2 groups of the PEO chains that were present at 2,857~2,888 cm-1. The PEO-urea complex bands are identified by the CH2 groups at 2,908 cm-1 and the N-H stretching bands near 3,223, 3,340 and 3,450 cm-1. The N-H stretching bands are related to the hydrogen bonds in the molecular complex that was formed between the ether oxygen of PEO and the NH2 groups of urea [3], so that they appear in the α-phase or β-phase depending on the stoichiometric relationship (more specifically, urea/PEO= 1.8 for the α-phase and 1.0 for the β-phase).
As shown in Fig. 1(a), the N-H stretching bands in the spectrum of the film with a urea concentration of 0.1 M were observed at lower frequencies compared to those in the spectra of the film with urea concentrations of more than 0.2 M. This indicates that the complex with a urea concentration of 0.1 M
consists mainly of the β-phase and that the other complexes with urea concentrations of more than 0.2 M consist mainly of the α-phase [9]. Therefore, the β-phase of the complex transforms into the α-phase with an increase in the urea concentration [4]: this transformation is hereafter, referred to as the β-α transition. Figure 1(b) shows the XRD patterns of the complex films with various concentrations of urea (0~1 M). The pure PEO film exhibited the PEO characteristic peak that appears at a 2 θ angle of 23.2°. For urea concentrations higher than 0.2 M, the α-phase characteristic peaks of the complex films were assigned to the 100, 200, 201, 210 and 300 planes of the α-phase [6], as shown in Fig. 1(b). Moreover, at a urea concentration of 1 M, a pure urea peak was also observed at 22.2°. Note that, for comparison, the distinct XRD peaks of the α-phase obtained from relatively high urea concentrations of 0.5 and 1 M are also added in Fig. 1(b). However, definite peaks of the β-phase were not observed in this XRD study, perhaps this is due to the relatively low crystallinity of the β-phase.
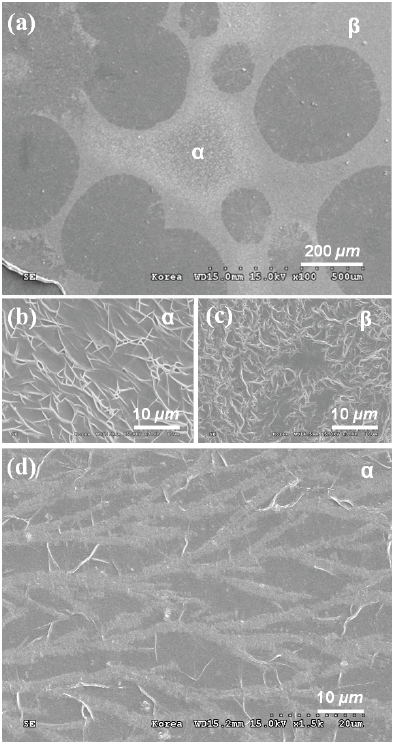
The SEM images of the PEO-urea complex films are exhibited in Fig. 2. In Fig. 2(a), both the α- and β-phases are present in a single complex film with a urea concentration of 0.2 M. The negative spherulites that are seen in Fig. 2(a) correspond to the PEO chains. The existence of the spherulites implies that some of the PEO chains escaped from the β-phase complex (urea/PEO=1.0) during the β-α transition [4]. Note that a higher urea ratio is required for the α-phase complex (urea/PEO=1.8). The enlarged SEM images of the α- and β-phase parts shown in Fig. 2(a) are presented in Figs. 2(b) and (c), respectively. A careful comparison of the SEM images reveals that the shape of the α-phase
consists of straight tree-shaped fractals, while the β-phase has the shape of curly random-networks. At urea concentrations that were higher than ~0.25 M, the β-phase is absent and the α-phase with tree-shaped fractals having thicker branches covers the glass substrate entirely. For relatively higher concentrations, the β-phase transforms into the α-phase, and all the bundles of the PEO chains with the shape of negative spherulites are used up to form the α-phase. Figure 2(d) demonstrates that the film with a urea concentration of 0.3 M consists only of the α-phase.
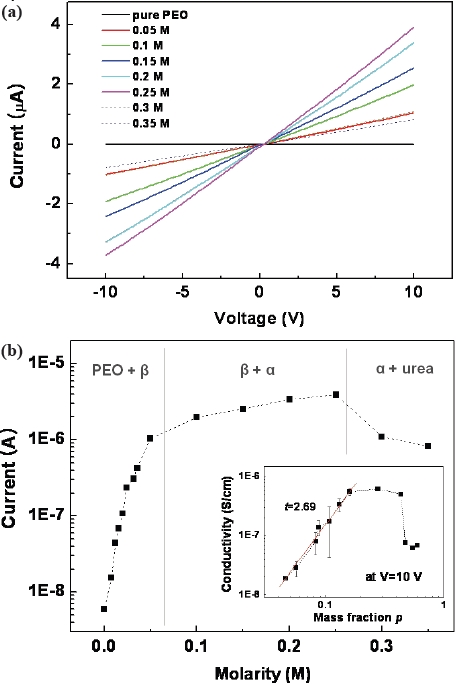
The current-voltage (
The structural and electrical characteristics of the PEO-urea complex films prepared in this study were investigated using various molar ratios. As the urea concentration increases, the complex films exhibit a metastable β-phase and stable α-phase sequentially. The conductance of the complex films increases rapidly and then, gradually with an increasing urea concentration. These electrical characteristics can be explained by the percolation behaviors of the films with the percolation threshold at