With the emergence of knowledge-based economy, intangible assets such as knowledge and technology have become critical factors that determine the competitiveness of firms and countries. It is thus important for firms and countries to generate, accept, and propagate new knowledge and technology in order to maintain a competitive edge over others and sustain their growth in the global market. Accordingly, individual firms and nations are dedicating their efforts to promoting technology innovations, which they use to boost their technological and economic achievements.
Technology innovation, which is an intangible asset, is actually difficult to measure, apart from its significance in strategy and policy. Thus, the input and output factors related to technology innovation are used as indicators of technology innovation, but there are limitations in that they are only proxies regardless of the variables used. This study focuses on the patent as an indicator of technology innovation. Although a patent cannot be completely free from the common limitations of proxy variables, it can at least guarantee technological achievement and commercial utility and is growing in importance as an intellectual property right amidst fierce technological competition.
The number of patent applications in the world in 2010 was 1.98 million, which is a 7.2% increase from the previous year despite the global economic crisis (WIPO, 2011). This is the biggest increase in the last five years and signifies that technological innovation has been actively taking place worldwide. With respect to the number of filed patent applications, South Korea ranked 4th in the world in 2010 with slightly over 170,000 filed patent applications, following the U.S. (490,000), China (391,000) and Japan (344,000). In particular, China has shown the fastest growth with an average annual increase of 22.6% between 2001 and 2010.
Granted that, which factors contribute to the increase in the number of patent applications? Considering the number of patent applications as a performance indicator of technology innovation, the increase in the number is thought to be highly affected by increases in R&D investment, investment efficiency, and patent propensity. Precedent studies usually point to input factors such as R&D expenditure and R&D personnel as well as R&D infrastructure such as the R&D organization, strategies and other corporate characteristics of companies as the determinants of technology innovation.
The objective of this study is to analyze the factors that determine technology innovation through an estimate of the patent production function of manufacturing firms in South Korea. In particular, this study focuses on the internal knowledge-diffusion mechanism and market strategies of firms as the determinants of technology innovation. If the firm’s internal knowledge-diffusion mechanism is well established, the knowledge spillover among the staff members is expected to lead to significantly greater technological innovations with the same R&D investment. Also, it can be deduced that firms that are actively engaged in the development of new products and in the pioneering of new markets will be more aggressive in technologically innovative activities compared to other firms. However, previous studies rarely dealt with these factors as the determinants of the technology innovation of firms. This study is therefore expected to provide important implications in setting corporate strategies and relevant government policies through its analysis of the effects of the important strategic variables of firms on their technology innovation.
This paper is organized as follows. In section II, the determinants of technology innovation and its economic achievements will be reviewed, centering on patents discussed in precedent studies. Next, in section III, a model and data will be explained for the analysis of the determinants of technology innovation. Then in section IV, a concrete estimation method will be explained. The major findings of the analysis will be presented in section V and the significance and implications of the results of the analysis will be explained in section VI.
2.1 Technology Innovation, Patents and Economic Outcome
As mentioned above, technology innovation is itself an intangible asset and is thus difficult to measure. It is commonly measured by either input indicators such as the R&D expenditure or output indicators such as patent or total factor productivity. There are both advantages and disadvantages of using input and output indicators, but in terms of technological innovation achievements, the most commonly used indicator is patent statistics. Patents are widely used as indicators of innovation of individual companies, regions and countries as they are considered as the latest technical knowledge that displays originality, generating economic value through licensing and technology transfer, and possessing the potential to be widely utilized in many industries (Acs and Audretsch, 1989; Griliches, 1990; Fung and Chow, 2002; Johnstone et al., 2010; Tseng et al., 2011).
Studies on the economic effects of patents as indicators of technological innovation show that patents play an important role in national economic growth and the business achievements of companies. Yang and Chen (2003) analyzed the relationship between the market value and the number of registered patents of electrical and electronic companies and confirmed that the number of registered patents had a positive impact on the market value of the companies. The findings of the study performed by Czarnitzki and Kraft (2004) revealed that the patent stock was an important factor that enhanced the credit rating of a company. Park, Park and Cho (2006) analyzed the relationship between the technological innovation and business performance of domestic high-tech companies and determined that the number of domestically registered patents per 1,000 employees had a significant effect on the net income per employee. Chen (2011) also identified a positive relationship between registered patents in an important technological sector and corporate growth. Lee (2007) discovered that the rate of increase of patents had a positive effect on the economic growth rate through a regression analysis, while Hasan and Tucci (2010) showed that nations with larger numbers of patents had a higher economic growth rate.
2.2 Factors Determining Technology Innovation
If a patent, as an indicator of technological innovation, is an important factor for improving corporate performance and promoting economic growth, our next concern should be the factors that promote patent output. Based on the fact that patents are produced as a result of R&D activities, we can infer that the R&D input factors and the R&D-related corporate organizational capabilities are critical factors that determine patent output.
According to the resource-based view of the firm, corporate resources and organizational capabilities are the key factors that determine corporate competitive advantage and its sustainability (Barney, 1991; Wernerfelt, 1984). It applies to corporate knowledge creation (e.g., technological innovation), which has been increasingly important in securing corporate competitiveness and its long-term growth. Put differently, corporate knowledge resources (e.g., R&D personnel) and its strategic management capabilities (e.g., strategic human resource management) are critical for corporate knowledge creation, which, in turn, largely determines the firm’s competitive advantage in this knowledge-based economy.
With respect to the firm’s technological innovation, the existing literature mostly confirms the significant role of corporate R&D resources. Although the size of the effect and its statistical significance vary depending on the study, most previous studies reported that the R&D expenditure or R&D intensity had a positive relationship with patent output or corporate performance (Bound et al., 1984; Jaffe, 1996; Crepon, et al., 1998; Kwon, Kim and Choi, 2009). The number and quality of R&D personnel were also important determining factors in technological innovation. In particular, the more advanced the technology is, the more importance the high-quality R&D personnel and enhanced research productivity have in determining the achievements of technological innovation (Audretsch and Stephan, 1996; Zucker, Darby and Brewer, 1998; Kang and Seo, 2005; Jung, 2006; Jung, Roh and Cho, 2008).
Organizational capabilities to acquire a knowledge resource, articulate and amplify it, and put it into use in the most efficient way are also critical in corporate knowledge creation, especially in a dynamic and rapidly changing environment (Nonaka, 1994; Grant, 1996; Lee and Kim, 2001). Among others, the corporate knowledge diffusion system constitutes a key element of organizational capabilities for knowledge creation (Davenport and Prusak, 1998; Ernst and Kim, 2002; Tsai, 2008). Damanpour (1991) proposed that the creative behaviors of the members of an organization vary depending on the characteristics of the organization; if the decision-making power is concentrated among the top executives and the company has extremely strict operating rules and regulations, it poses difficulties for the members to suggest and experiment with their creative ideas, which, in turn, inhibit corporate innovation.
Firms’ market strategy is also closely related to corporate organizational capability. Miles et al. (1978) asserted that the firms that find and exploit new product and market opportunities (prospectors, in his classification) are likely to be active innovators, while those with a stability strategy (defenders, in his classification) are not likely so. Ahuja (2000) analyzed that strategic alliances between companies which share technologies that can mutually benefit one another and increase the accessibility of important information can become an important source of technological innovation. Park and Kim (2010) confirmed that such an R&D alliance increases technological innovation when the company has a strong resolution or motivation to explore new technology and has the appropriate capacity to do so; however, such an alliance produces no positive effects for companies that do not fit these criteria.
Corporate R&D organization and strategies are also pointed out as important determinants of technological innovation (Damanpour, 1991; Nesta and Saviotti, 2005). Strategic factors such as the proportion of the total R&D investment directed towards demand-led R&D activities or projects proposed by the R&D division were identified to have an influence on the success of the R&D activities of a company (Mansfield and Wagner, 1975). Kwon, Kim and Choi (2009) pointed out that the degree of capital intensity and the proportion of export influenced technological innovation. Song and Oh (2010) explained that corporate size and market concentration were important factors that promoted the technological innovation activities of firms.
Considering the patent as a result of resource allocation for technological innovation activities such as R&D, the patent production function of firms can be expressed as follows:

where
For the empirical analysis, data from the Human Capital Corporate Panel (HCCP) were used. HCCP comprises of data collected from biennial surveys that have been conducted since 2005 to identify the human resource accumulation process and contents of companies under the supervision of Korea Research Institute for Vocational Education and Training (KRIVET). The target companies are those which are registered in the
Unlike the 1st and 2nd year surveys, there were some changes made in the population and sampling methods in the 3rd year survey. In this study, the most recent survey data from the 3rd year (2009) were used. All variables except the patents are based on the statistical data of 2008 that were collected in 2009, and the information on the patents was obtained from the 2009 statistics provided by the KIPO. Among the total of 473 companies, the firms in the service industry that are not significantly relevant to patent application and those with omitted data on key variables were excluded. Data on the remaining 317 companies in the manufacturing industry were used in the analysis.
In this study, the number of patent applications filed by a company in 2009 was used as an indicator of the company’s technology innovation. The R&D resources used for R&D activities and the organizational capabilities represented by the in-house knowledge-sharing system, market strategies and other corporate characteristic variables were used as the explanatory variables of the technological innovation achievements of the company.
First, as for R&D resource variables, R&D intensity and the number of researchers were included as proxy variables for R&D investment, and the proportion of employees with a master’s or doctorate degree was used as an indicator of the quality of R&D personnel. R&D expenditure is commonly used as an R&D investment variable, but because of its strong correlation with the number of R&D personnel, the R&D intensity (ratio of annual R&D expenditure to sales) was used instead in this study. Although the proportion of R&D personnel with a master’s or doctorate degree is a suitable indicator of the quality of R&D personnel, such information was not on hand; thus the ratio of M.S./Ph.D. degree-holders to total employees (in %) was used as an indicator of the quality of personnel.
Secondly, dummy variables were used for the knowledge-sharing processes and the internal education and training organization with respect to the internal knowledge production infrastructure of a company. The variable for education and training organization is a dummy variable on whether there is an organization that is in charge of education and training within the company, and the variable for knowledge-sharing processes is a dummy variable that indicates whether there is a knowledge acquisition program for changes in processes or R&D.
Thirdly, dummy variables were created to indicate whether there is the presence of a market strategy for the leading products of the companies and a strategic alliance with another company. With respect to the question on market strategy for the leading products, the companies that responded “We develop new products before our competitors to play a leading role in creating changes among consumers and in the market” were categorized as ‘market-leading type’; the companies that responded “We do not enter new markets or act as leaders in developing new products, but target the market by selectively developing new products according to the achievements of the leading companies” were categorized as ‘catch-up type’; and the companies that responded “We maintain a stable position in the market by improving our existing products and do not actively attempt to enter new markets or develop new products” were categorized as ‘stability type.’ Among them, the catch-up type was designated as the reference group and dummy variables were created for both the leading-type and the stability-type for analysis.
[Table 1] Variable Definition and Summary Statistics
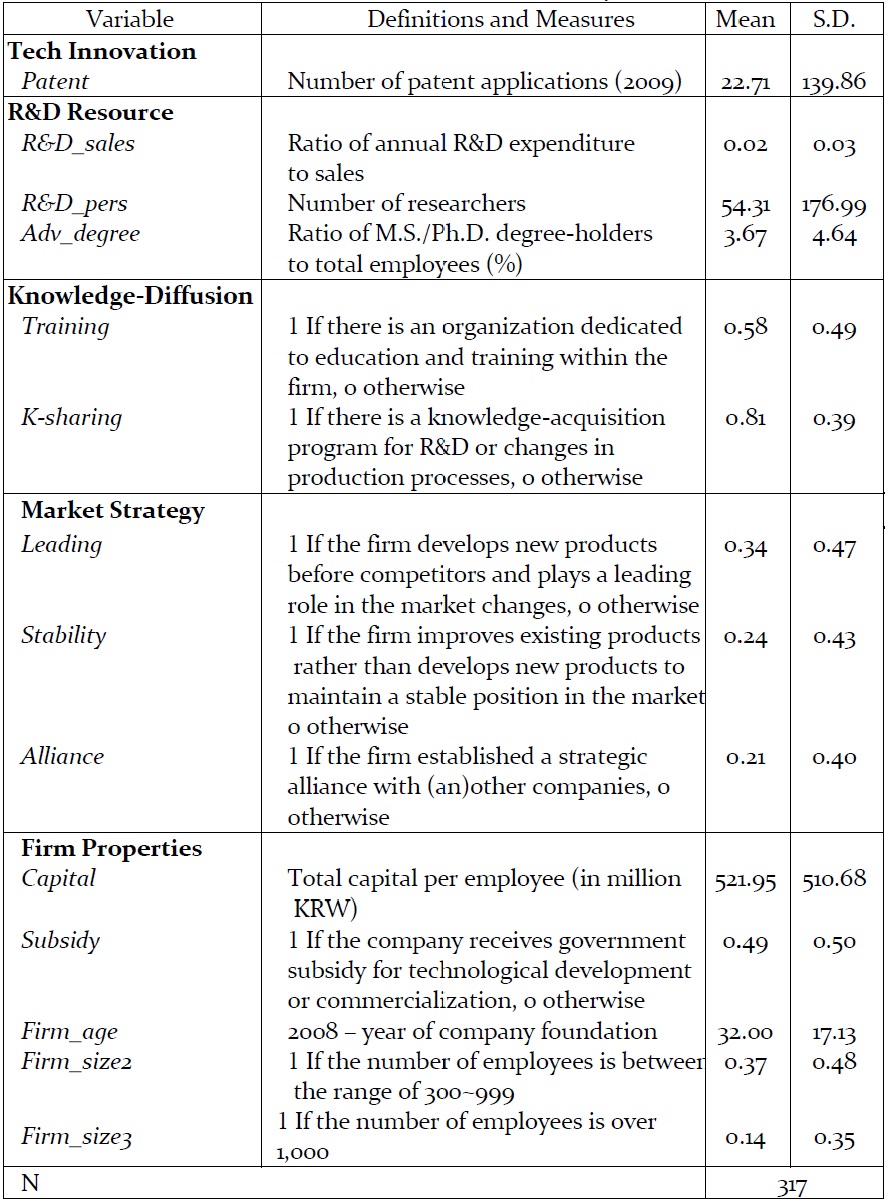
Variable Definition and Summary Statistics
Lastly, the variables of capital per employee, utilization of government subsidy, and firm age and size were used as the other corporate characteristic variables related to the technological innovation of firms. The degree of capital intensity was the total capital per employee (in million KRW), and the government subsidy was a dummy variable on whether the company received tax deductions or utilized government subsidy with respect to technological development or commercialization. The firm age was determined by subtracting the year of company foundation from year 2008. As for the firm size, companies with 100-299 employees were designated as a reference group, and dummy variables were created for a group of companies with 300-999 employees and a group of companies with over 1,000 employees for comparison.
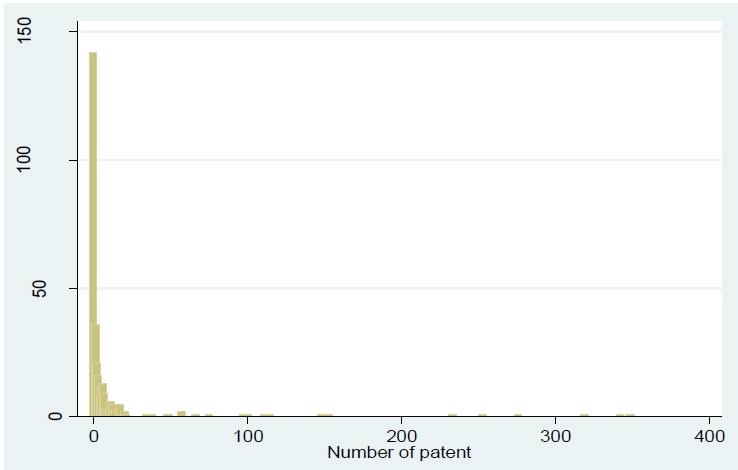
Table 1 shows the basic statistics and the method used to measure these variables. The number of patent applications in 2009, which is the indicator of the technology innovation of firms, was 22.7 on average; in addition, there is a significant difference among the numbers of patent applications of companies as detected from the size of standard deviation. Forty-five percent of the companies did not file patent applications in 2009 and the number of patent applications filed by 50.8% of the companies ranged from 1 to 99. The remaining 4.4% are companies that filed more than 100 patent applications.
Regarding the R&D resource variables, firms, on average, invested 1.8% of the corporate revenues towards R&D activities and had 54 researchers; about 3.7% of employees, on average, were those with masters or doctorate degrees. There was also a large variation in the R&D resource variables among the companies. Pertaining to the knowledge-sharing variables, the knowledge-diffusion infrastructure was well established within the companies with nearly 60% of companies operating an organization dedicated to education and training and over 80% of them operating knowledge-acquisition programs with respect to R&D and changes in production processes. As for market strategies, the firms were mostly the catch-up type (41%), followed by the leading-type (34%) and stability-type (25%). Approximately 20% of the companies have formed strategic alliances with other companies and nearly half of the companies utilized government subsidy towards technological innovation.1
1 As shown in Table A.1 (in Appendix), the correlation among the explanatory variables was relatively low and all variables were included in the regression analysis for the estimation.
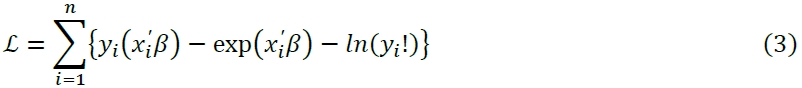
For empirical estimation of the patent production function, where the number of patent applications is the dependent variable, we use count-data models. We start with the Poisson regression model, which is the most basic model that explicitly addresses the nonnegative integer-valued aspect of the dependent count variable. The probability mass function for the Poisson regression model is specified as:
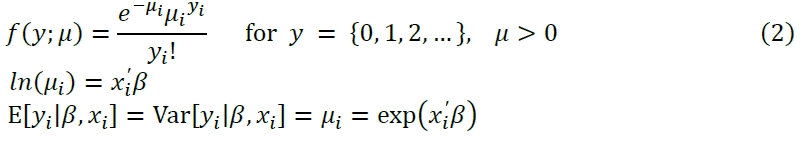
where μ is the mean rate parameter.
The log-likelihood function for the Poisson regression model is then the following:
The Poisson distribution assumes equidispersion, i.e., the mean and variance being equivalent. The Poisson regression is thus not appropriate in cases of over-dispersion in which the response variance is greater than the mean. The negative binomial (NB) regression model can be used instead when over-dispersion occurs.
The negative binomial regression has the following probability mass function:
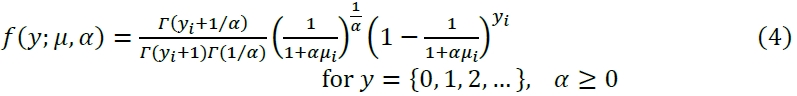
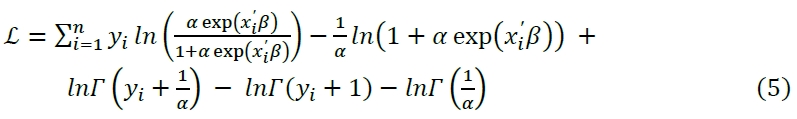
where α is a heterogeneity or over-dispersion parameter. The Poisson regression is a special case of negative binomial regression with α=0. The log-likelihood function for the negative binomial regression is the following:
Since the negative binomial regression model reduces to the Poisson regression model when α=0, we can test for over-dispersion by testing
Our next concern is how to deal with a large number of zero counts in our patent data set, in which zero is the most common number of patent application.2 A vast number of these firms might have a positive probability of patent application but happened to have no patent application for the observed year. Some of these firms, however, might have virtually a probability of zero for patent application whatsoever, inflating the number of zeros in the data set.
Zero-inflated count models provide a way of modeling the excess zeros (Greene, 1994; Hilbe, 2011). We use herein the zero-inflated negative binomial (ZINB) model, taking into account the excess zeros as well as the over-dispersion problem. The probability function for the zero-inflated negative binomial regression model is specified as:
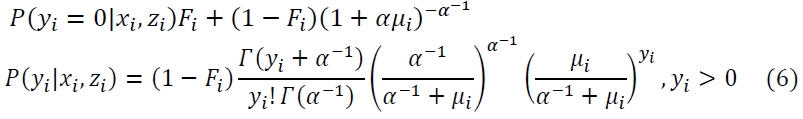
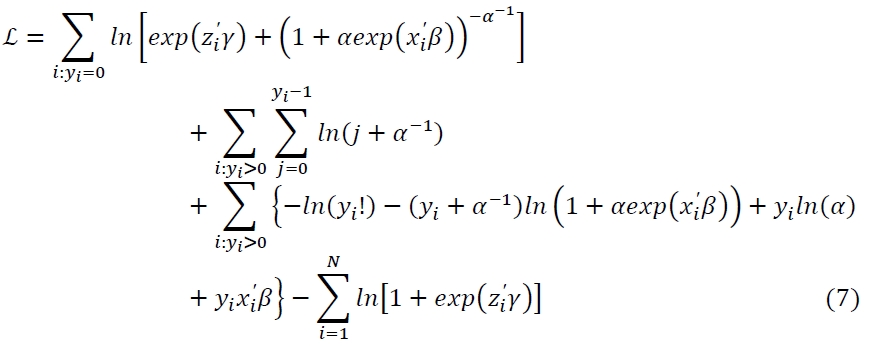
The log-likelihood function of the zero-inflated negative binomial with logit is specified below. In this study, we assume that the predictors for the binary process and those for the count process are equivalent.
The Vuong (1989) test result favors the zero-inflated negative binomial model for fitting the data most appropriately (see Table 2). Accordingly, we present our empirical results hereinafter, based on the ZINB regression estimation.
[Table 2] Estimates of Patent Equation: Count Data Model
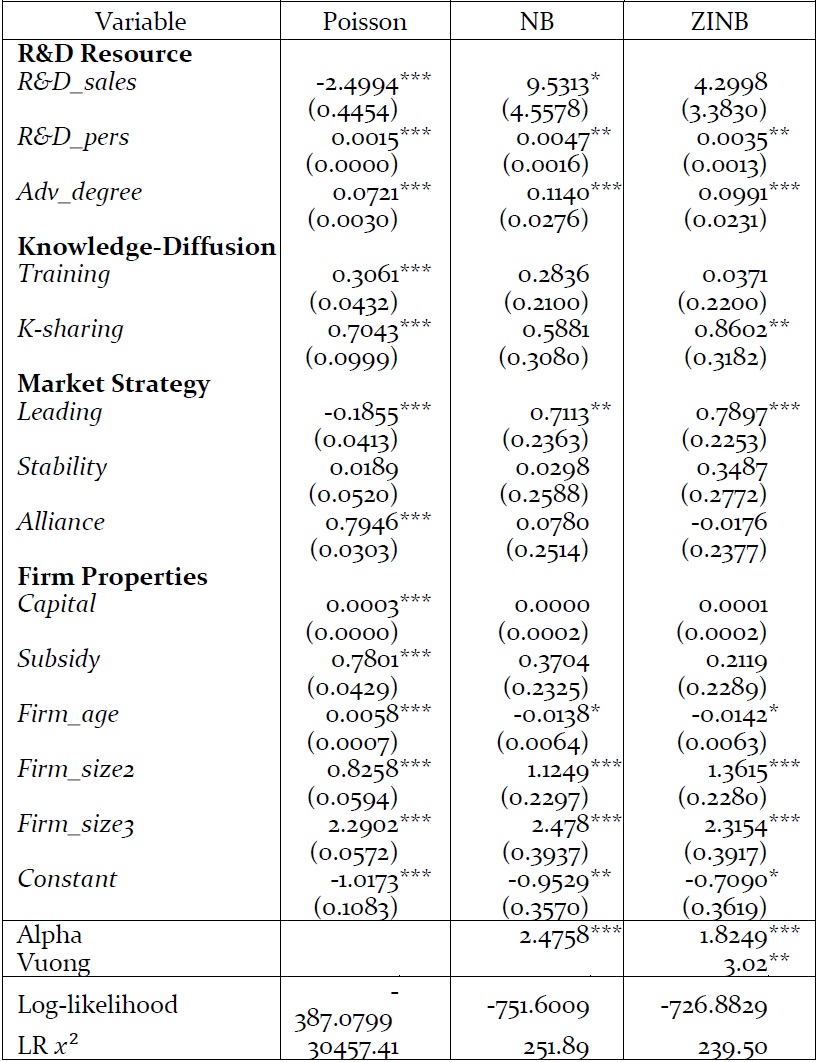
Estimates of Patent Equation: Count Data Model
2 See Figure A.1 (in Appendix) for the histogram of the corporate patent application distribution.
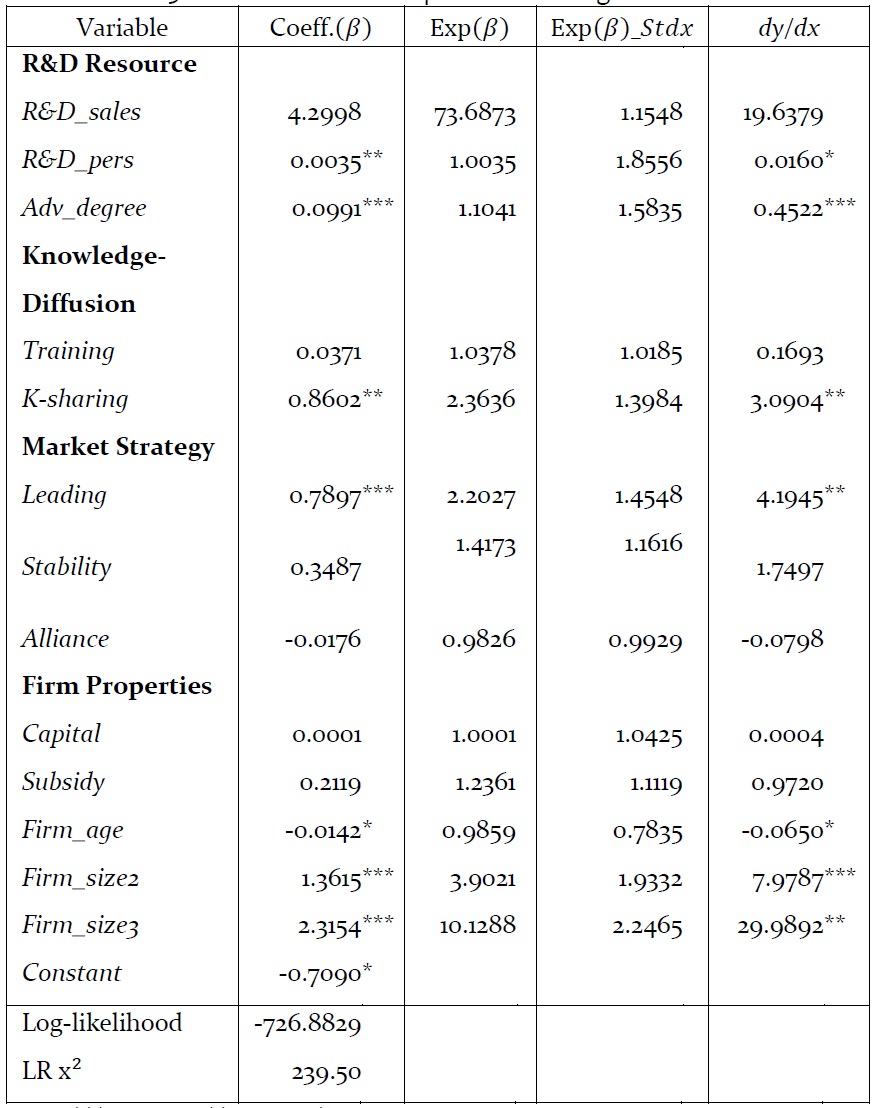
Table 3 presents the zero-inflated negative binomial (ZINB) regression results for the patent equation. In regard to the R&D resource variables, both the number of R&D personnel and the ratio of the advanced degree-holders among employees significantly raise the number of patent applications of the firms; the corporate R&D intensity also tends to increase the number of patent applications, but lacks statistical significance. It thus confirms the notion that securing qualified research personnel is a prerequisite for technology innovation in the firm.
As for intra-firm knowledge diffusion, which is of main interest in this paper, the knowledge-sharing system within a firm significantly contributes to the firm’s patent production. The operation of the knowledge-sharing system within the firm increases the expected number of corporate patent applications by a factor of 2.36, holding all other variables constant. It thus behooves the firm to encourage knowledge sharing and diffusion among its workforce, especially in the occurrence of R&D and other innovation-related activities, for it will enhance the productivity of such activities. The firm that runs its own employee training system is also likely to render more patent applications, but such an advantage over those firms without an employee training system is not sufficient enough to be statistically significant.
A firm’s market strategy is also related to its technology innovation output. Firms that adopt a market-leading strategy and are aggressive in new product development and market creation opt to have more patent applications,
Among the various firm properties, both the age and the size of the firm are significantly related to the firm’s technology output, but in opposite directions. Firms tend to be more fertile in patent production the younger and the larger they are, other things being equal. The large positive correlation between the firm size and the number of patent applications may be, to a large extent, due to the relative affluence of corporate resources of large firms. The negative correlation between the firm age and the number of patent applications insinuates that younger firms tend to be more inclined to engage in technology innovation than older firms,
[Table 3] Estimates of Patent Equation: ZINB Regression Results

Estimates of Patent Equation: ZINB Regression Results
3 The full evaluation of the government R&D subsidy program requires further scrutinized inspection, so our results here should be interpreted with caution.
This paper analyzed the factors that determine technology innovation in Korean manufacturing firms, using patent application statistics as a proxy for corporate technology innovation. The major contribution of this paper is that it focuses on the role of intra-firm knowledge diffusion and market strategy in corporate patent production, which had drawn little attention in previous studies in this arena. It was hypothesized that firms which are active in intra-firm knowledge diffusion are likely to have higher odds for success in technology innovation. A firm’s market strategy was also assumed to bear upon its technology innovation, since this will affect the firm’s resource allocation and patent strategy.
For empirical analysis, we utilized the zero-inflated negative binomial (ZINB) regression analysis, taking into account both the over-dispersion (violating the equidispersion assumption of the Poisson regression) and the inflation of the number of zeros (an excessive number of outcome zeros with two possible processes to reach a zero outcome). The data was drawn from the 2009 Human Capital Corporate Panel (HCCP) data, which render the firms’ patent statistics (patent application in 2009) along with the data on corporate human resource management and extensive firm-specific characteristics.
The empirical findings confirm the critical role of intra-firm knowledge-diffusion in technology innovation. The firms are substantially more prolific in patent production if they have a knowledge-sharing process that offers an educational or training program for their employees in the occurrence of R&D activities or changes in the production process, as compared to the firms without such a process. Firms that have a market-leading strategy oriented to new product development are also more active in patent production. The empirical results of this paper also confirm the significant effect of the size and quality of the R& D personnel utilized for the firm’s R& D activity on corporate technology innovation as measured by patent production. Other things being equal, firms yield more patent applications the larger and the younger they are. Governmental subsidies for firm’s R& D investment, however, appear to be ineffective in increasing patent production, at least in the firms analyzed in this paper.
Some implications can be drawn from our analysis of corporate technology innovation. First, firms need to invest in the intra-firm knowledge diffusion process and in human resources development in order to take full advantage of their R&D efforts. Firms’ R& D investment will yield higher odds of technological success, if reinforced by the positive spillover effect through knowledge sharing and diffusion among the workforce and human capital accumulation. Secondly, a market-leading strategy for the firm ? being active in new product development and new market creation ? works to stimulate the firm’s technology innovation. Third, government financial subsidies for firms’ R& D investment should be scrutinized for ways to improve its effectiveness in facilitating firms’ technology innovation.
[Table A.1-1] Correlation among the Explanatory Variables
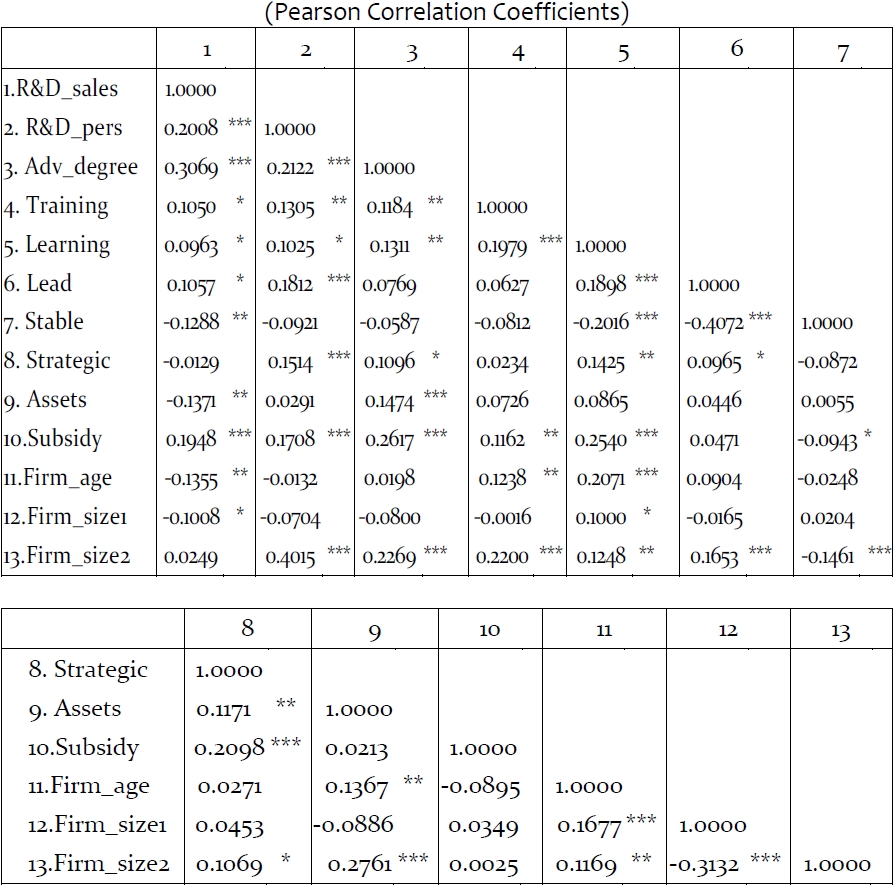
Correlation among the Explanatory Variables