Adhesive joints are widely used in a variety of industries. In general, an adhesive is placed between adherend surfaces and solidifies in order to produce an adhesive bond. Adhesively bonded joints provide several advantages such as low structural weight, lower fabrication cost, and improved damage tolerance [1].
One of interesting adhesively-bonded joints is the T-joint, in which two members are located at right angles to each other. Several research results on T-joints have been published. Toftegaard et al. [2] conducted a study on the design and testing of lightweight sandwich joints for naval ships. A method for a finite element parameter study was developed and used for the selection of a promising (strong) configuration regarding the T-joint while reducing the weight of the structure. Khalili et al. [3] studied, through numerical analysis, the effects of fillet geometry and the core material of sandwich panels on the performance of T-joints. A 45˚ base angle of the fillet was found to result in the highest failure load of the joint. Damages in the modes of adhesive failure and core shear failure were modeled and validated using the experimental results available in the literature. Silva et al. [4] investigated the strength of a variety of metallic T-joints through experiments to ascertain the main parameters that influence the strength depending on the manufacturing method. The joint with two support gussets was the strongest T-joint. The failure was probably governed by the plastic hinge generated by yield of the base sheet.
Several works relate to failure prediction. Bahdi et al. [5] conducted experimental and numerical studies on the failure of an adhesively bonded T-joint. Explicit finite element analysis in conjunction with a cohesive zone model was applied in order to predict the fracture patterns, loaddisplacement curves, and local strain trends. Castagnetti et al. [6] showed a method based on the standard finite element technique to predict the failure of a bonded T-peel joint. The adhesive was modeled using a kinematic constraint. Dharmawan et al. [7] studied the effect of disbond at a T-joint subjected to pull-off loading. Initial delamination was generated inside the adhesive. A crack tip element was used to predict the failure load of the joints. The work of Kesavan et al. [8] related to the damage detection of T-joints. They investigated the strain distribution in the joints under tensile pull-out loads and determined the presence and the extent of disbonds. The work dealt with a real time structural monitoring system capable of determining the presence,
location, and the extent of damage in a composite structure. Artificial neural networks were used to determine damage development.
A disadvantage of adhesively-bonded joints is the environmental dependence of the adhesive. Banea et al. [1], in a review work, showed that the main environmental factors in climatic exposure are temperature and humidity. Prolonged exposure or even short term exposure to elevated temperatures will often produce irreversible chemical and physical changes within adhesives. The presence of moisture in adhesive joints may not only weaken the physical and chemical properties of the adhesive itself but also the interface between the adhesive and the substrate. A wide range of degradation mechanisms includes plasticization, hydration, and microcracking of the polymer, as well as fiber-matrix weakening in composite joints. In addition, since adhesive joints are systems comprised of adherends, adhesives, and interphase regions, the performance with regards to each of these components may strongly affect the performance of the joint. Thus, general knowledge of the behavior for adhesives exposed to various environments must be supplemented by examining the behavior of specific bonded systems.
There are several studies on the environmental effects on lap joints in which the adhesive undergoes mostly shear stresses. Bordes et al. [9] investigated the long-term strength of adhesively-bonded steel/epoxy joints in sea water and observed the degradation of the mechanical properties of an epoxy adhesive. Court et al. [10] performed a study to predict joint lifetimes. Both the damage-initiating stress and the failure stress of the joints decrease as the aging time increases. The aging is attributed to the combined effects of humidity, temperature, and time. This aging process causes damage to the adhesive joint. Aging leads to a significant reduction in the joint failure stresses and a change in the failure mode.
However, research on the environmental effects on the joints has been limited to the lap joint, and studies on adhesively bonded T-joints are rarely found. In this paper, therefore, an experiment was conducted to investigate the effects of environmental conditions on the failure of composite T-joints with different adhesive thicknesses. Two environmental conditions were considered: room temperature and dry (RTD) and elevated temperature and wet (ETW). Three adhesive thicknesses were involved. In addition to experimental work, a finite element analysis was also performed with an aim to further understand the failure of the joints.
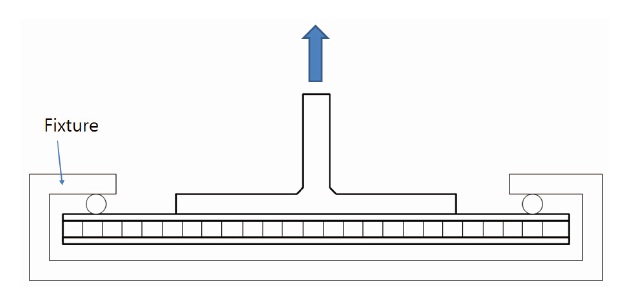
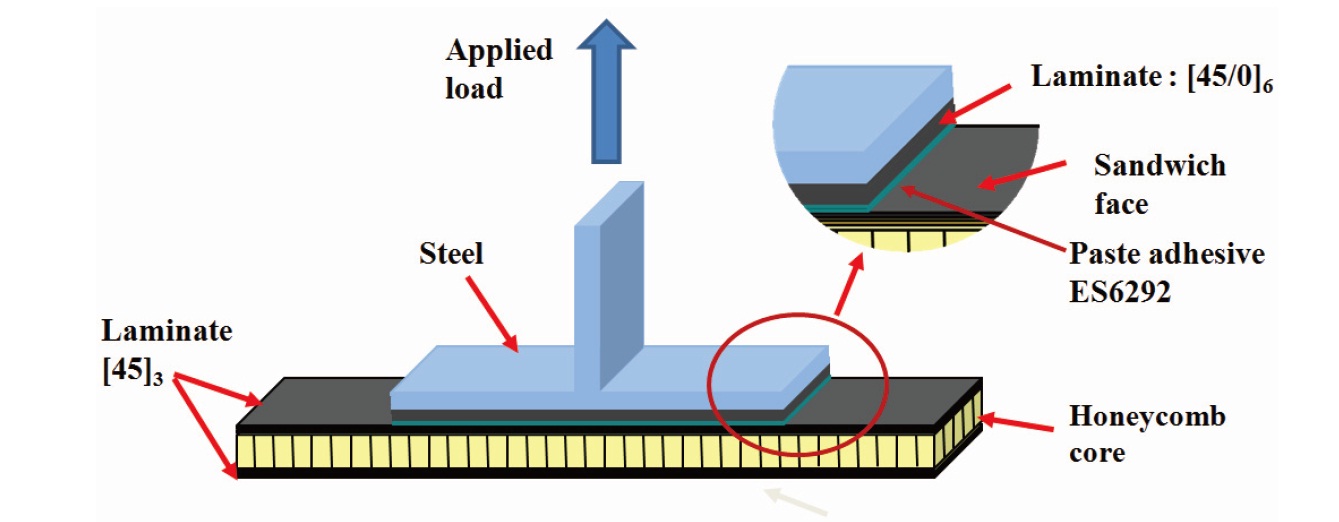
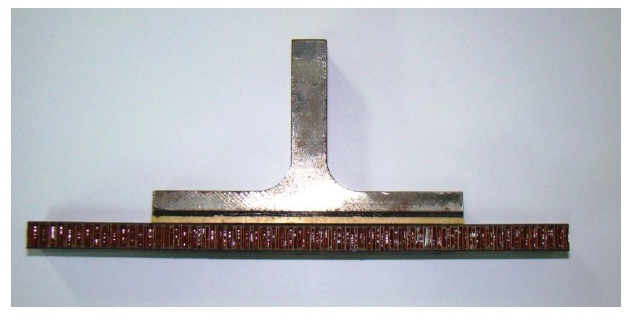
A schematic drawing of a T-joint is shown in Fig. 1. The honeycomb sandwich panel had dimensions of 208 mm
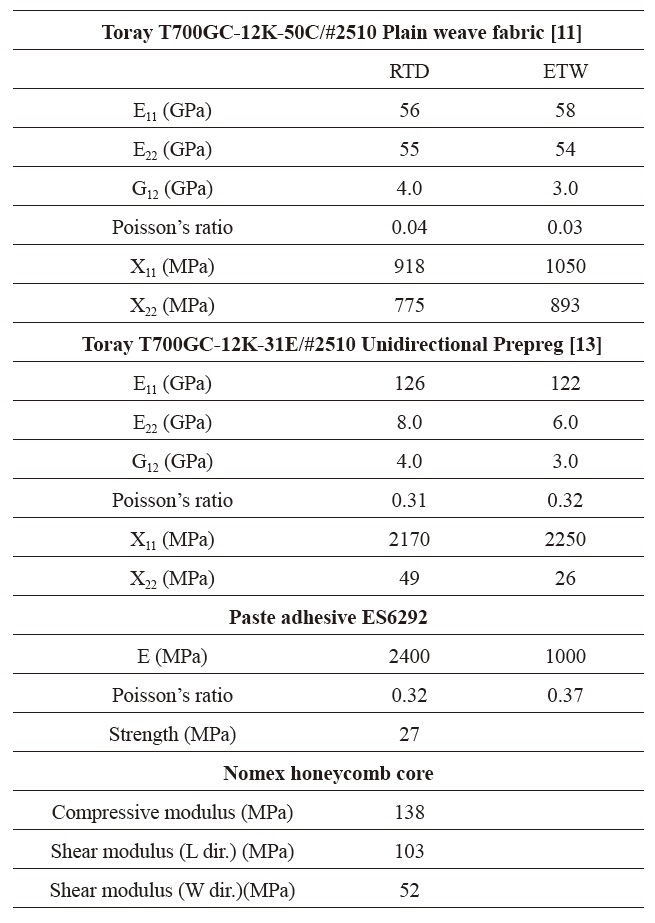
[Table 1.] Material properties

Material properties
(length) by 25.4 mm (width). As a part of the joint, a composite laminate was attached to a sandwich structure using a pastetype adhesive, ES6292 from PTM& W. Adhesive thickness was the main parameter in this study. Three adhesive thicknesses of 0.4, 2.0, and 4.0 mm were considered in manufacturing. On the opposite face, the composite laminate was attached to a T-shape steel part using a film adhesive, EA9696 from Hysol®. Similarly, the core and the faces of the sandwich panels were attached using the same film-type adhesive.
A carbon/epoxy fabric pregreg from Toray America (T700SC-12KC/# 2510) was used to manufacture the composite parts. The composite laminates attached to the steel part had a stacking sequence of [45/0]6. Both faces regarding the sandwich panels had an identical stacking sequence of [45]3. The material properties of the constituents are given in Table 1.
First, the composite laminates were laid-up and cured in an autoclave according to the curing cycle recommended by the supplier. Then, the T-shape steel part was bonded with the laminate. In another process, the core and faces were attached using the EA9696 adhesive and cured together in a co-curing process to make a sandwich. Finally, the two parts were attached using the ES6292 paste adhesive and cured at room temperature. A steel mold was designed and used to guarantee the thickness and uniformity of the adhesive after curing. A typical specimen is shown in Fig. 2.
A total of 26 specimens were manufactured and tested in two environmental conditions, as shown in Table 2.
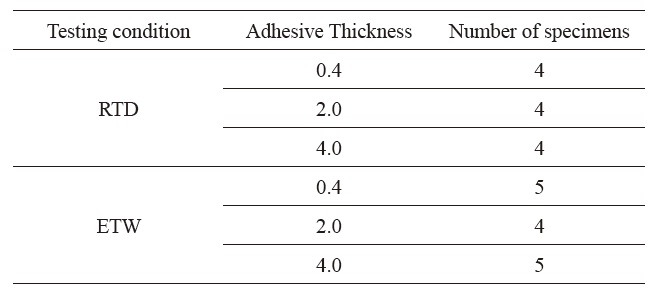
Test matrix
2.2. Environmental conditions and testing
Two environmental conditions were considered in this study. The first one is the room temperature dry condition (RTD) and the second is the elevated temperature wet condition (ETW). In the case for the RTD condition, the T-joint was dried in an oven after manufacturing and then tested under room temperature. In the case of the ETW condition, the specimens were stored in a chamber with a humidity of 85% and a temperature of 71℃ until saturation was reached [11]. The saturation criterion was that the moisture content changed by less than 0.05% in two consecutive readings within a span of 7 days.
Specimens were tested under pull-off loading. An Instron machine was used to apply loading by pulling the T-shape steel part upward. A testing tool was designed to constrain the specimens against the pull-off load, as shown in Fig. 3.
In the case of the ETW condition, specimens were tested in a chamber of 71℃ .
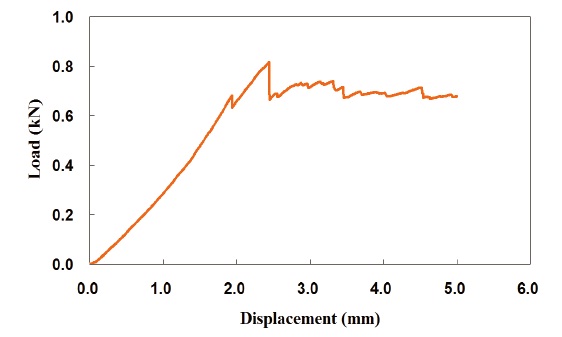
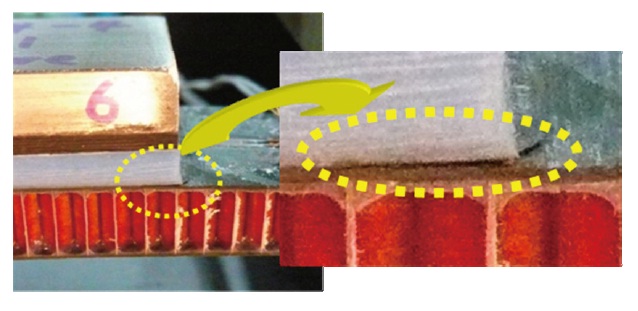
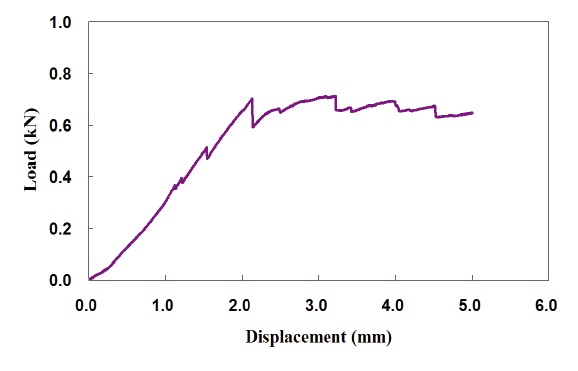
A typical load and displacement curve of the joint with 2.0 mm adhesive thickness is shown in Fig. 4. As shown in the figure, the curve is almost linear up to the initial failure, which corresponds to the small peak. Beyond the initial failure, the curve reduces its slope, implying that the structural stiffness was reduced and failure was propagating. The initial failure was observed in the first layer of the sandwich face as a visual crack at the region closed to the end of adhesive, as shown in
Fig. 5. It is obvious that this region experienced a high stress concentration due to geometrical discontinuity.
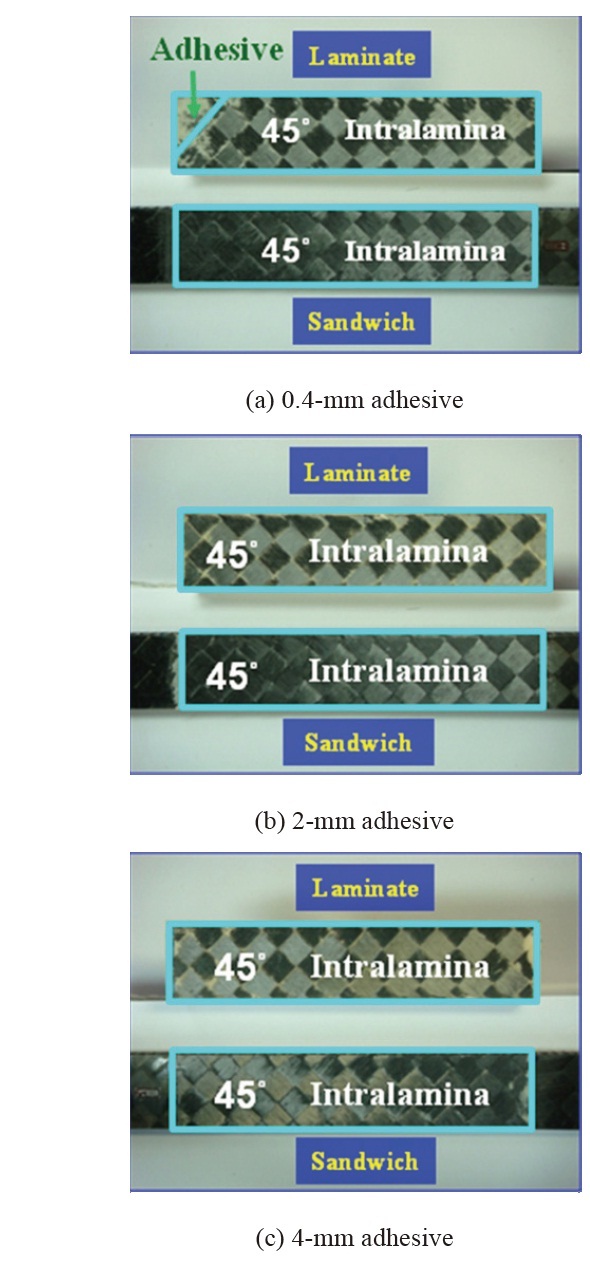
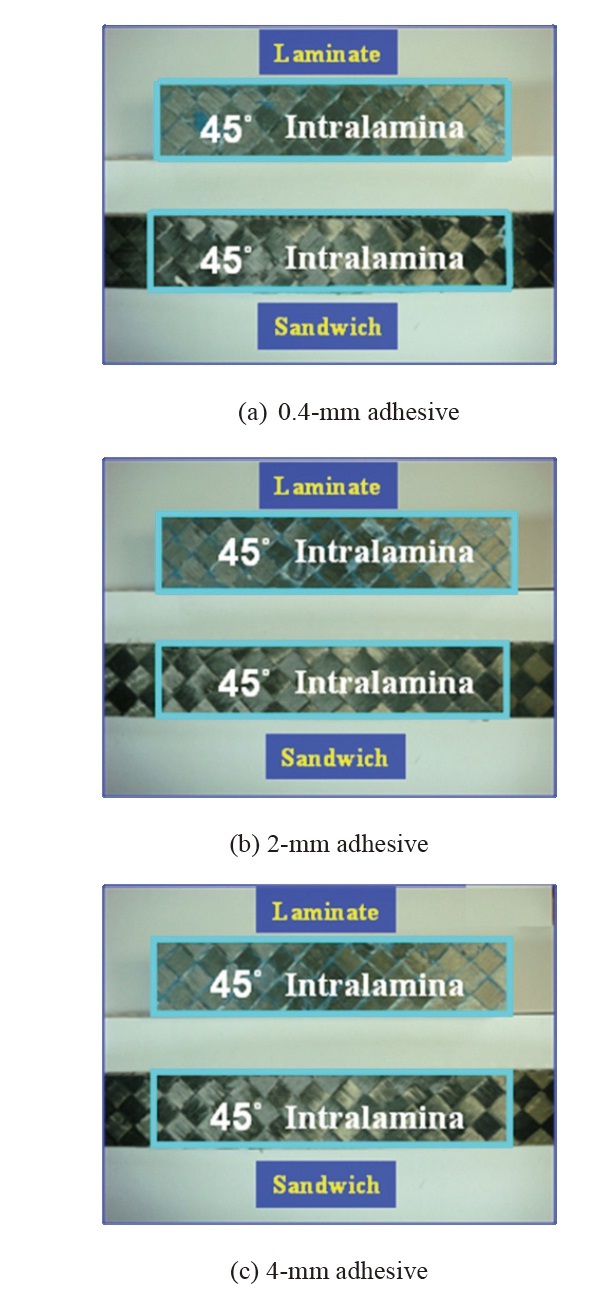
The failure surfaces of the joints with different adhesive thicknesses are given in Fig. 6. As shown in the figure, the major failure mode involved the intralaminar failure in the first (outermost) layer of the sandwich face.
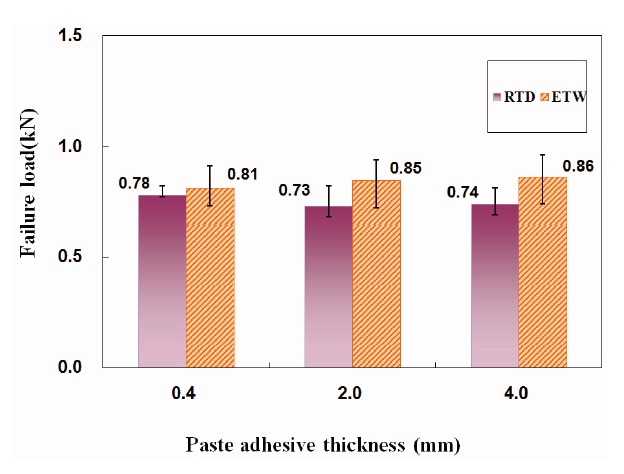
A summary of failure loads is given in Fig.7. As shown in the figure, the failure loads of the joints do not significantly vary as a result in the change of adhesive thickness. Looking into the details, however, the failure load of the joint with a 0.4 mm adhesive thickness is the largest under the RTD condition. Considering data scattering, the failure loads in RTD do not exhibit any remarkable trend due to adhesive thickness. This does not match the finite element result, which will be discussed later in this paper. The finite element results will show that the stress in the composite layer should decrease as the adhesive thickness increases. The failure loads follows the trend in ETW, but not in RTD. We believe the failure load trend in RTD is attributed to the specimen quality and should be re-examined.
A load-displacement curve within the ETW condition is shown in Fig. 8. As shown in the figure, the failure load,
denoted by the large drop of the curve, occurred after several small drops of loading. The failure modes were dominated by the intralaminar failure of the first fabric layer of the sandwich face, as shown in Fig. 9. It was interesting that the failure loads of the joints in the ETW condition were higher than those in the RTD condition.
Obviously, the environmental condition (ETW) leads to a reduction of properties regarding the adhesive, as shown in Table 1. This carbon/epoxy fabric, in contrast, slightly increases the in-plane stiffness and strength when it is exposed to the ETW condition, as shown in Table 1.
This phenomenon is related to the material characteristics. As discussed earlier, the dominant failure mode was the intralamina failure of the composite fabric. Therefore, this means that even though the adhesive was degraded due to environmental effects, the failure mode is mainly determined by the composite material. There is no out-ofplane property data available for the Toray fabric. However, the trend within the in-plane properties implied that the outof- plane properties might also increase in the ETW condition because the out-of-plane properties within a fabric layer are significantly affected by the fibers. That explains why the failure load of the joint increased slightly in the ETW conditions despite the weakened adhesive.
In regards to the ETW tests, increasing adhesive thickness led to a slight increase in failure load as well. However, the failure loads were not linearly proportional to the adhesive thickness. Even when the thickness was increased 10 times from 0.4 mm to 4.0 mm, the failure load just slightly increased (from 0.81 kN to 0.86 kN). The failure modes were the same as those in the tests for the RTD condition.
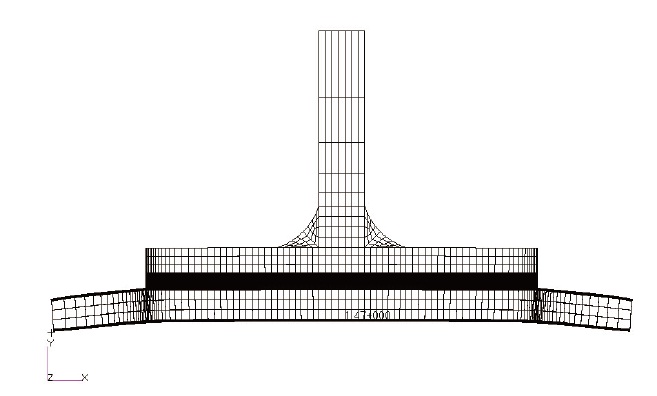
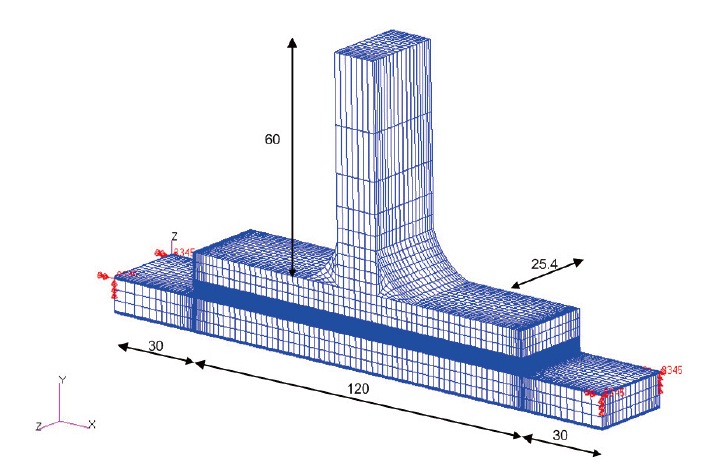
A finite element analysis was conducted in order to gain a better understanding of the T-joint behavior. A three
dimensional finite element model was built and analyzed using MSC.MARC, as shown in Fig. 10.
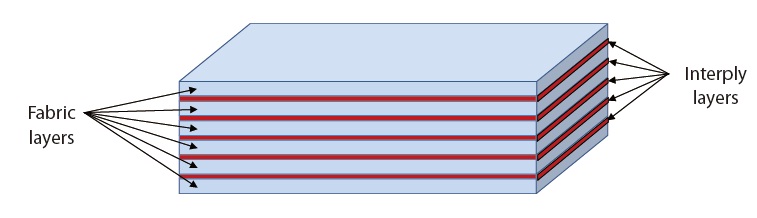
An orthotropic elastic material model was applied to model the composite fabric layer. Laminated composites were modeled as a combination of fabric layers and interply layers. In order to simulate the delamination, which usually occurs in laminated composite, an interply resin-rich layer was assumed between each of the two adjacent layers, as shown in Fig. 11. The resin-rich layer exists in real laminated panels [12]. The interply resin thickness is relatively small compared to the layer thickness. In this study, the thickness of the interply layer was assumed to be 10% of the layer thickness [12].
The mechanical properties of the resin-rich layer were assumed to be equivalent to the matrix properties of the unidirectional prepreg with the same fiber from the same company. The only difference between the two types of prepreg is the fiber pattern (unidirectional and fabric). The
stiffness of the interplay layer, therefore, is assumed to be 8 GPa in regards to the RTD condition and 6 GPa in regards to the ETW condition.
The test results showed that failure occurred within a fabric layer right next to the paste adhesive. Therefore, the composite layers were modeled in finer mesh compared to the other layers. Three elements through the thickness of a ply were used.
A honeycomb core can be modeled by two methods: mesoscale and macro-scale modeling. In the former method, the core is replaced by an equivalent material and modeled using solid elements. The latter method models the core with detailed geometry using shell elements. The macro-scale modeling method has the advantage of saving modeling and
solving time compared to meso-scale method and, therefore, was adopted for the sandwich structure modeling in this study. In this study, the interface between the face and cores in a sandwich panel is assumed to be perfectly bonded. The same assumption was adopted for the bonding between the T-shape steel part and the laminated plate. The assumption is validated because there was no macro failure observed in these adhesive layers.
A pull-off load of 0.78 kN was applied to the T-shape steel part. It was the failure load of the 0.4 mm adhesive joint in the RTD condition and was applied to all T-joint models in order to compare the behavior of different joints under the same magnitude of load.
3.2. Finite element analysis results
The same pull-off load of 0.78 kN was applied to the model with different adhesive thicknesses. Fig. 12 shows the typical deformed shape of the joint under loading.
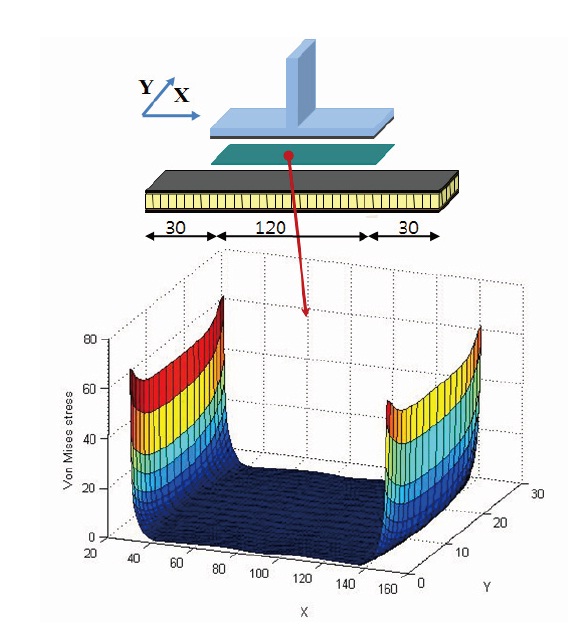
One of the parts raising concern is the adhesive. The Von
Mises stress distribution at the midplane of the adhesive is shown in Fig. 13. As shown in the figure, the stress at the two edges for the adhesive is higher than that in the inner area. The maximum Von Mises stress in the adhesive (60 MPa as in Fig. 13) was larger than its ultimate strength (27 MPa from Table 1). In reality, the stress can be reduced at the edge due to adhesive plasticity or the existence of spew fillets. However, the current model did not consider the plasticity of the adhesive or the spew fillets, and therefore, stress might be over-evaluated compared to the actual values. The Von Mises stress was quite uniform along the width (Y) direction.
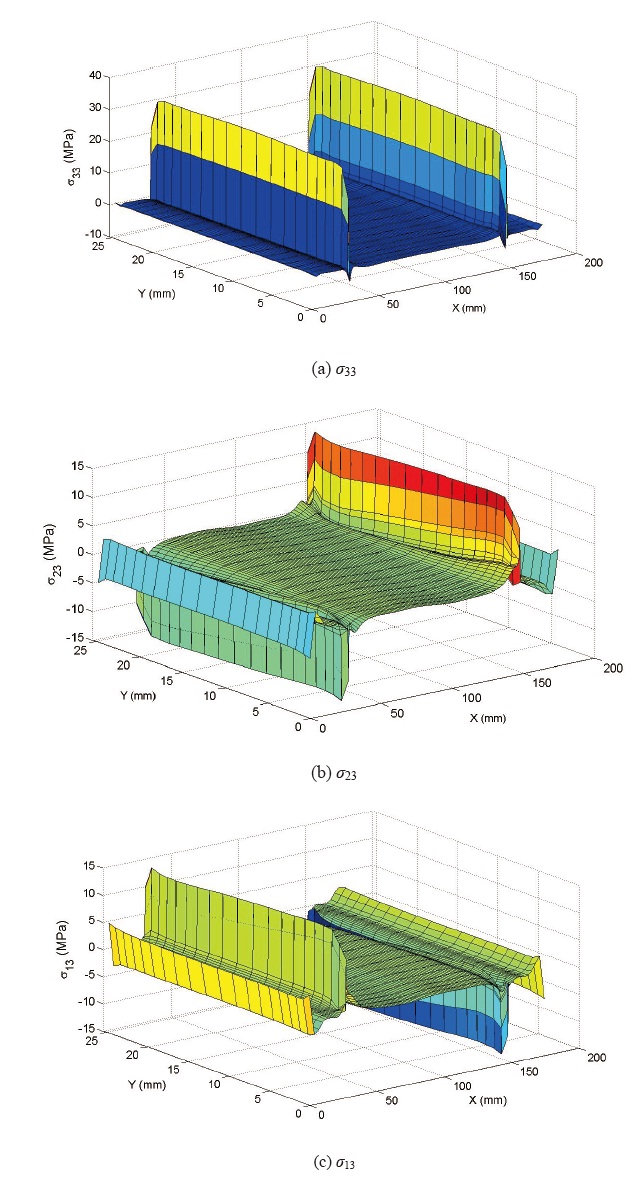
It was shown in the test that failure mostly occurred in the first ply of the sandwich upper face. Therefore, the stress distribution in the first ply is important and must be thoroughly examined. The major failure mode of the joints was the intralaminar failure, which was dominated by the transverse stresses in the thickness directions. Therefore, our concern focused on the out-of-plane stress components, as shown in Fig. 14. In the figure, σ33, σ23, and σ13 are transverse normal and shear stresses in the principal material direction. As shown in the figure, all out-of-plane stress components are concentrated in the regions closest to the ends of the adhesive layer. In other regions, the stresses are almost zero. The stress distribution implies that these areas have a high possibility of failure. It is consistent with the test results that initial failures occurred at the location right next to the ends of the adhesive layers during the test (Fig. 5).
Similarly as in the adhesive, the out-of-plan stresses, σ33, σ23, and σ13, in the composite layer are quite uniform along the width direction. Due to pull-off loading, σ33 has positive values. The transverse normal stress σ33 is definitely the largest among the three out-of-plane stresses, and therefore, it plays the main role in causing the failure. Therefore, to consider the effect of adhesive thickness on the failure load, we should investigate the σ33 distribution in the first fabric layer of the sandwich upper face.
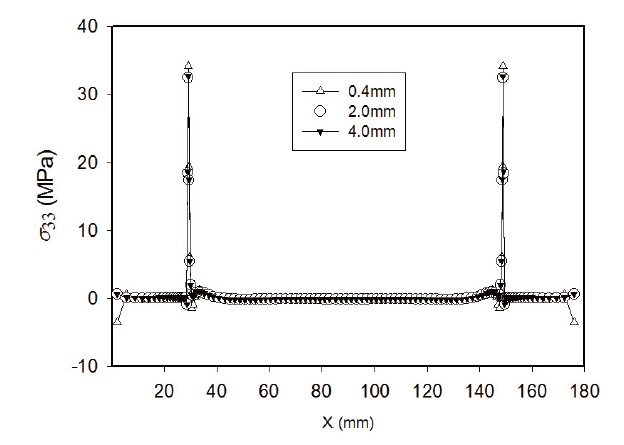
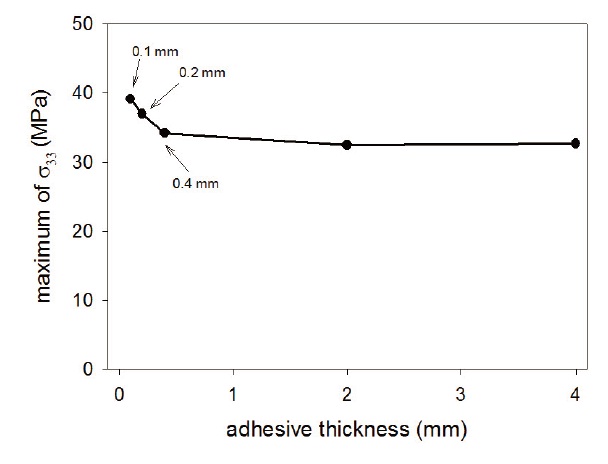
The σ33 is quite uniform along the width direction and shows the same phenomenon in any section. Fig. 15 shows the σ33 along the center line (at Y = joint width/2) of the joints with three different adhesive thicknesses. From the stress distribution, we see that the increase of adhesive thickness results in a reduction of σ33 inside the composite fabric layer. Therefore, the thicker adhesive may lead to an increase of the failure load of the T-joint. Using the developed finite element modeling technique, several joints with different thicknesses of adhesive were additionally investigated, and the maximum values of σ33 are shown in Fig. 16. As shown in Fig. 16, the maximum stress decreases and converges to a specific value when adhesive thickness increases from 0.1 mm to 4 mm. Stress is almost constant after an adhesive thickness of 2mm. The result implies that increases of adhesive thickness larger than 2 mm do not provide a higher failure load. This is consistent with the test results in the ETW condition.
The study investigated the failure behavior of composite bonded T-joints in different environmental conditions (RTD and ETW). The test results demonstrated that the failure loads in the ETW condition increased compared to those in the RTD cases while adhesive properties decreased in the ETW condition. In the test results, there was no remarkable trend between the failure load and adhesive. Even though the failure load slightly increased along with the adhesive thickness in the ETW conditions, the difference was no more than 6% . Failure modes were dominated by the intralaminar failure of the first fabric layer for the sandwich faces right next to the adhesive.
Finite element analysis was performed to investigate the stress inside the T-joint. In the first layer of the sandwich face, high out-of-plane stress was observed at the region adjacent to ends of the adhesive. This finding is consistent with the fact that the initial failure occurred at these positions in the experiment. The increase of adhesive thickness results in a reduction of stress inside the composite fabric layer and, therefore, leads to an increase of failure load.