Fiber reinforced polymer matrix composite materials are used in a wide variety of applications from automotive to aerospace to defense [1,2]. High-stiffness and high-strength materials such as aramid (e.g. Kevlar, Twaron), glass (e.g. S2 glass), and ultra-high molecular weight polyethylene or UHMWPE (e.g. Spectra, Dyneema) are widely used as structural reinforcements to provide protection against high energy threats during ballistic impact and blast events. While the properties of the constituent fibers and matrix in a textile composite have been well characterized in the literature; the behavior of the fiber-matrix interface or sizing remains largely unknown. The ballistic impact performance of a composite can be largely influenced through a strategic tailoring of the interface. Ensuring the integrity of the fibermatrix bond is important to maintain structural integrity and improve load sharing between the fibers and the matrix. However the debonding of the fiber-matrix interface as well as the post-debond frictional sliding are important energy dissipating mechanisms that can be suitably tailored to improve the overall impact performance of the composite.
The interface bond strength is largely influenced by the surface treatments applied to the fiber during spinning and weaving. Sizing is a protective coating applied to the fiber surface to improve the handling of the fibers during processing and also to promote adhesion between the fiber and the matrix [1,3,4]. The sizing comprises of several components of which the film former and the coupling agent are of primary interest. The function of the film former is to provide protection to the fiber while the coupling agent provides the fiber-matrix bond strength. An interface forms when the sizing reacts with the fiber and the matrix during processing and consolidation. While we generally refer to the existence of an interface, it should be noted that the fiber-sizing region is sometimes referred to as the ‘interface’ while the sizing-matrix region is referred to as the ‘interphase’ because of the chemical reactions that occur between the sizing and the resin during consolidation and curing. The importance of sizing especially for glass fibers is described by Thomason and Adzima [5]. They showed that for E-glass fibers sized with a combination of 3-amino-propyltriehoxysilane (APS) and polyurethane (PU), the tensile strength of the composite is dependent on the APS level. Furthermore an optimum silane level exists for this particular mechanical property. Zhang et al. [6] demonstrated that the introduction of graphene oxide (GO) sheets in carbon fiber sizings enhanced both the IFSS and interlaminar shear strength (ILSS). Modifying the fiber sizing with GO also resulted in a higher tensile strength and tensile modulus of the carbon fiber composite. It is clear that the modification of the sizing plays an important role in the interfacial properties, further affecting the performance of the composite structure.
Subramanian et al. [7] experimentally studied the effect of different fiber sizings and surface treatment on the mechanical properties of unidirectional composites. They attribute the observed differences in the properties due to the changes in the interface bond strength. The IFSS determined for different fiber sizings for glass fiber-epoxy systems agreed well with the macroscopic composite properties through transverse tensile and compression shear tests [8] . The adhesion strength between glass fibers and a polypropylene matrix was found to be largely influenced by both the sizing and the conditions and manner in which it was applied, as shown by Zhuang et al. [9]. Several other researchers have alluded to the large influence of fiber-matrix interface strength on the mechanical properties of a textile composite [10-17].
Characterizing and tailoring the fiber-matrix interface is a challenging problem that involves understanding the complex chemical reactions between the components of the fiber sizing and the matrix during the curing process. Several micromechanical interfacial test methods have been developed to understand and quantify the interface bond strength.
Microbond testing developed by Miller et al. [18] in 1987 is one of the widely used single fiber-matrix interfacial bond test methods to determine the IFSS [19]. Single fiber pullout, single fiber push out, and single fiber fragmentation are other variations of the interfacial test methods [20-25]. The traditional pullout and fragmentation tests suffer from difficulty in specimen preparation [19,26]. The microbond test procedure has been used by various researchers to study different fiber-matrix interface systems that include glass fiber-epoxy [27], glass fiber-polyamide [28], glass fiberpolycarbonate, glass fiber-polypropylene [29], and carbon nanotube fibers-epoxy [30]. The lack of a standard procedure for the microbond test method more than two decades since its inception suggests the complexity of the nature of the problem. This review paper outlines the different parameters that influence the outcome of the microbond test, the various data reduction schemes employed, and various numerical approaches used to model the microbond experiment.
2. Experimental Setup and Factors Influencing the Microbond Test
This section outlines the microbond experimental procedure and the various parameters involved. One of the limitations of this test method is the large scatter in the recorded data as has been reported by many researchers [18,31,32]. Some of the potential sources of this data scatter are discussed later.
2.1 Experimental Procedure Overview
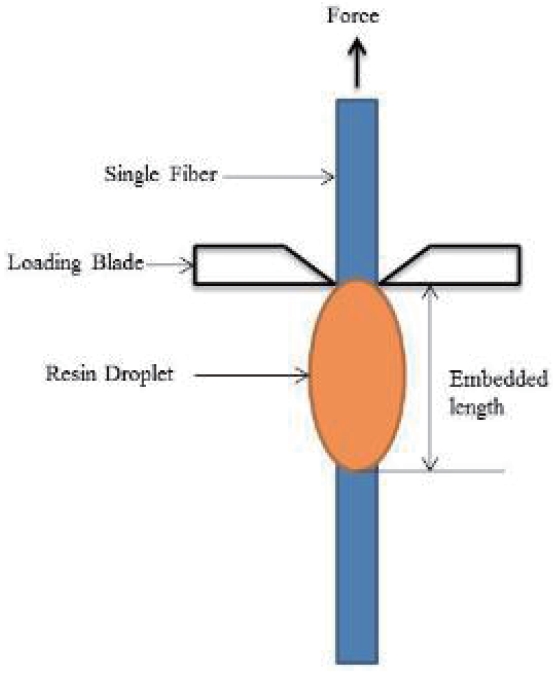
The microbond experimental test method developed by Miller et al. [18] consists of first applying a resin drop onto the surface of a single fiber, curing the fiber-resin system to form the droplet, and then applying a shearing force to pull the fiber out of the droplet or vice-versa. A schematic of the test set up is shown in Figure 1.
The fiber diameter and the embedded length are measured with an optical microscope to compute the embedded area, which is the surface area of the fiber in contact with the resin. The top end of the fiber is attached to a load cell. A constant velocity is applied to the loading blade (or knife or microvise) which in turn exerts a shearing force on the droplet as it moves downwards. The applied load and the blade displacement are recorded. The tip of the loading blade is adjusted such that it just contacts the fiber before it moves downward. Sometimes a small gap is also left between the blade tip and the fiber surface. The peak load at which the complete debonding of the interface occurs is used to compute the IFSS of the interface using Equation 1 assuming that the interface is in a uniform state of shear stress.
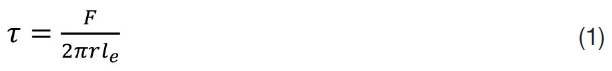
where
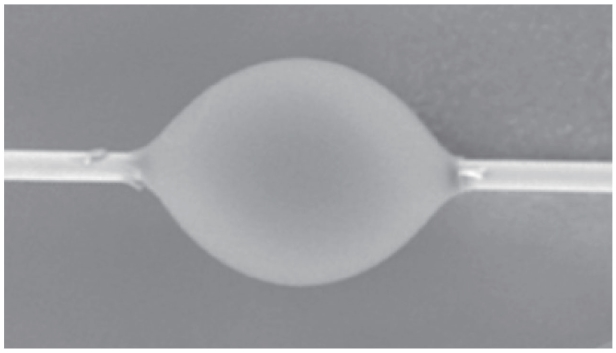
The sample preparation methodology depends on the type of fiber-matrix system, for instance, thermoset versus a thermoplastic resin. Refs. [30,33] respectively report on the sample preparation for a carbon nanotube-epoxy system and a carbon fiber-epoxy system. In the case of a thermoset resin which is initially liquid at room temperature, the sample preparation involves mixing the resin and hardener together with a certain stoichiometric ratio, extracting a single fiber carefully from a fiber bundle or tow, and then applying the resin mixture on the fiber surface [33,34]. Gao [34] used a carbon fiber to apply the resin drop on the fiber surface while Liu et al. [35] used a needle syringe. A typical ellipsoidal shaped droplet formed on the fiber is shown in Figure 2. Ref. [36] reports an embedded length range of 90-200 μm for a 20 μm diameter E-glass fiber-phenolic resin system. Ref. [29] reports on the sample preparation for a thermoplastic resin system which is initially solid at room temperature. This is further discussed in Section 2.3. Ideally the droplet should be symmetrical in shape about the fiber axis in order to simultaneously contact the two loading blades and result in an even loading of the interface.
The temperature-time cure cycle used during the curing of the resin controls not only the final composition and mechanical properties of the resin, but also the properties of the interface. The coefficient of thermal expansion of the resin is usually orders of magnitude larger than that of the fiber. Consequently, the volumetric shrinkage of the resin during curing as it cools down to room temperature results in a net residual compressive stress exerted on the fiber. Obviously the larger the compressive stress, the larger the IFSS. Different researchers have reported different cure cycles for various fiber-resin systems. For example, Kang et al. [33] cured their carbon fiber-epoxy resin specimen in an autoclave at 120℃ for 6 hours.
For a thermoplastic resin which has a high viscosity the deposition of the matrix onto the fiber is usually done at a high temperature [37]. For example, a polypropylene fiber is placed on a suspended glass fiber using soldering iron heat and subjected to a temperature of 220℃ in an oven for 4 min to form the thermoplastic matrix droplets [29]. Thomason and Yang [38] investigated the temperature dependence of the IFSS of a glass fiber-polypropylene system by conducting the microbond test under a controlled temperature in a Thermomechanical Analyser (TMA). They observed that IFSS decreased with increase in the testing temperature for a range of -40 ℃ to 100 ℃. They attributed this to the higher residual radial compressive stress at lower testing temperatures and concluded that the IFSS is strongly influenced by the testing temperature.
One of the challenges associated with the microbond test is to pull out the fiber from the droplet without breaking the fiber. This requires control over the embedded length. For a fiber with a smaller diameter and low er breaking strength, if the force required to pull the fiber out i.e. the force required to shear the interface is larger than the fiber tensile strength, then fiber breakage occurs before the interface can debond. For a successful pullout test without fiber breakage, the critical embedded length is given by Refs. [18,37] based on the following equation
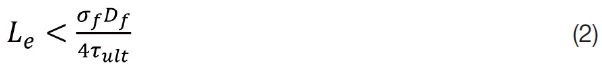
where
Kang et al. [33] noted that the peak debond force increased with an increase in the embedded length up to 120 μm, beyond which the fiber fractured. They reported this value as the critical embedded length for their carbon fiber-epoxy system. Zu et al. [30] studied the probability of tensile failure of the fiber as a function of the embedded and free fiber length and then provided guidelines for selecting appropriate lengths that would result in a successful microbond experiment without fiber breakage. Gao et al. [39] used a boron fiber-epoxy specimen to calibrate the machine compliance and subtracted the machine deformation from the displacements recorded during the experiment. They used a free fiber length of 0.8 mm in order to minimize fiber breakage.
Miller et al. [32] investigated the sources of data scatter during the microbond experiment. They highlighted the importance of the accuracy of the instrumentation used to measure the loads and displacements, which are of the order to of milligrams and micrometers respectively. Using a force reading every 20 ms they reported that the measurement of the peak force does not require a very high data collection rate unless the rate of interface loading is high. They used instrumentation with improved accuracy that could measure fiber diameters of 10 μm within +/- 0.05 μm to eliminate experimental error in diameter measurements. However this assumes that the inherent variability of fiber diameters is larger than the accuracy of the machine. It is known that there is variability in fiber diameters both from one fiber to another as well as along the length of a given fiber, which represents a potential source of data scatter. Their microscopic and wettability perimeter measurements revealed that carbon fibers have a twisted ribbon like cross section rather than a circular one. They also concluded that the primary reason for bond strength variability is due to the inherent non-uniformity of the fiber surfaces.
2.6 Microvise Separation Distance
Franco and Drzal [40] showed that small differences in the microvise support separation distance results in large differences in the magnitude and location of the peak shear stress along the interface. Miller et al. [32] showed that the position of the loading blades can significantly influence the results and could overestimate the bond strength for larger separation distances. Using a finite element (FE) analysis, it was shown that the data scatter observed in the
Chou et al. [45] conducted experiments on a Kevlar 49- Epon 828 system for different blade widths and concluded that the IFSS was progressively overestimated with increasing gap widths. Kang et al. [33] maintained a gap of 20 μm between the loading blades in order to avoid fiber breakage, for a fiber diameter of 7.5 μm. Day and Rodriguez [46] also indicate that the interfacial shear stress is not constant along the interface and is strongly affected by the position of the loading knife. They used Raman spectroscopy to measure the strain distribution along the fiber.
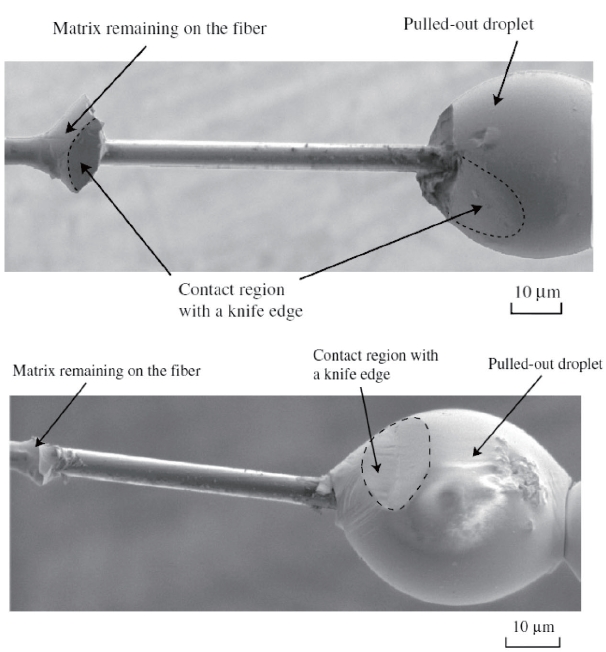
The matrix cracking in the droplet as a function of the knife edge position and its influence on the interfacial fracture is discussed in Ref. [44]. Figure 3 displays scanning electron microscopy (SEM) images of a post-tested carbon fiber-epoxy microbond specimen for knife edge positions that are both close to and far away from the fiber surface. They indicated that when the matrix cracking occurs for the knife edge position near the fiber, then the pull-out is not considered to be a case of pure interfacial debonding as the extent of the matrix cracking is not negligible compared to the fiber embedded length as shown in Figure 3 (top). However when the knife edge is far away from the fiber, then the extent of matrix cracking is small as shown in Figure 3 (bottom) and the test is considered to be a case of pure debonding. Using finite element simulations, they concluded that when the knife edge position is approximately two fiber diameters away from the interface, the resulting fiber pull out occurs without major matrix cracking.
Some researchers [31,47] observed plastic flow deformation of the cured resin droplet during the microbond experiment and questioned the applicability of an elastic analysis of the fiber-matrix interface system. They recommended using the J-integral approach [48] to account for the energy dissipated due to the plastic deformation. They also reported that the microbond test provides mixedmode properties (i.e. along with mode I) of the interface as opposed to pure mode II properties because residual radial tensile stresses exist at the fiber ends that arise from the processing [49]. Ash et al. [50] also allude to the yielding of the resin near the contact zone of the loading blade.
Hampe et al. [51] developed an advanced pull-out device with high stiffness to achieve stable crack propagation with short free fiber lengths. For brittle interface failure, they noted that the point of crack initiation can be identified by a change in the slope of the recorded force-displacement curve. For a glass fiber and amorphous polyethylene terephthalate (PET) system, the point of crack initiation is not identifiable because of the ductile nature of the fracture. Hampe and Marotzke [28] conducted experiments with a stiff testing device to produce stable crack propagation and observed the crack propagation using a polarization microscope. They demonstrated that a compliant system with long free fiber lengths hides the crack initiation point. However for a brittle interface, a change in slope is observed in the pull-out trace indicating crack initiation. They further observed the force at which the crack initiates is independent of the embedded length for the glass fiber-polyamide system tested. A direct calculation of an average energy release rate using the observed crack length is also presented in their work. Zhandarov et al. [52] observed the crack growth for E-glass fibers using both thermoplastic and thermosetting resin systems and constructed crack resistance R-curves depicting the variation of the energy release rate with respect to the crack length. Miller et al. [32] observed catastrophic bond failure for all systems they tested, with an instantaneous release of the entire fiber-matrix interface.
Miller et al. [18] used a cross head speed of 1 mm/min for glass fiber-epoxy systems for embedded lengths ranging from 60-179 μm. However for a brittle carbon fiber-epoxy system with smaller embedded lengths they used a speed 0.2 mm/min to avoid fiber breakage. Gao [27] used a cross head speed of 0.001 mm/s for a glass fiber-epoxy system with droplet diameters in the range of 150-200 μm. Zu et al. used a test speed 0.003 mm/s for a carbon nanotube-epoxy system with embedded lengths ranging from 50-200 μm. Zhandarov et al. [52] used a slowest possible speed of 0.25 μm/s for their E-glass fiber-polymer matrix systems to ensure slow crack propagation. Their free fiber length range was 0.2-2 mm. Morlin and Czigany [53] investigated the effect of test speed on the measured IFSS using a newly developed method to generate cylindrical droplets. The material system is glass fiber-polyester resin with embedded lengths between 120 and 300 μm. They noticed that the IFSS became a constant value for speeds greater than 10 mm/min. Further, they did not observe any frictional sliding force at high speeds which is attributed to the radial contraction of the fiber due to the Poisson effect.
2.10 Variations and Recent Advances ? Reproducibility of Sample Preparation and Experiment
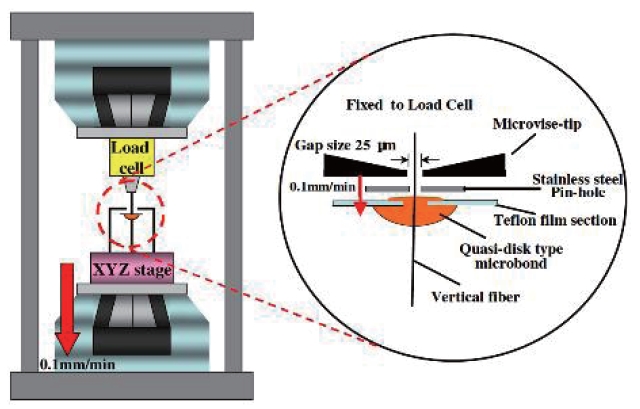
Liu et al. [35] investigated the IFSS of a polyamide fiber and aqueous polyurethane resulting in a disc shaped droplet using a pin hole. Based on their axisymmetric finite element studies they concluded that the stress distributions obtained with disc shaped and elliptical shaped droplets agree with each other. In an attempt to improve the accuracy and reproducibility of the microbond test, Morlin and Czigany [53] developed a new method to produce a cylindrical droplet. The shear strength measured with this new cylindrical shaped droplet was higher than that obtained by the usual sample preparation method, along with a reduction in data scatter. A quasi-disk type microbond specimen for a carbon fiber-epoxy resin developed by Choi et al. [54,55] was shown to have a lower standard deviation in IFSS compared to the droplet (ellipsoid) type specimens. The loading of the quasi-disk droplet is achieved by the microvise tips and a steel section as shown in Figure 4.
Hou and Sun [26] presented a new specimen preparation method to control the droplet size and shape in an attempt to improve the reliability and reproducibility of the experiment. Their method involves drawing the carbon fiber at a certain velocity in a polymer solution, which is a mixture of epoxy resin E-44 and diethylenetriamine using acetone to control
the viscosity. This results in the formation of a series of droplets along the fiber due to Rayleigh instability. SEM images showed that the resulting droplets were symmetric. They concluded that the droplet shape and size can be controlled by the drawing velocity and concentration of the resin solution.
3. Experimental Data Reduction and Interpretation
Data reduction and interpretation during the microbond test is challenging because of the several factors. These include the experimental data scatter, inability to always discern changes in the slopes of the recorded load-displacement plots, and extraction of the free fiber deformation and machine compliance from the recorded displacement. A common approach used by many researchers [36,56-58] to assess the fiber-matrix interface strength is based on using Equation 1 which is an average shear stress along the interface during failure. A higher debonding force is observed for longer embedded lengths and a linear relationship between debonding load and embedded interfacial area is reported by researchers [18,36,38].
3.1 Deformation, Energy Dissipating, and Failure Mechanisms during the Microbond Test
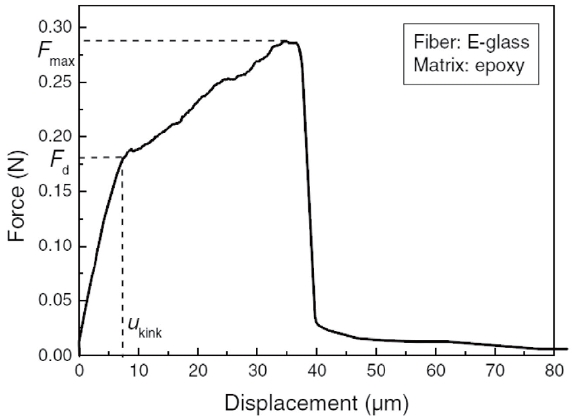
Figure 5 displays a typical force-displacement plot during the microbond test. The four different stages that are observed in an interfacial debonding experiment are as follows [51,59- 61]: (Stage I) linear load-displacement relationship up to the initiation of debonding, (Stage II) stable crack propagation with friction between the crack faces, (Stage III) unstable crack growth with a sudden drop in the load, and (Stage IV) frictional sliding after complete debonding of the interface.
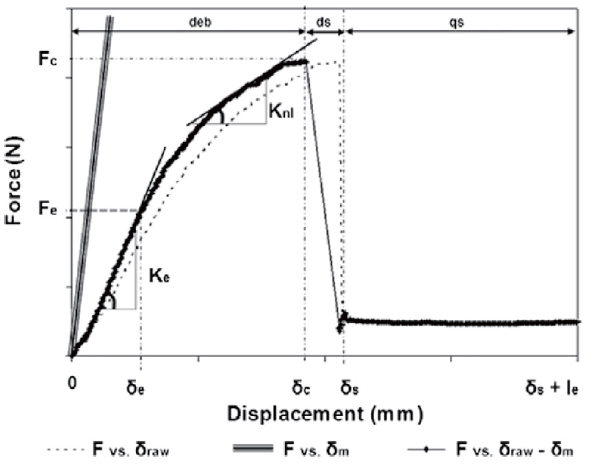
Hampe and Marotzke [28] in their pull out tests observed the initiation of crack propagation indicated by a change in the slope of the force-displacement curve for the E-glass polyamide and E-glass polycarbonate systems. However Zinck et al. [47] remarked that they did not observe any changes in the slopes of the force-displacement plots for their tested glass fiber-epoxyde specimens. Gao et al. [39] developed an energy analysis technique to quantify the energy absorbed due to the different mechanisms observed during the microbond test. They partitioned the energy absorbed due to debonding (deb), dynamic sliding (ds) and quasi-static (qs) sliding as shown in Figure 6. They reported an increase in the energy absorption without sacrificing the IFSS by creating a texture on the fiber surface using silane blends that effectively increased the fiber surface roughness.
A shear-lag analysis is typically used to study the transfer of stresses from the fiber to the matrix [49,62-64] with the assumption that the changes in the fiber axial load are due to the shear stresses at the interface given by the following equation.
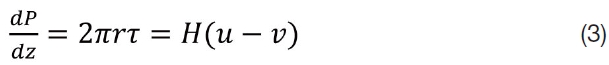
where
Singletary et al. [66] conducted a FE analysis of the fiber pullout test to examine the validity of the shear-lag assumptions and showed that the axial stress gradients, and radial and hoop stresses in the matrix cannot be neglected. After studying various material systems including glass and carbon fiber reinforced plastics they concluded that for fiber pullout and debonding processes, a shear lag model is not suitable for deriving energy release rates for crack propagation.
Scheer and Nairn [49] conducted a variational mechanics analysis and shear-lag analysis including the effect of residual thermal stresses. They also indicated that the shear stress along the interface is not uniform and the average shear stress model is not realistic. They presented a combined shear-lag and fracture mechanics method for predicting the energy release rate for crack initiation at the interface. The following equation was proposed to analyze the interfacial failure.
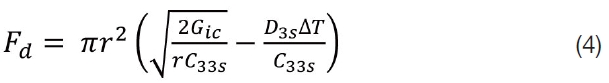
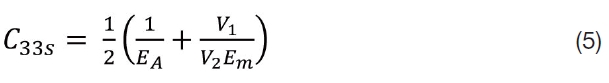
where
Zhandarov et al. [67] used a shear-lag approach to investigate whether the failure of the interface is energy based or stress based. The relationship between debond force and embedded length was well captured with both energy and stress based criteria for different fiber-matrix systems. They also estimated the size of the debonding process zone as the ratio of the initiation energy to the ultimate shear strength. Zhandarov et al. [60] derived a stress-based debonding criterion and a fracture mechanics based critical energy release rate for crack propagation utilizing idealized models with a cylindrical matrix. The force-displacement plots derived from the models agreed well with the experimental data.
4. Numerical Modeling of the Microbond Test
In this section, the various numerical modeling approaches used to simulate the microbond test are summarized with a focus on the finite element method. In addition, analytical and numerical studies were done to study the shape of the resin droplet on a single fiber using Legendre elliptical functions [68], numerical algorithms [69,70], and the method of free energy variation [71]. These methods were particularly focused on determining the shape and contact angle of the droplet on the fiber.
Ash et al. [50] developed an axisymmetric model to study the microbond test including a realistic droplet shape (also known as a bead shape) as shown in Figure 7 where
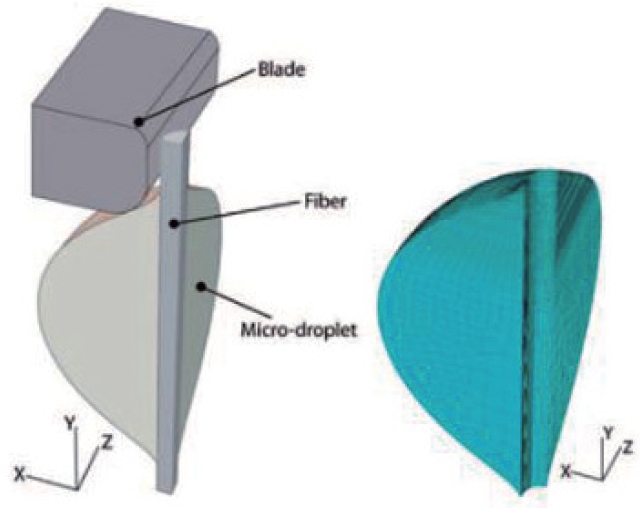
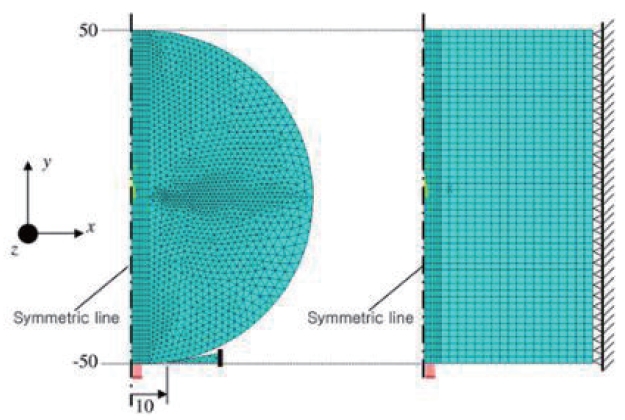
Pandey et al. [42] modeled a carbon fiber-epoxy system using both 2D axisymmetric and 3D finite element models with the commercial code ABAQUS as shown in Figure 8. The droplet shape due to the surface tension and wetting of the resin onto the fiber surface was modeled using the Carroll model [50,68]. However they did not consider any crack propagation in their FE studies and focused only on the peak stresses, concluding that the location of the peak stresses was the same in both the 2D and 3D models. Furthermore, they showed that the stress distributions predicted by these models were greatly affected by the blade geometry and blade separation distance.
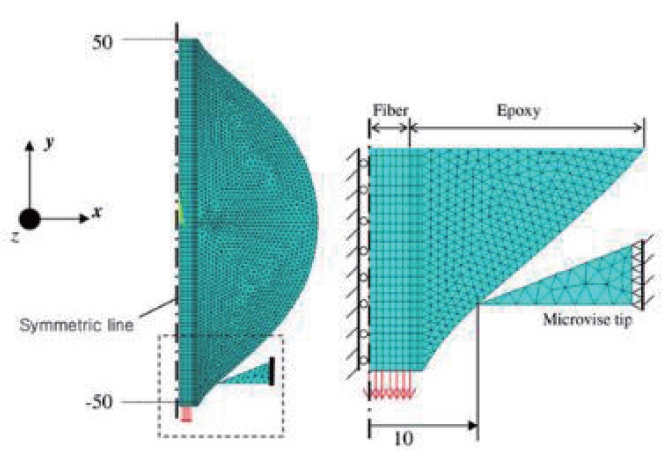
Kang et al. [33] also modeled the microbond test using an axisymmetric 2D model and considered different droplet shapes such as cylindrical and spherical, including the effect of the meniscus, as shown in Figures 9 and 10. The average shear stress along the interface for the cylindrical droplet was reported to be the same as that computed using Equation 1. They used the octahedral shear stress and distortion strain energy along the matrix as the yielding criterion. They showed large stress concentrations within the contact zone of the vise and concluded that octahedral shear
stresses based on the distortion energy is also appropriate to determine the IFSS.
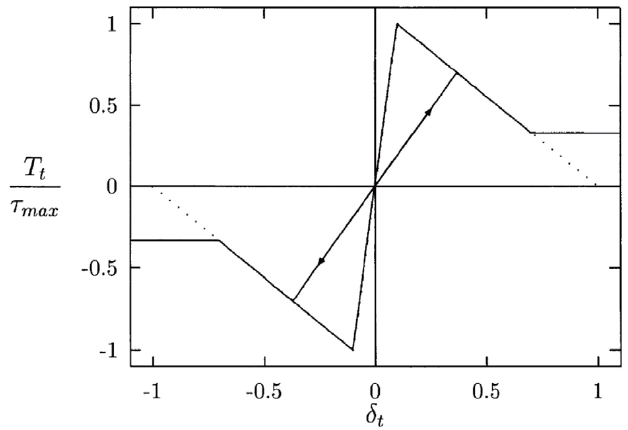
Crack propagation during fiber push-out was modeled using a cohesive zone approach in a volumetric finite element method with an axisymmetric model [72]. More details about cohesive zone modeling are available from Refs. [73,74]. A bilinear traction separation law with residual traction to represent frictional sliding between the crack faces was used in the model [72] . The solid and dotted curves shown in Figure 11 represent the failure in shear mode with and without friction respectively. The residual traction depicted by the solid curve in Figure 11 is an attempt to implicitly capture the frictional sliding behavior within the traction-separation law rather than explicitly modeling the frictional sliding using contact algorithms. Therefore this approach does not allow for the formation of new crack faces and may not be fully representative of the physically observed frictional sliding between the debonded droplet and the fiber surface.
The residual thermal strains due to the shrinkage of the matrix during processing were also accounted for in the analysis. The numerical predictions agreed well with the experimental results. The energy dissipated due to frictional sliding was reported to be much higher than the energy associated with interface failure. Based on parametric studies of the effect of friction, peak traction, and residual stresses, it was concluded that the coefficient of friction and the residual radial compressive stresses were critically important factors.
Schuller et al. [75] used an axisymmetric finite element model with the commercial code ANSYS to simulate the debonding of the microbond specimen. They noticed the strong effect of interfacial friction on the peak load. A stiffer system with a short free fiber length was recommended for stable crack propagation. They highlighted that while the sample preparation is easier for a microbond test compared to a single fiber pull out test (SFPO), the data reduction and interpretation of test results is much more complex due to the mixed-mode stress state and the droplet shape.
Beckert and Lauke [76] employed an axisymmetric
finite element model to study the SFPO test with a fracture mechanics based mixed-mode debonding criterion. Tsai et al. [77] developed a mixed cohesive and Coulomb-friction model to simulate the fiber pullout event of a copper fiber in a brittle epoxy matrix. A node-to-node contact and a node-to-surface contact algorithm were respectively used to capture the debonding and frictional sliding. An axisymmetric model employing an embedded process zone (EPZ) model was used by Nishikawa et al. [44] to extract the interfacial properties based on the microbond tests of carbon fiber-epoxy resin systems. The EPZ model with a trapezoidal traction-separation law was used to represent the debonding behavior. The matrix cracking observed during their experiments was due to the inability to control the loading knife position, which led to subsequent data scatter. Their FE studies confirmed their experimental observations (recall Figure 3 in Section 2.6) that when the knife position is near the fiber, large matrix cracking can occur which may not represent the interfacial fracture process.
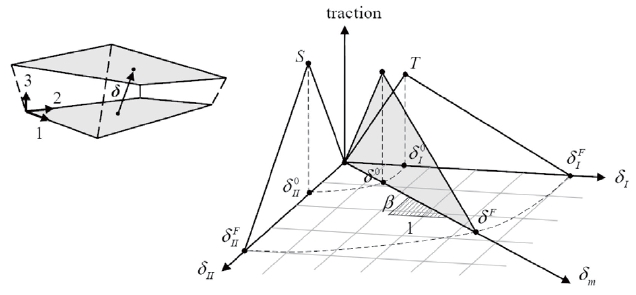
In spite of the modeling efforts thus far in the literature, a more advanced and comprehensive modeling methodology is still required to predictively model the residual thermal stresses due to the mismatch in the fiber and matrix thermal expansion coefficients, progressive interfacial debonding, unstable crack propagation, and post-debond frictional sliding. One such approach involves using tiebreak and cohesive zone models within the framework of a finite element analysis using commercial codes such as LS-DYNA [78,79]. One viable material model offered in LS-DYNA for use with cohesive zone elements is *MAT_COHESIVE_ MIXED_MODE, which is a bilinear mixed-mode tractionseparation constitutive law used to model interfacial failure, as shown in Figure 12.
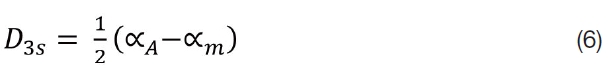
The parameters that describe this model include peak tractions in the normal (T) and tangential directions (S), and the energy release rates in modes I and II, given by Equations 7 and 8 respectively.
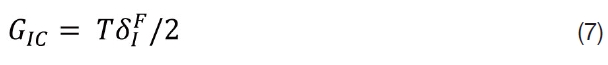

where

and
are the ultimate displacements in the normal and tangential directions respectively. The onset of softening and ultimate displacement in mixed-mode for the power law is given by Equations 9 and 10 respectively.
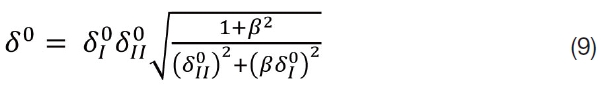
where
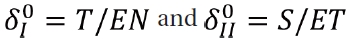
are the softening initiation displacements in pure mode I and mode II respectively.
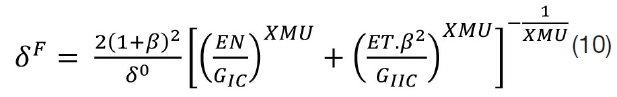
where XMU is the power law exponent, and EN and ET are the stiffness values in mode I and mode II respectively.
5. Improving the Interfacial Behavior by Tailoring the Interface
Gao et al. [39] concluded that the interphase can be tailored by creating mechanical interlocking between the fiber and the resin. They created fiber texture through silane blends which increased the surface roughness of the fiber and hence the energy absorption. Chandrasekaran et al. [80] studied the influence of resin properties on IFSS using the microdroplet test. A modified epoxy resin with multiwall carbon nanotubes (MWCNT) increased the IFSS by 26% compared to an unmodified resin. They concluded that the increase in IFSS was due to the enhancement of the surface roughness by the addition of the MWCNT.
Yim [81] studied the use of plasma surface treatments to functionalize the fiber surface of UHMWPE. It was concluded that the interfacial properties could be controlled by tailoring the covalent bonding between the fiber and the matrix. An increase in IFSS was observed during microdroplet testing for plasma treated UHMWPE-epoxy systems. Liu et al. [35] noted interfacial adhesion between polyamide fiber and aqueous polyurethane can be improved by plasma treatment. Ayala [82] studied the IFSS for different high performance fibers including M5, Armos N, Armos A, Kevlar KM2, Kevlar 49 sized and unsized, and E-glass using epoxy resin and concluded that M5 fiber had the highest IFSS. Matrix yielding for M5 fibers was observed during testing and attributed to the imidazole and hydroxyl functional groups in the fiber increasing the adhesive strength.
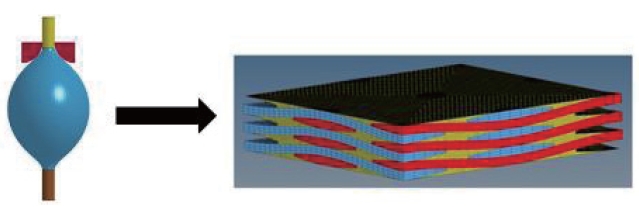
While much of the research work involving the development of new sizings and treatments has relied on experimental methods, it is clear the numerical modeling has a potentially large role to play in guiding the development of these sizings and treatments, particularly in the selection of optimal mechanical properties. However very few researchers have attempted to model and simulate the microbond test in its entirety; especially the pre-test effects of the cure cycle as well as the post-debond frictional sliding regime. During the ballistic impact of a textile composite, frictional sliding between the fibers and the matrix due to fiber pull-out, as well as inter-ply delamination are important failure and energy dissipating mechanisms. Developing predictive traction-separation laws for the fibermatrix interface at the single fiber length scale can then be utilized in a homogenized tow-level composite model to predict the macroscopic properties as shown in Figure 13. This approach involves bridging the various length scales together. The debonding, pull-out, and delamination mechanisms can all be modeled using cohesive elements or tiebreak-contacts with built in traction-separation behavior. This approach allows for an accurate representation of the various delamination and pull out behaviors observed during the ballistic impact of a textile composite.
Accurate modeling of the observed mechanisms of failure and energy dissipation allows a better understanding of the complex load transfer that occurs between the fiber and the matrix through the interface, as well as the frictional sliding behavior after complete debonding. Tailoring this interface through the development of new sizings and surface treatments in turn will lead to optimized load transfer and energy dissipation, and an overall improvement in the ballistic impact performance of protective textile composites.
A review of the single fiber microbond pullout test used to measure the IFSS and determine the quality of adhesion between the fiber and matrix was presented. Large amounts of scatter in the experimental data were attributed to factors that included the viscous relaxation of polymer matrix during processing and curing, inability to precisely control the loading knife separation distance, nature of the loading, shape of the cured droplet, mixed-mode state of stress, plastic yielding of the matrix, and reproducibility of the sample preparation. Since the microbond test has been adopted by many researchers over the past few decades to study the interfacial behavior between the fiber and matrix and to study the effects of surface treatments, it becomes vital to develop a standardized test methodology to eliminate these sources of data scatter and produce consistent, repeatable, and accurate results. While much of the FE modeling efforts have focused on capturing peak interface stresses, larger efforts need to be dedicated to modeling the effects of the pre-test curing cycle as well as the post-debond frictional sliding behavior, since the former has a large effect of the IFSS while the latter represents an important energy dissipating mechanism during the ballistic impact of textile composites.


![Post-test microbond specimens [44] - (top) knife edge near the fiber surface, (bottom) knife edge far away from the fiber surface](http://oak.go.kr/repository/journal/11295/HGJHC0_2012_v13n3_282_f003.jpg)
![Quasi-disk type microbond experimental setup [55]](http://oak.go.kr/repository/journal/11295/HGJHC0_2012_v13n3_282_f004.jpg)
![A typical force-displacement curve [61]](http://oak.go.kr/repository/journal/11295/HGJHC0_2012_v13n3_282_f005.jpg)
![Typical force displacement plot showing energy absorbing mechanisms [27]](http://oak.go.kr/repository/journal/11295/HGJHC0_2012_v13n3_282_f006.jpg)
![Microbond schematic [50]](http://oak.go.kr/repository/journal/11295/HGJHC0_2012_v13n3_282_f007.jpg)
![Quarter symmetric FE model of the microdroplet test [42]](http://oak.go.kr/repository/journal/11295/HGJHC0_2012_v13n3_282_f008.jpg)
![Axisymmetric FE model of carbon fiber with the droplet [33]](http://oak.go.kr/repository/journal/11295/HGJHC0_2012_v13n3_282_f009.jpg)
![Axisymmetric FE model with a cylindrical shaped droplet [33]](http://oak.go.kr/repository/journal/11295/HGJHC0_2012_v13n3_282_f010.jpg)

![Mixed-mode traction-separation law [78]](http://oak.go.kr/repository/journal/11295/HGJHC0_2012_v13n3_282_f012.jpg)