The supersonic inlet of the air-breathing engine under operating conditions is exposed to various throttle and angle of attack conditions. In these conditions, it is required to keep a certain quantity of mass flow rate for stable combustion. Compression and deceleration of the incoming flow to a proper Mach number should be achieved without any compressors. Around the supersonic inlet, the shockwave structure is developed by an external inflow condition and internal back pressure from the combustion chamber. This shockwave structure determines the physical properties of the captured air. The supersonic inlet is geometrically simple and its components are just a couple of parts, which are center-body and cowl. Despite the inlets simplicity, complex physical phenomena usually occur inside the engine. Especially, as angle of attack increases, it becomes more asymmetric and complicated.
Shockwave-shockwave interactions (SWI) and shockwave-boundary layer interactions (SWBLI) are typical phenomena of the supersonic inlet and these interactions induce self-excited shock oscillations, which lead to high amplitude variations of the inlet mass flow rate and pressure. Inconsistent mass flow rate incurs severe unsteadiness because the combustion process itself fluctuates heavily. This sequence of unsteady processes is referred to as inlet buzz, which provokes a number of efficiency problems regarding the ramjet. The inlet buzz can cause more serious problems such as thrust loss, non-starting of the engine, and even structural damages to the aircraft [1, 2]. In order to define the buzz occurrence mechanism and to control it, many precedent researches have been conducted in experimental and/or numerical analysis fields. The inlet buzz was first observed and described by Oswatitsch[3]. Later, Dailey [4] found that a SWBLI causes a flow separation on the compression surface, and this separation arises to an inlet buzz (Dailey type buzz). Ferri
Today’ s supersonic air-breathing engine is required to perform well at high angles of attack during tactical operations. However, axisymmetric inlet performance deteriorates rapidly as the angle of attack increases, as unfavorable factors for combustion such as asymmetric shock structures and non-uniform pressure distribution are generated. It is known that a serious subsonic diffuser flow separation problem, one of the unfavorable factors for combustion, occurs at a high angle of attack. This results in poor combustor performance and eventually the combustor blows out due to this separation [10]. Therefore, to predict engine performance at a nonzero angle of attack, both internal flow characteristics and shock structures should be monitored. Precedent researchers investigated the effects of internal flow characteristics to engine performance at a moderate angle (0° ~ 9°) of attack. Nevertheless, there are few investigations of axisymmetric inlet buzz under the attack angled flow condition [6, 11, 12]. Common results of these investigations are that the shock structure becomes more asymmetric as attack angle increases but buzz frequency is almost constant. To predict engine performance during inlet buzz at increased attack angles, it requires more studies that focus on asymmetric internal flow physics such as slip line and distortion.
In this research, the axisymmetric inlet buzz is simulated under various throttle and angle of attack conditions. Inviscid simulations are conducted at zero angle of attack and validated with experiment [6] and turbulent flow simulation data [13]. These validation works show that both inviscid and turbulent flow simulations have similar tendency in that the dominant buzz frequency reduces with the increased throttle area in spite of different local flow physics and values of some variables. In the next step, the effects of different attack angles, from 0° to 10°, are analyzed by inviscid flow calculations. From these results, flow characteristics such as dominant frequency, asymmetric shock structure and distortion are examined with the main interest of inviscid primary flow physics.
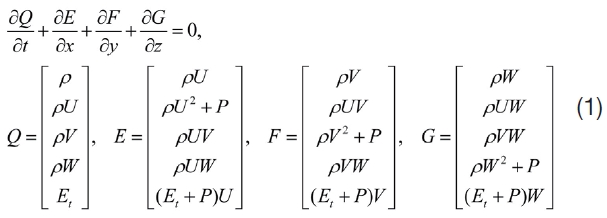
Inlet buzz is a strong unsteady phenomena accompanying high frequency pressure oscillation, so buzz simulation requires expensive computational cost, i.e. time and resources. To reduce computational cost while maintaining analysis level of qualitative effect from angle of attack of the inlet body, inviscid flow simulations were conducted. For the inviscid simulation, three-dimensional Euler equations are adopted. The Euler equations are expressed as follows:
As a spatial flux scheme, AUSMPW+[14] is used to remove oscillations of AUSM+ near wall where a strong shock passes by, while maintaining the accuracy of the original scheme. A second-order MUSCL[15] and LU-SGS[16](Lower-Upper Symmetric Gauss-Seidel) time integration method is adopted in this solver, and a dual time stepping method is employed for an unsteady simulation.
2.2 Grid System and Boundary Condition
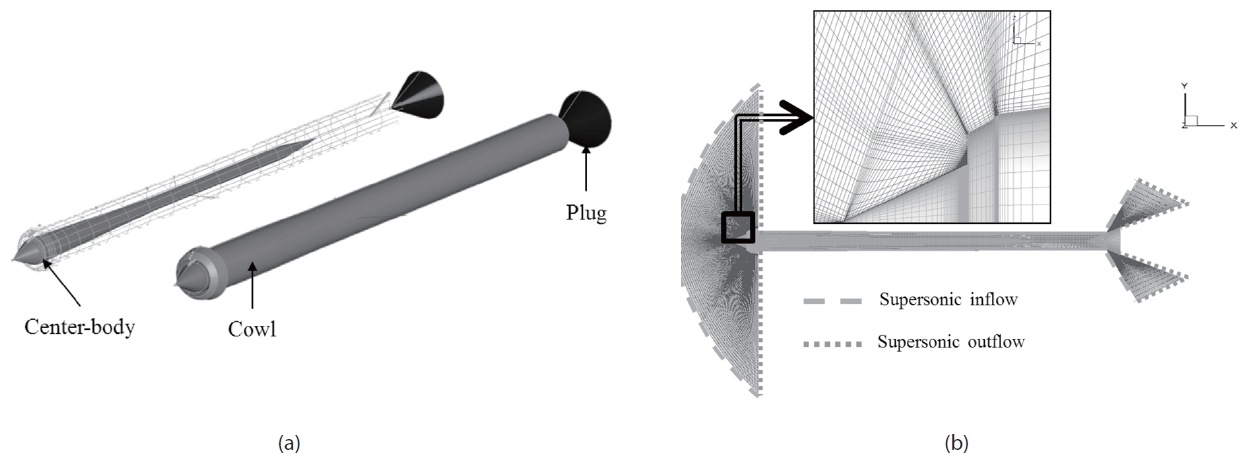
An axisymmetric engine configuration [6] is used in the current study. As shown in Fig. 1-(a), the engine has a centerbody, cowl, and plug components.
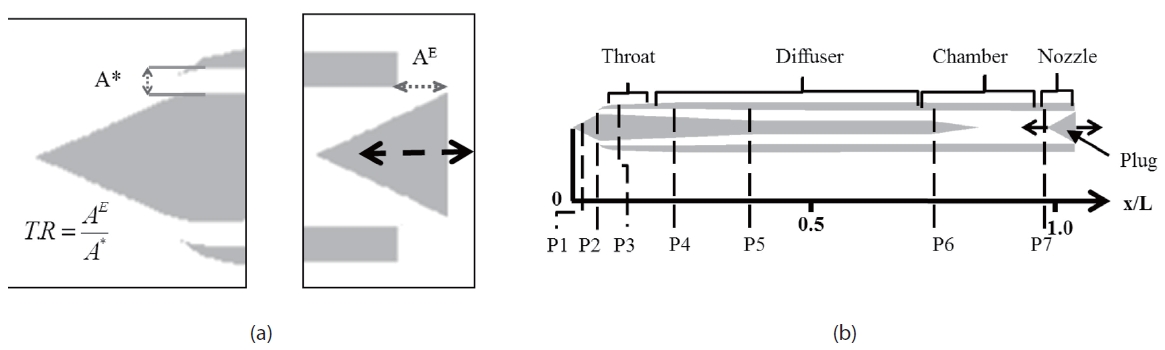
The plug attached at the rear part of the engine moves back and forth to control the throttling ratio (T.R). The definition
of throttling ratio is explained in Fig. 2-(a).
Figure 1-(a) depicts grid topology and boundary conditions. The three-dimensional grid system consists of 80 blocks and approximately 0.7 million meshes. Half of the meshes are for the interior domain, and the dimension is 250 axial points, 35 interior radial points and 40 axis rotational points with referring to Newsome’ s grid [7] for turbulent flow simulation (190 of axial points 30 of interior radial points). Meshes around the compression ramp of the center body and the cowl lip section are properly clustered to obtain accurate results. The free-stream Mach number is 2 and the atmospheric condition is referred to the standard sea level air(6). The unit length is 30mm and speed of sound is 307.36m/s (T∞=233k). The computational domain is shown in Fig. 1-(b). For efficient calculations, the exterior domain is limited to two essential parts, which are near the inlet and exit. Boundary conditions for the exterior domain near the inlet are straightforward since the velocity is supersonic across the outer boundary surfaces. Mach 2 inflow conditions and simple extrapolation are applied for this part. For the other exterior domain, pressure or mass flow rate make boundary conditions easy. Without the exterior domain, pressure or mass flow rate has to be given at the exit of the chamber which might be occasionally arbitrary. Since the exterior domain includes the diverging nozzle area, flow is accelerated and velocity is supersonic across the outer surfaces of the attached domain. Thus, similar to the exterior domain near inlet, simple inflow condition (blue dashed line) and extrapolation (orange dashed line) can be applied as shown in Fig. 1-(b).
As in the experiment [6], there are seven pressure sensors on the target geometry (Fig. 2-(b)). P1, P2 sensors are on the compression ramp and P3 is on the throat area. P4 to P7 sensors are on the diffuser and chamber surface. Pressure histories for each sensors show the inlet characteristics at each throttling ratio. Using FFT (Fast-Fourier Transform) analysis, the dominant frequency of the inlet buzz is obtained.
The throttling ratio for the buzz simulation ranges from 0 to 0.67. With such a small throttling ratio, it is known that high frequency inlet buzz arises [6]. In general, the buzz repeats with the cycles consist of the three regimes: supercritical, critical and subcritical. For a supersonic inlet, these regimes can be clearly distinguished as shown in Fig. 3. The supersonic inlet flow conditions are defined as shown in Fig. 3.
3.1 Steady State Simulation at T.R 2.41
For the steady state case, both inviscid and viscous simulations are conducted. The same numerical methods explained in the previous section are adopted to solve the three dimensional Navier-Stokes equations and the total number of mesh is increased to 3.5 million to satisfy wall
resolution criteria. Internal grid dimension is 250(axial)×70(radial)×80(axis-rotational) and the turbulent nondimensional first step size adjacent to the wall is typically y+=1. In addition,
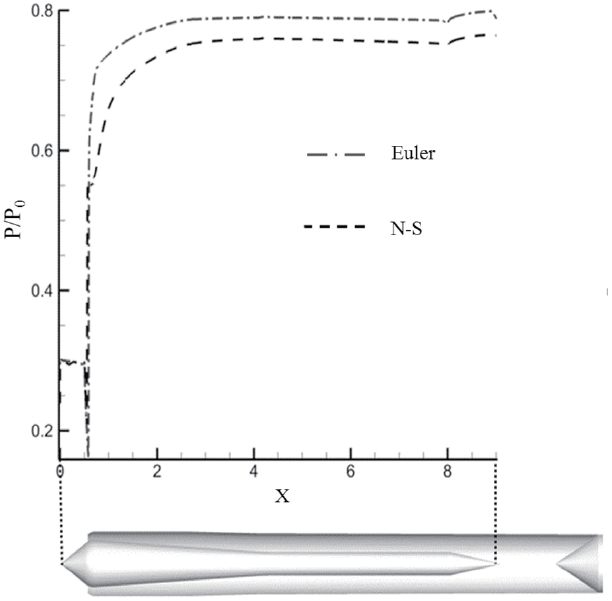
The curves in Fig. 4 indicate static pressure at the centerbody surface along longitudinal direction. It demonstrates that different recovery behavior appears at the throat area. Afterwards, the difference is maintained to the end of the center-body. Consequently, static pressure at the plenum chamber has different quantity between inviscid and viscous simulations as listed in Table 1.
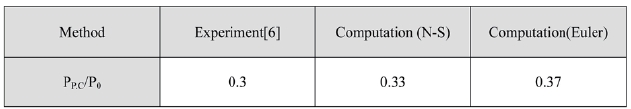
Static pressure recovery at the plenum chamber (PP.C : static pressure in plenum chamber, P0 : total pressure in settling chamber [6])
This table shows that even the viscous simulation has a difference from experimental quantity. It is because the grilled type exit of the plenum chamber in the experiment is simplified as a continuous radial band type with maintaining an area for simulation(6). Mach number contours are shown in Fig. 5.
The viscous simulation result clearly shows the SWBLI induced vortex at the throat. This vortex is the main source for the pressure loss, and eventually creates a discrepancy between inviscid and viscous results. In addition, this vortex narrows the throat area and it causes throat chocking earlier. The terminal shock near the cowl lip moves upstream because the throat area is decreased due to the vortex. Due to viscous effect, the viscous simulation shows the vortex near the cowl lip, 6% lower pressure recovery and lower Mach number at the wall surface in comparison with inviscid simulation, while all the simulations have the same external shock structure and common trend of pressure recovery as shown in Figs. 4 and 5.
3.2 Buzz Simulation with Zero Angle of Attack
To examine inlet buzz behavior according to the throttling ratio, the simulation was conducted with zero angle of attack. From the result of the zero throttle-area case (T.R=0), FFT analysis was carried out using pressure history data in each sensor. The dominant frequency is 334.108Hz when the physical time step of the simulation is 10μsec. The physical time step is gradually controlled from the initial value of 5μsec to the final value of 40μsec. The dominant frequencies are distributed in a span of 334.031±0.079Hz. Since it is short enough to predict a dominant frequency, 10μsec is adopted for the physical time step to capture instantaneous frames clearly in the high frequency buzz cycle.
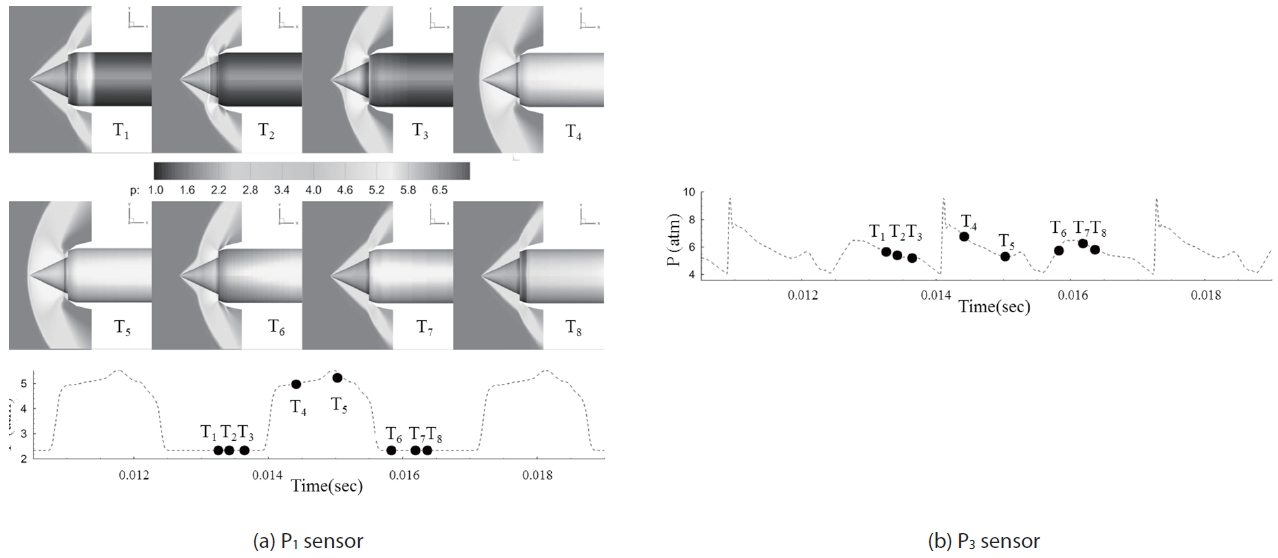
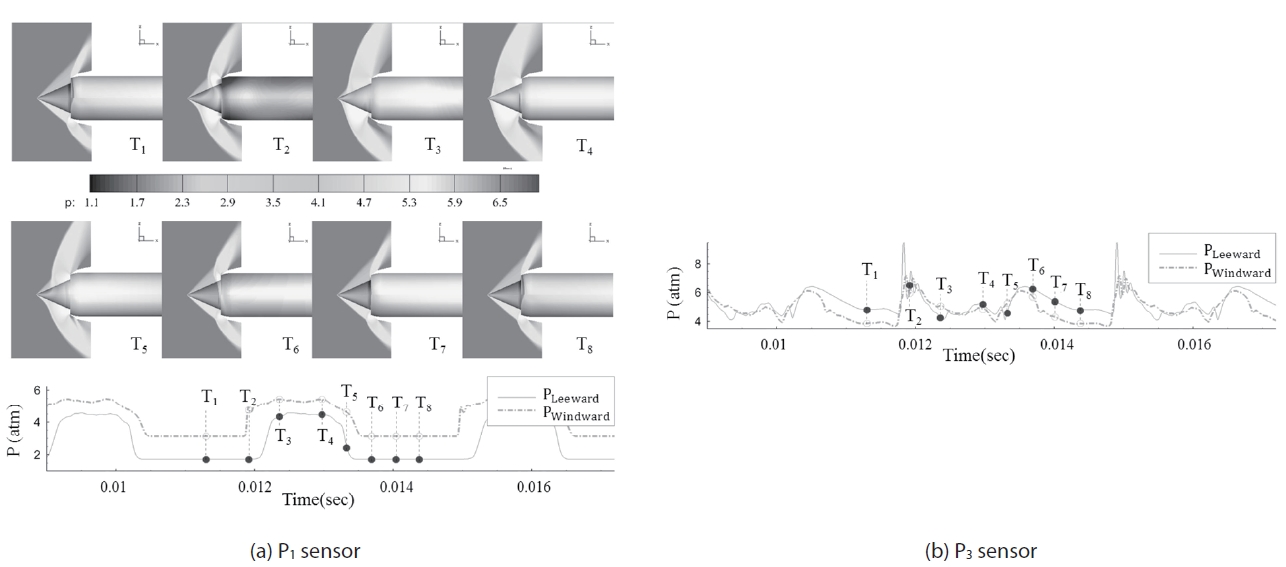
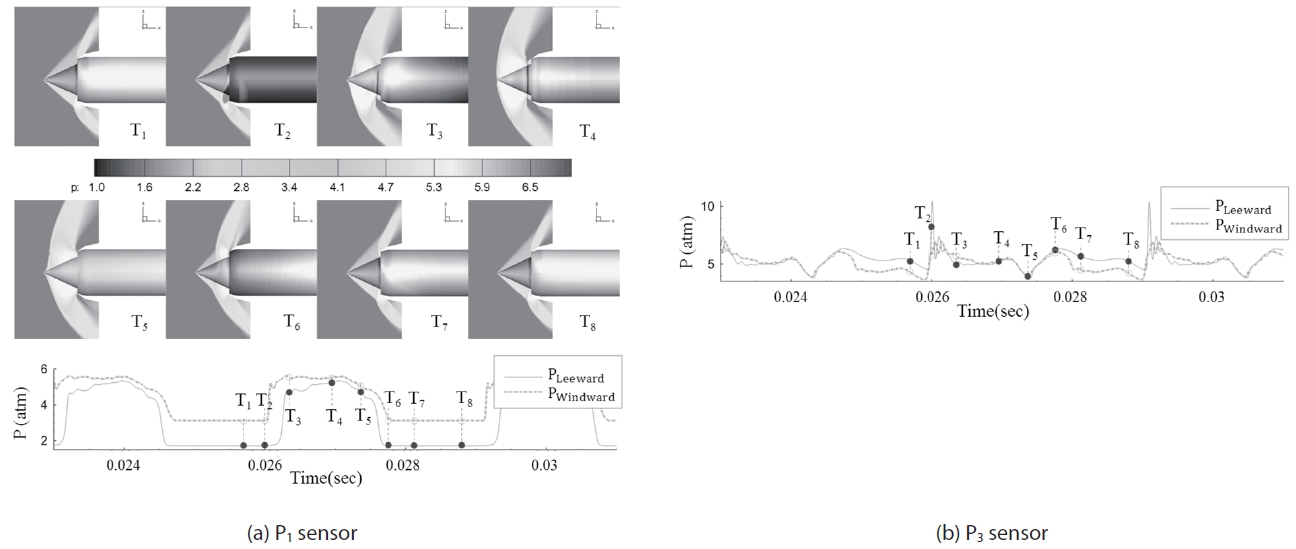
Figure 6 shows shock movement and the pressure fluctuation at P1 and P3 sensors for the throttling ratio of zero.
The P1 position is near the front line of the shock-expelled range, and P3 is at the throat, which is the rear limit of terminal shock at the supercritical condition. Since the pattern of recorded pressure histories at P1 and P2 are almost the same, pressure data at P1 and P3 are presented. The frames from T1 to T8 are a sequence of a buzz cycle. At the beginning of the cycle, T1, it is a supercritical condition and internal pressure is increasing due to blocked exit (T.R is 0). Therefore, the high pressure region is expanded to upstreamwise, and by the time it reaches the cowl lip, the flow regime suddenly switches from a supercritical to a subcritical condition, as shown in Fig. 6, T2. During the time interval of T3 to T4, the shock passes the sensor position with a step-like pressure jump. The shock moves so fast that the flow regime instantly switches from a supercritical to a subcritical state. In the subcritical condition, the back-pressure wave is still moving to upstream-wise and the oblique shock and the bow shock interact with each other. After all, the bow shock is detached from the tip of the center-body cone. During this shock forwarding process, from T1 to T4, the captured ratio is decreased and high back-pressure is relieved with emission by reversed flow. The next stages from T5 to T8 are the shock retreat process. The captured area increases as the shock moves downstream and the flow regime returns to the supercritical condition. From T8, after a while, the internal pressure rises and the flow structure becomes that in T1 again. Therefore, one buzz cycle is over and it repeats. This sequence of the buzz cycle has been well known by many studies and the buzz behavior of this simulation result agrees well with the previous researches [4-9].
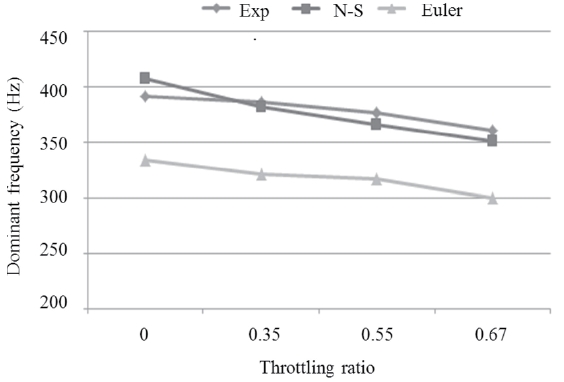
Figure 7 depicts the dominant frequency variation with different throttling ratios. The variation is compared to the experiment and turbulent flow simulation results [13].
Current inviscid results predict a lower frequency than
the viscous simulation, but the gap between the two curves is nearly constant as 60Hz or 15% and the tendency of frequency variations also coincide. As mentioned in section 3.1, since there are no boundary layers and a separation vortex in the inviscid simulation, the throat is chocked later than the viscous case. Therefore, the inlet captures more mass flow so that beginning of the shock forwarding process is delayed and the buzz cycle takes longer time.
The comparison studies between inviscid and turbulent flow simulations show that although there are some quantitative differences, inviscid flow calculation predicts the external shock structure and the tendency of buzz frequency well. In the meantime, the turbulent flow simulation takes approximately 10 to 20 times more computational cost than the inviscid one. Thus, in the next step, we decided to perform inviscid flow calculations to study the qualitative flow behavior around the inlet. In fact, it was found that the inviscid calculation was sufficient to examine the asymmetric unstable behavior of buzz flow with a non-zero angle of attack.
3.3 Buzz Simulation with Moderate Angle of Attack
In this section, the effects of different attack angles are studied on the buzz phenomenon. The attack angles of 3°, 5°, 7° and 10° are chosen. Table 2 lists the dominant frequencies varying with different angles of attack. Although the attack angle increases, the frequency is nearly stationary at around
[Table 2.] Dominant frequency variation along the angle of attack at a throttling ratio of 0
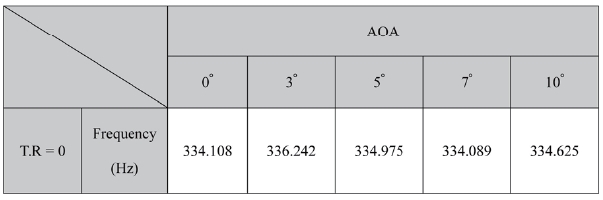
Dominant frequency variation along the angle of attack at a throttling ratio of 0
334Hz, thus the buzz frequency is also not that sensitive to the attack angle.
This tendency has already been reported by precedent experimental studies [6, 11, 12].
Figure 8 shows the sequence frames in a buzz cycle at a 10° angle of attack and 0 throttling ratio. The sequence is similar to Fig. 6 while the asymmetric shock structure is observed.
Since the oblique shock strength at the windward side (lower half ) is stronger than the leeward side (upper half ), pressure at windward rises greater than the other side. It is supported by pressure history curves at the bottom of Fig., which are measured at the P1 and P3 position. In the shock forwarding process (T1 to T4), shock in the leeward side moves out later than the shock in the other side. Using the Taylor-Maccoll [18] equation, asymmetric oblique shock angles can be predicted. However, the asymmetric bowshock structure in the T4 frame of Fig. 8 and desynchronized shock oscillation need to be explained further.
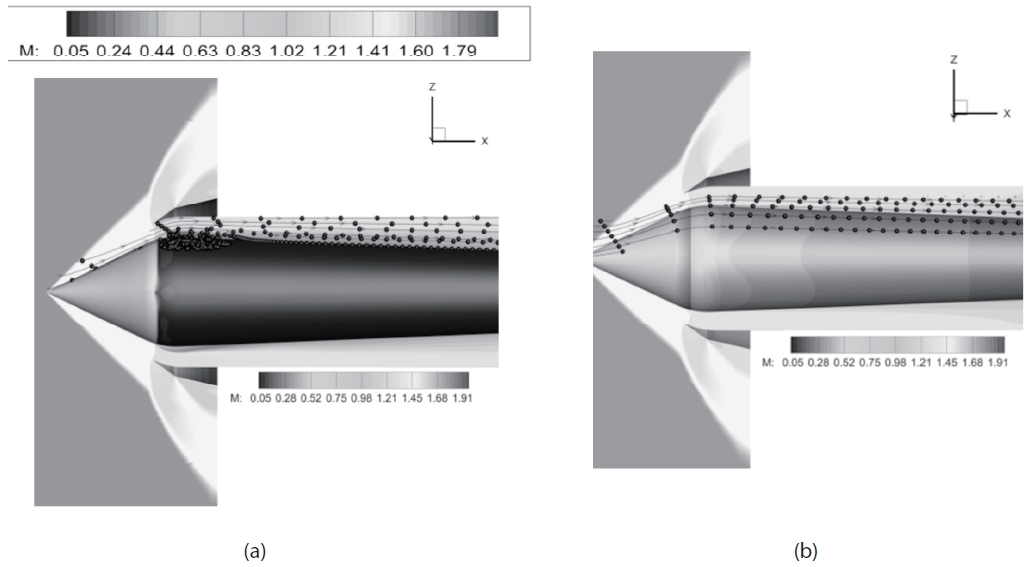
Figure 9 presents the Mach contours and stream lines at a critical condition when there is no angle of attack (T7 frame in Fig. 6) when the throttling ratio is 0, which is T7, one of the frames in Fig. 6.
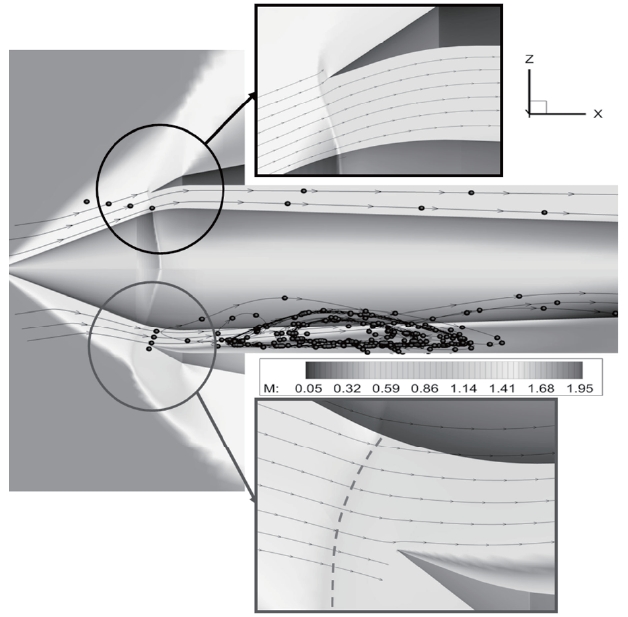
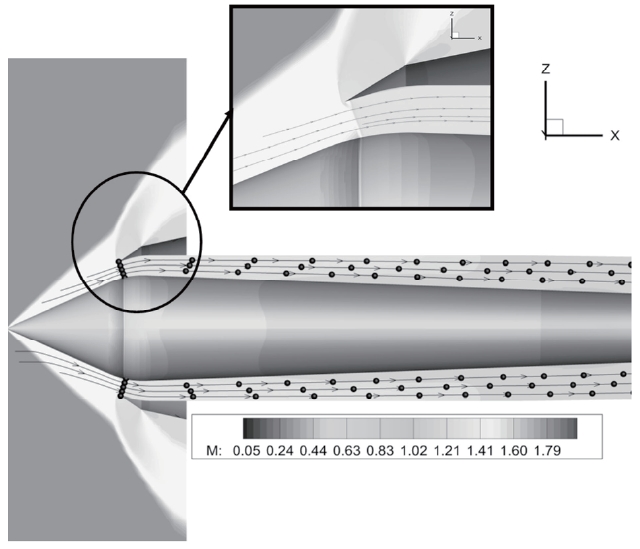
The normal shock remains at cowl lip in both the windward and leeward side. On the other hand, Fig. 10 shows the asymmetric shock structure. This is from the T7 time frame in Fig 8.
Furthermore, bow shock (dashed line in Fig. 10) occurs at the windward side and a slip line is generated from the cowl lip. Due to the windward bow shock, the direction of the flow stream is changed not to align with the inner cowl surface. For this reason, Please review and clarify), there is a large
amount of velocity difference between the mainstream and the flow near the inner cowl surface. However, there is very little pressure gradient across this slip line. This slip line is one of the sources of distortion and one experiment reported that flow separation occurred at the windward cowl lip [21]. During the shock retreat process from T5 to T8, pressure on the leeward side is higher than the windward side at P3. This is because the pressure discontinuity surface leans upstream-wise at the leeward side as depicted in Fig. 8-(a) T6, T7 frames. This shock-leaning behavior becomes more visible as the throttling ratio increases (see Fig. 12-(a) T6, T7).
Generally, in attack angled flow field, the effective angle of incidence increases at the windward compression side
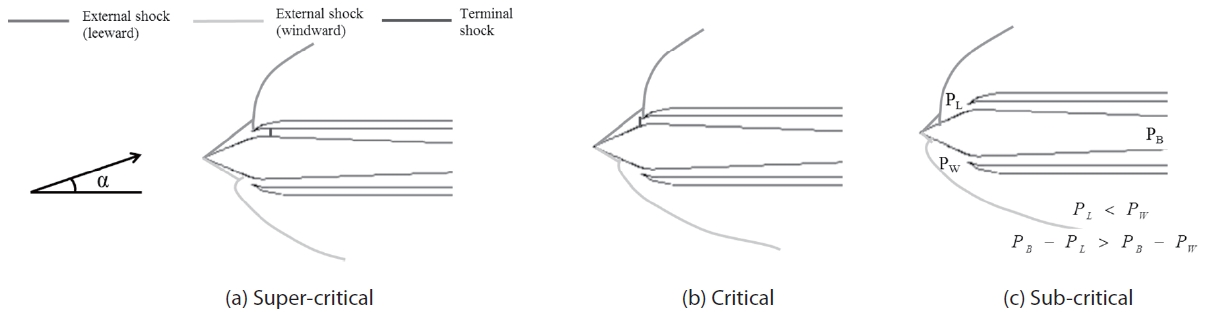
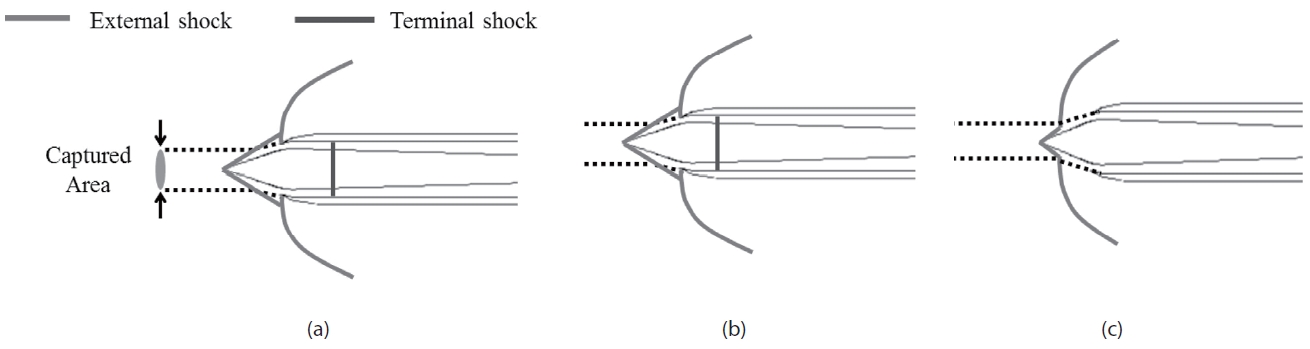
whereas it decreases at the other side. Therefore, the leeward oblique shock strength is weaker than the no attack angled case and pressure rise is not noticeable after the oblique shock. In Fig. 10, since back pressure is relatively much higher than the pressure after the oblique shock at the leeward side, the shock is eventually pushed out of the inlet. A few time frames for the non-zero angle of attack case are depicted schematically in Fig. 11.
Figure 10 frame (T7) is simplified in Fig. 11-(b). At this moment, leeward terminal shock moves to a more upstream position than the zero angle of attack case (Fig. 9) due to weaker leeward oblique shock. Meanwhile in the windward side, stronger oblique shock was expected to create the supercritical condition with the terminal shock residing inside. However, a bow shock is generated in front of the cowl lip due to the increased bluntness of the windward cowl lip.
Therefore, the windward side is also in subcritical condition and the slip line is developed in the cowl lip because the bow shock makes the windward inflow direction curved as shown in Fig. 10. Figure 11-(c) shows when the shock is pushed out to the upstream limit in Fig. 8 T4. The shock angle depends on three conditions: free-stream Mach number, compression surface angle, and back pressure. As shown in Fig. 11-(c), after-shock pressure on the leeward side is lower than the windward side even if back pressure is equal and high on both sides. As a result, back pressure on the leeward side expels the leeward shock more strongly, and thus the leeward bow shock angle is larger than the windward side in the subcritical condition. During the process of Figs. 11- (a) to (c), the inlet captured area keeps being asymmetric and varies in a buzz cycle. As a result, this transient behavior makes the dynamic distortion of the total pressure at the inlet cross section.
When the throttling ratio is increased, shock movement at the windward and leeward side is even more desynchronized with each other compared to the zero throttle-area case. As shown in Fig. 12, during shock forwarding (T1~T4), process shock positions at the windward and leeward side have more different features than the previous case (Fig. 8). Also, Fig. 12 shows that windward pressure at the P1 sensor increases before T2, which is earlier than the zero throttle-area case.
As mentioned earlier, a bow shock is located in front of the windward cowl and there is always some open space between the shock and the cowl lip. Therefore, it is easier to push flow upstream and reversing flow has room to escape. It makes the windward shock move upstream earlier. The leeward side, on the other hand, requires higher back pressure for a transition to subcritical because the shock at the cowl lip should be pushed away first. Only then, can the flow be emitted out of the inlet. Since pressure rises slower as the throttling ratio increases, the leeward side shows slower transition to the subcritical state, which results in even more severe desynchronizing with the other side.
3.4. Distortion at Inlet Cross Section Induced by Asymmetric Physics
In general, a ramjet with an angle of attack has an internal distortion problem in which pressure distribution as well as reaction amount are significantly irregular. This irregularity becomes severe as angle of attack increases. In particular, the inlet buzz with an angle of attack incurs dynamic distortion. The distortion coefficient (DC) is defined as follow [19]:
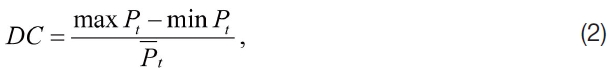

averaged total pressure,
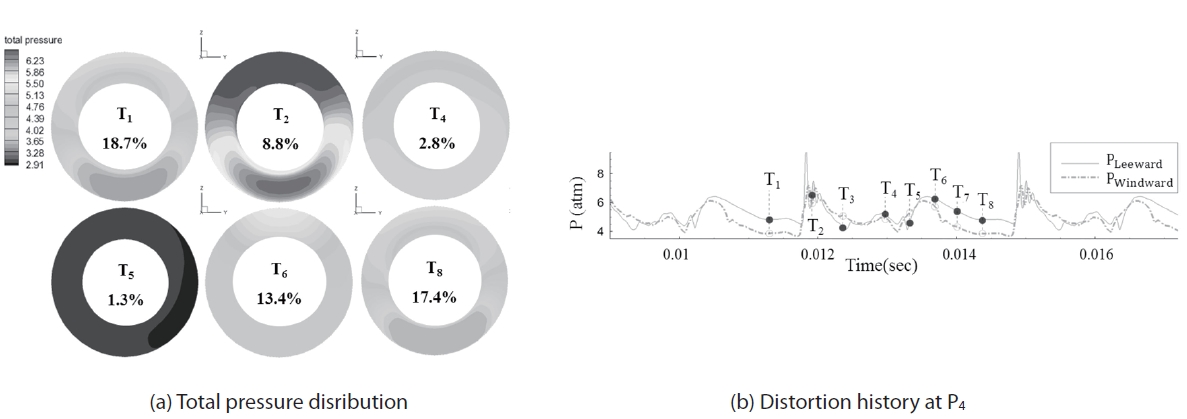
Time indices in Fig. 13 are from Fig. 8, and DC is written in
percent unit in the figure.
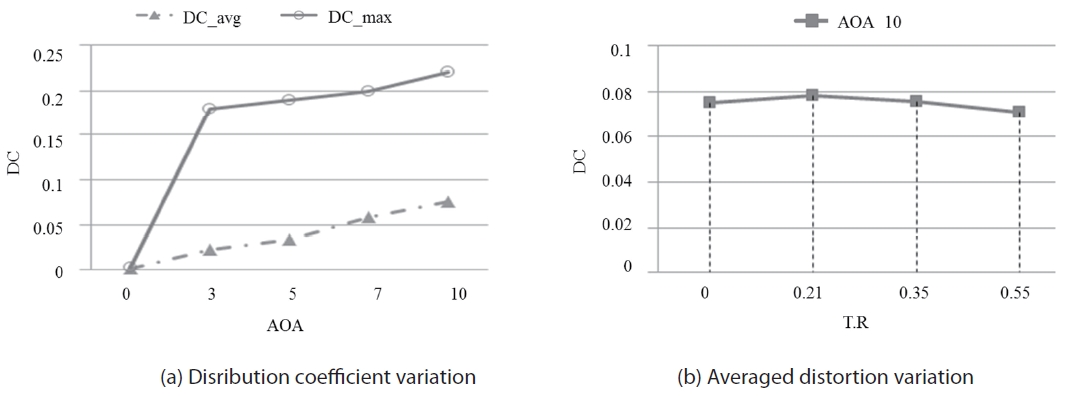
DC is higher during the back pressure recovery stage (T1, T2, T6, and T8). During these times the terminal shock remains near the cowl lip and the throat section is exposed to a high Mach number and low pressure flow. Asymmetric resources such as slip line from the windward cowl lip in Fig. 10 and reversed flow desynchronizing strongly affect distortion. Figure 14-(a) shows the time averaged distortion coefficient for different throttling ratios. It appears that the throttling ratio does not affect the distortion much. However, the angle of attack is found to significantly influence the distortion. As is shown in Fig. 14-(b), DC increases nearly in proportional to the attack angle. Although the averaged distortion coefficient is less than 0.1, instantaneous peak is about 0.2, 3 to 7 times higher than the averaged DC.
The inlet buzz was numerically simulated with controlling the throttling ratio from 0 to 0.67 and the angle of attack from 0° to 10°. When there is no angle of attack, the inviscid simulation predicted a dominant frequency 15% lower than the viscous simulation and experimental result but the slope of the dominant frequency variation for different throttling ratios agrees well with each other. The asymmetric shock structure and flow physics appear when the angle of attack exists. Due to weaker shock strength, back pressure pushes leeward terminal shock to a more upstream location. In the windward side, a bow shock appears in front of the windward cowl due to the increased bluntness of the cowl lip. Since the stream line is curved by the bow shock, a slip line is generated from the windward cowl lip. Further, the moment of reversed emission at windward and leeward is desynchronized as the throttle ratio increases. These asymmetric physics at the angle of attack condition dominantly affect distortion. For this reason, angle of attack is the determinant in regards to distortion while the throttling ratio is a minor element. In this study, inviscid computations are conducted to reduce computational resources and time cost. Although the present result shows some quantitative difference from the experimental data, it reasonably predicts the effect of angle of attack on the buzz frequency, shock structure and distortion coefficient. This information allows us to understand the fundamental aerodynamic characteristics, such as buzz behavior and inlet performance, of target geometry within a limited range of angle of attack. Moreover, the computed results can be used for preliminary design and identifying a feasible range of inlet operations.


![Static pressure recovery at the plenum chamber (PP.C : static pressure in plenum chamber, P0 : total pressure in settling chamber [6])](http://oak.go.kr/repository/journal/11294/HGJHC0_2012_v13n3_296_t001.jpg)