Nanoporous non-woven carbon fibers for a gas sensor were prepared from a pitch/polyacrylonitrile (PAN) mixed solution through an electrospinning process and their gas-sensing properties were investigated. In order to create nanoscale pores, magnesium oxide (MgO) powders were added as a pore-forming agent during the mixing of these carbon precursors. The prepared nanoporous carbon fibers derived from the MgO pore-forming agent were characterized by scanning electron microscopy (SEM), N2-adsorption isotherms, and a gas-sensing analysis. The SEM images showed that the MgO powders affected the viscosity of the pitch/PAN solution, which led to the production of beaded fibers. The specific surface area of carbon fibers increased from 2.0 to 763.2 m2/g when using this method. The template method therefore improved the porous structure, which allows for more efficient gas adsorption. The sensing ability and the response time for the NO gas adsorption were improved by the increased surface area and micropore fraction. In conclusion, the carbon fibers with high micropore fractions created through the use of MgO as a pore-forming agent exhibited improved NO gas sensitivity.
A number of chemical pollutants, many of which are released from chemical plants and automobiles, have become global environmental issues. Therefore, effective measures for the treatment of flue gases should be taken to limit pollution from exhaust [1]. Among these gases, nitric oxide, which is produced during burning processes, reacts with ozone in the atmosphere to form nitrogen dioxide. The nitrogen dioxide then combines with water to form nitrous and nitric acids, which cause acid rain. In addition, nitric oxide has an injurious influence on human health and the environment. Hence, the development of a NO gas sensor for the measurement of NO levels would aid in the monitoring and reduction of the release of NO [2-4]. Gas sensors have been considered promising alternatives for the measurement of environmental pollutants due to their low cost, high sensitivity, fast response and direct electronic interface. However, the performance of these sensors, including their accuracy, selectivity and reliability, must be improved to satisfy the requirements for standard air pollution measurement [5].
Metal oxide semiconductors have been used as gas-sensing materials due to their high responsiveness to target gases [6]. Metal oxide gas sensors have the greatest potential due to their very low cost, high sensitivity, fast response/recovery time, simple electronic interface, ease of use, low maintenance, and ability to detect a large number of gases [7]. However, these sensors require a high operational temperature, which severely limits their potential use [8].
The development of gas sensors using carbon materials has been studied by many researchers. Carbon materials are used in many electrochemical applications due to their advantageous electrical and thermal conductivities, low density, adequate corrosion resistance, low thermal expansion, low elasticity and high purity [9]. In addition, a number of carbonbased materials, which include activated carbon, single- and multi-carbon nanotubes, graphite, graphite nanofibers, fullerenes and whiskers, have been developed over the last few decades. Among these materials, carbon nanofibers generally have useful tensile properties, low densities, and high thermal and good chemical stability in the absence of oxidizing agents, good thermal and electrical conductivity levels, and excellent creep resistance.
Carbon fibers are manufactured from two main sources: polyacrylonitrile (PAN) and petroleum pitch (or mesophase pitch). Two general approaches can be used to enhance the graphitization of a pitch-based precursor. The graphitic structure gives pitch-based carbon fibers a higher elastic modulus and higher thermal and electrical conductivity levels along the direction of the fiber [10,11]. However, pitch-based fibers exhibit poor electrospinnability due to their low molecular weight and low solubility in solvents such as tetrahydrofuran (THF) and dimethylformamide (DMF). These limitations can be improved through the blending of the carbon fibers with a polymer with improved electrospinning ability, such as PAN. Therefore, we reasoned that carbonized pitch/PAN blends might combine the excellent fiber-forming ability of PAN and the conductivity of pitch to create a promising electrode material [12].
One of the methods currently used to prepare microporous and mesoporous carbon is known as the template method. Template methods are advantageous due to the homogenous size and morphology of the micropores and mesopores that are formed, even in an ordered state. Therefore, this process was used in this study for the preparation of nanoporous carbon fibers, using magnesium oxide (MgO) as a pore-forming agent. We developed a new method for the preparation of nanoporous carbon fibers that does not require the use of any activation processes [13,14].
In this study, nanoporous non-woven carbons fibers with a narrow pore size for gas-sensing electrodes were prepared from electrospun pitch/PAN fibers using MgO powders. The effects of different content ratios of the MgO additives on the sensitivity and response time of the resultant NO gas sensor were investigated.
The petroleum-derived isotropic pitch was obtained through the condensation of pyrolyzed fuel oil (Hanwha Chemical Co., Korea). PAN (molecular weight = 160,000, Aldrich Chemical Co., USA) was used as a carbon source. THF and DMF (≥ 99.9%) (Aldrich Chemical Co., USA) were used as solvents. These solvents were used without further purification. MgO (Aldrich Chemical Co., < 10 nm) was used as a pore-forming agent to form the porous structure .
2.2. Preparation of electrospun pitch/PANbased carbon fibers
The concentration of the pitch in the THF was 20 wt%. A 14 wt% solution of PAN in DMF was added to the pitch in the THF solution with a pitch/PAN solution weight ratio of 7/3. The pitch/PAN solution was impregnated with MgO at PANbased content ratios of 10, 25, and 50 wt% [15]. The prepared solutions were transferred to a 30-mL syringe with a capillary tip (18 G). The syringe was then placed in a KD scientific syringe pump (Model 100). The solution was ejected onto an aluminum foil-covered collector. Electric power was applied using a high-voltage power supply (NT-PS-25K, NTSEE Co., Korea) at 15 kV. Please refer to our previous work for more details [16]. Before the electrospun fibers were carbonized, a stabilization step was performed to convert the thermoplastic polymer, which may soften and melt at high temperatures, into a thermosetting polymer. The stabilization step was then performed at 573 K for 4 h in air. The stabilized electrospun samples were heat-treated in a nitrogen atmosphere at 1323 K under the following conditions: a heating rate of 10 K/min, a holding time of 1 h and a nitrogen feeding rate of 100 mL/h [17]. The resultant non-woven carbon fibers with 0, 10, 25, and 50% MgO were denoted as RF, ACFM10, ACFM25, and ACFM50, respectively. The MgO powders were removed from these fibers by immersing non-woven fibers in 1.5 M HCl at room temperature for 24 h.
2.3. Preparation of the gas sensor
The prepared fibers (0.05 g) were dispersed in acetone (2.5 g, Samchun Chemical Co., Korea, 99.5%) and then sonicated for 25 min for uniform spreading in the acetone. This dispersed solution (0.01 g) was dropped onto a silicon wafer with Pt through the use of a micro-pipette (Ovation pipette, Vistalab, 1000 μm) and was then spin-coated (spin coater, ACE-200) at 1000 rpm for 5 min. The wafer was mounted on the end of silver wires (100 μm in diameter and 4 cm in length) and fixed using silver paste. The wafer was heated on a hot plate at 373 K for 10 min to remove any impurities in the electrode. Thus, the gas sensor electrode thickness of the deposited materials on silicon wafer was 16 ± 1 μm.
2.4. Characterization of the prepared samples
Viscosity measurements were performed using a Brookfield programmable digital viscometer (DV-II + PRO, Brookfield Engineering, USA). The device consists of a spindle (RV2-4) and a cooling jacket with a temperature control module (FTKY3). In order to investigate the surface morphology of the resultant samples, scanning electron microscope (SEM) images were obtained using a field-emission SEM (FE-SEM, Hitachi, S-5500). The textural properties of the resultant samples (RF, ACFM10, ACFM25, and ACFM50) were investigated before making the electrode of the gas sensor. The samples were degassed at 423 K for 3 h. Nitrogen adsorption was then performed at 77 K with a Brunauer?Emmett?Teller (BET) apparatus (Micromeritics ASAP 2020) to investigate the specific surface area (SSA), the total pore volume, the pore size distribution, and the micropore fraction of each sample were assessed.
2.5. Measurement of the gas sensitivity
The experimental setup employed a programmable electrometer (Keithley 6514) to evaluate the gassensing properties of the prepared electrode samples. Sensors were positioned in a thermally isolated stainless steel chamber and a sealed test cell (1500 mL volume) endowed with a gas inlet and outlet. The prepared gas sensor sample was placed in the sealed chamber under a vacuum at a pressure of 1 × 10?3 torr. Initially, nitrogen gas was injected into the chamber to stabilize the electrical resistance. The test NO gas was diluted with N2 to obtain a molar concentration of 1000 ppm. N2 gas was used as a carrier gas to control the gas concentrations further. The mixture gas, which had a concentration of 50 ppm NO in N2, was injected into the chamber at a constant total flow rate of 250 sccm. The change in the electrical resistance was measured at 298 ± 1 K. After the electrical resistance was stabilized under the NO gas, the injection of NO gas was turned off and the recovery of the electrical resistance was observed. The gas-feeding rate was kept constant at 250 sccm throughout the experiment. The sensitivity (S) of the sensor is de?ned by the percentile resistance change when the sensor is exposed to a gas, as follows:
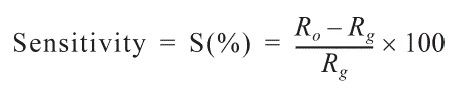
Here, R0 is the resistance of the sensor in N2 gas and Rg is the resistance of sensor under the test gas (NO) [16].
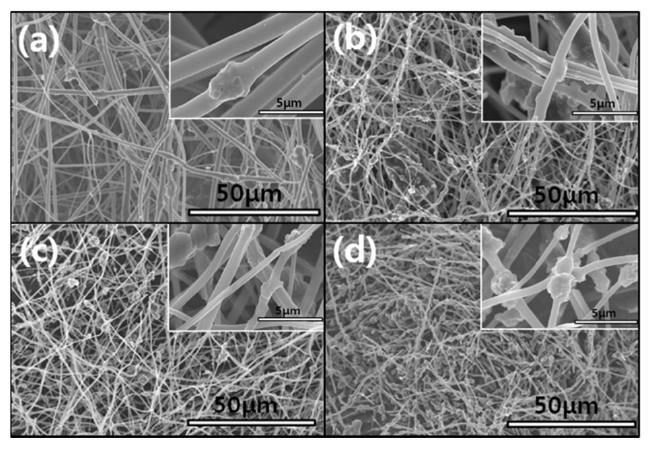
3.1. Morphology analysis of non-woven fibers
Fig. 1 shows the morphologies of the electrospun carbon fibers that were prepared with different ratios of MgO (0, 10, 25, and 50 wt%, based on the amount of PAN). Some beads were detected on the fibers produced in the absence of the MgO. These beads were most likely the result of the pitch not completely dissolved in the THF solvent due to aggregation and the high molecular weight of the pitch molecules. However, the number of beads on the carbon fibers that were produced in the absence of the MgO was very small relative to number on the MgO-containing fibers. Fig. 1b-d shows that the number of beads on the porous carbon fibers produced with the MgO increased with an increase in the percent MgO due to the aggregation of the pitch and the MgO powder. In addition, the quality of the electrospun fibers is related to the instability of the jet of
[Table 1.] Viscosity of the spinning solution and textural properties of the activated samples
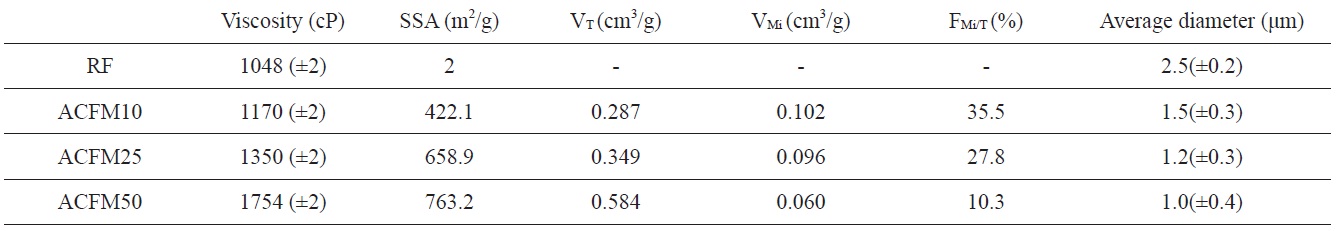
Viscosity of the spinning solution and textural properties of the activated samples
polymer solution and the change in the breakpoint of the surface tension of the Taylor cone. The changes in the concentrations of the PAN, pitch and MgO in the polymer resulted in changes in the solution viscosity. The viscosity change according to the content of MgO powder is shown in Table 1. The surface tension coefficient depends on the polymer, the solvent, and the viscosity. Consequently, beads formed in these samples due to surface tension [18].
The average diameter of each non-woven carbon fiber decreased from 2.5 to 1.0 μm with an increase in the content of MgO powders added to the pitch/PAN precursor solution (Fig. 1). In addition, more beads were observed with an increase in the content of MgO powders added. This unique form, beads strung by fibers, can be attributed to the aggregated MgO powders added to the pitch/PAN precursor solution. In this case, the fiber seems to be formed between electrospinning and electrospraying. The MgO powders are usually placed inside the PAN-based electrospun fiber rather than on the surface of the fiber [19]; the aggregation of MgO powders induced the formation of bead, inducing electrospraying. On the other hand, the pitch/PAN mixture forms fibers by electrospinning between the bead formations. Based on the numbers of beads and the thickness of the fibers, it seems that as more beads formed, thinner fibers also formed.
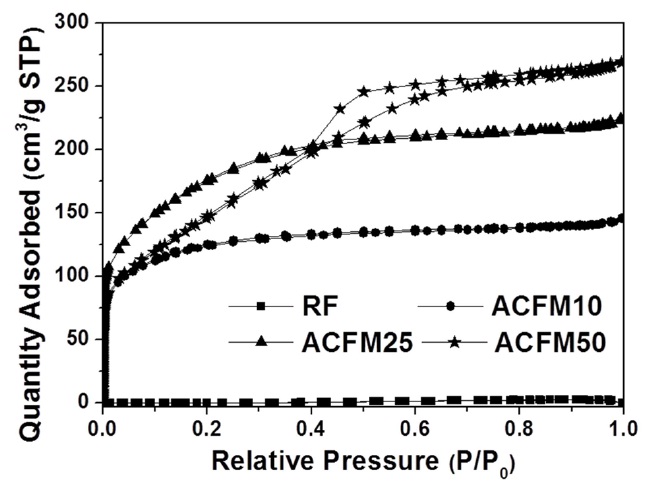
Fig. 2 shows the nitrogen adsorption isotherms for the carbon fibers that were produced in this study. The pore textures of the non-woven carbon fibers changed as a result of the template method that was used. The sample produced without the MgO
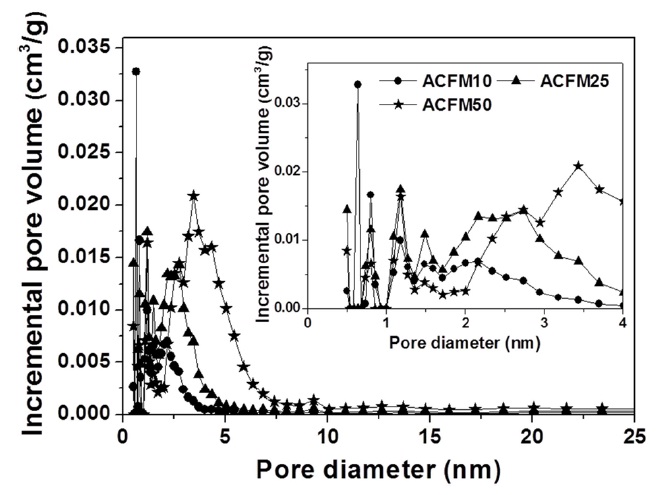
powders (RF) showed no change during the adsorption of nitrogen, which indicated that this sample was non-porous. However, the nitrogen absorption analysis of the samples prepared using this method (ACFM10, ACFM25 and ACFM 50) showed that a greater increase was apparent as the samples were prepared with increasing amounts of MgO. This finding indicated that ACFM10 and ACFM25, which exhibited an inflection point at approximately 0.01 P/P0, are typical type I materials; therefore, these materials are microporous non-woven carbon fibers. In general, an increase in the nitrogen adsorption isotherm curve in porous materials is indicative of the creation of a micropore structure (less than 0.01 P/P0) or a mesopore structure (over 0.01 P/P0) [6]. However, the curve obtained for ACFM50 was a different type of adsorption isotherm curve. The ACFM50 sample showed type VI behavior and a hysteresis loop close to the International Union of Pure and Applied Chemistry (IUPAC) H2 loop [20]. Hysteresis loops are caused by the presence of aggregated powders in the non-woven carbon fibers; therefore, in the case of ACFM50, the hysteresis loop indicates the presence of aggregated MgO powders due to the large amount of MgO that was used. Nano-sized powders (less than 100 nm in diameter), such as metal oxide, cannot be easily dispersed due to the surface interactions between the particles. These interactions contribute to the enhancement and further induction of the aggregation of the MgO particles. The increase in the concentration of MgO would therefore lead to an increase in the aggregation of the MgO particles [21]. Consequentially, the excess amount of MgO in the pitch/PAN/DMF solution that was used for the production of the ACFM50 sample resulted in the formation of clusters, and the subsequent removal of these clusters led to the formation of a complicated pore structure, including the presence of ink bottle pores. The presence of the adsorption/desorption hysteresis loop was caused by the presence of an ink bottle type of pore. Hence, ACFM50 has a mesoporous and microporous nature (micropore < 2 nm, 2 nm < mesopore < 50 nm, 50 nm < macropore). Fig. 3 explains this result in more detail by showing a comparison of the pore size distributions, which were calculated using density functional theory, of the samples prepared using the template method. Fig. 3 shows that the numbers of micropores and meso-
pores were greater in the samples that were produced using the template method than in the non-template sample.
Detailed information pertaining to the textural properties of the samples is also presented in Table 1. The SSA increased from 2 to 763.2 m2/g when using the template method. The micropore volume fractions of the pitch/PAN carbon fibers that were produced using the template method were in the range of 10 to 35%. This fraction increased with an increase in the MgO content (RF < ACFM10). However, the other porous fibers (ACFM25 and ACFM50) did not follow this trend. Because increases in the MgO content used in the production of the fibers can lead to an increase in the amount and size distribution of MgO aggregates, these samples exhibited a more complicated pore structure that was composed of micropores and mesopores; therefore, the measurement of the micropore fraction was not applicable.
3.3. Gas sensing by resistive response
The resistive response of an electrode prepared from non-woven carbon fibers is shown as a function of the time of exposure to NO gas in Fig. 4a. The RF sample exhibited a 0.1% resistive response due to the presence of inactive NO gas adsorption sites and due to the non-porous nature of the material (Fig. 2, Table 1). The development of a porous structure increased the NO gas-sensing capability by approximately 12.5%, as shown by the response measured for the ACFM25 sample. This result implies that the porous structure that is generated through the use of the template method effectively increased the number of gas adsorption sites. The electrical resistance in the ACFM10, ACFM25 and ACFM50 samples significantly decreased by approximately 12%, 12.5%, and 7.7%, respectively, within 3 min. This result is mainly due to the fact that the NO gas molecules were absorbed in the mesopores and micropores of the carbon fibers. Previous studies in this field have reported that NO gas molecules are quickly adsorbed in narrow micropores. In addition, the adsorption of NO gas in micropores is faster than the NO gas adsorption in mesopores [22,23]. As shown in Fig. 4a, ACFM10 has a faster response time than the other samples, which is consistent with the fact that this sample
[Fig. 4.] Resistive response (a) and recovery property (b) according to the time for NO gas sensing.
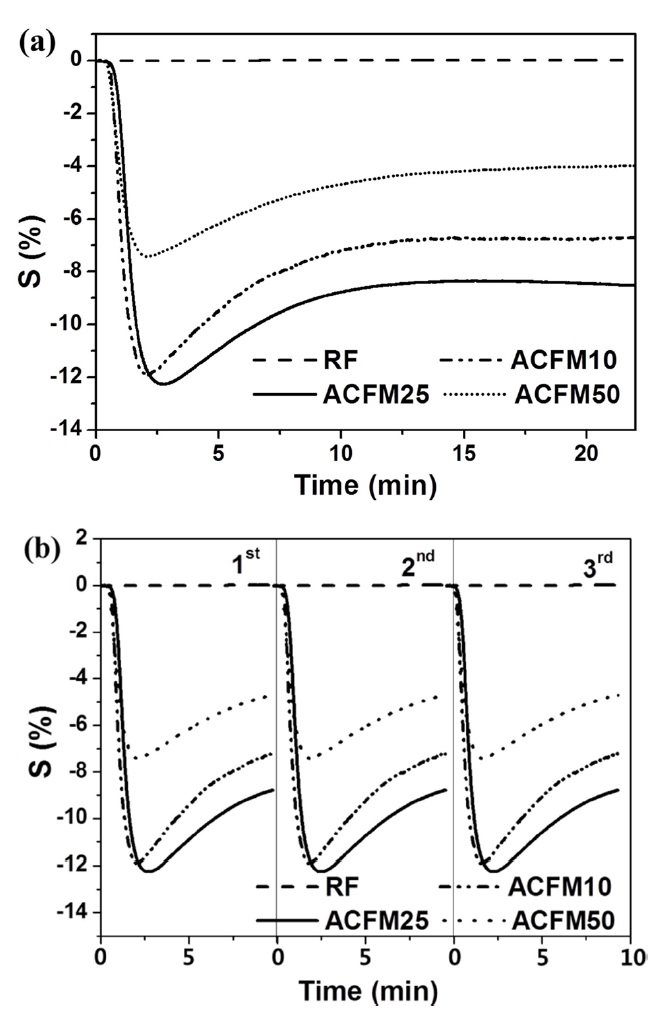
has the largest micropore volume (Table 1). However, because ACFM25 has an adequate SSA and micropore volume for NO gas adsorption, this sample exhibited the lowest resistance. In addition, ACFM10 and ACFM25 exhibited very similar gas sensitivity levels and response times. Therefore, it is very important to optimize the micropore volume fraction and the SSA in porous carbon materials. The electrical sensitivity of these materials was improved by creating a micro-scale pore structure with an adequate SSA.
Fig. 4b presents the gas sensor's recovery property in all samples. Perfect reproducibility was observed in all cases, which is attributed to the excellent gas desorption properties of the carbon materials during the recovery process, which was characterized by a low degassing pressure and a high temperature. This excellent desorption is one of the general advantages of porous carbon materials [22].
A high-performance NO gas sensor was prepared from nonwoven carbon fibers using electrospun pitch/PAN-based fiber embedded MgO as a pore-forming agent. The MgO powders influenced the polymer solvent viscosity and the SSA. An increase in the amount of MgO powders in the pitch/PAN precursor solvents led to the formation of an increased amount of beaded fibers and a greater SSA. The pore structure that resulted from the use of the template method enabled the efficient adsorption of NO gas due to the increased SSA and micropore volume, which resulted in a gas sensor with high sensitivity. Overall, the sensing ability for NO gas was significantly improved through the use of MgO powders in the preparation of the carbon fibers.