Palmaria palmata (Linnaeus) Weber et Mohr (common name Dulse) is an abundant low intertidal and shallow subtidal zone red seaweed in the Bay of Fundy (Taylor 1957, Edelstein et al. 1970, Ffrench 1974, Wilson et al. 1979, South et al. 1988, Vadas et al. 2004). The species is commercially harvested in eastern Canada (MacFarlane 1964, 1966, Ffrench 1974, Bird and Van der Meer 1993, Chopin and Ugarte 2006). The harvesting of Dulse is a significant cottage industry in Nova Scotia (MacFarlane 1964, 1966, Ffrench 1974). The edible alga can be eaten dried or wet, and can be used in cooking (e.g., Rhatigan 2009), and its antioxidant properties may have medicinal benefits (e.g., Yuan et al. 2009, Cornish and Garbary 2010). There have been no significant studies of the Dulse harvest in this area since MacFarlane (1966) and Ffrench (1974), and few ecological studies of Dulse have been conducted in this part of the Bay of Fundy. The ecological studies by Vadas et al. (2004) of algal biomass and production in northern Maine that included extensive data on P. palmata is an important exception.
It is important to examine the abundance of Dulse and its growth patterns in order to evaluate whether the current harvesting activities are sustainable. This is in addition to larger scale management issues that relate to macrophyte management in general (e.g., Chambers et al. 1999). Policies for sustainable development, integrated management, and precautionary approaches are in place under the Canadian Oceans Act (Sharp and Bodiguel 2001); however, there are no legal or management restrictions on Dulse harvesting. Thus, Dulse may be considered an open resource. As a consequence of the lack of regulation of Dulse, the sustainability of commercially harvestable populations of P. palmata on Digby Neck requires study.
The harvest of Dulse on Digby Neck would appear to be sustainable as it has existed on a commercial scale for at least a century (French 1974, Chopin and Ugarte 2006). In the Fundy region, Dulse harvesting is governed by the semidiurnal tidal cycle; harvesters periodically pick the resource during the approximately 7 days during the lowest (spring) tides of the 28-day tidal cycle. The local people and businesses of Digby Neck harvest Dulse during low tides throughout the summer months (Chopin and Ugarte 2006). The method of harvest has low disturbance because it is only done by hand and the rocks are not picked completely clean; only the longer, easily picked fronds are removed, leaving most of the holdfasts and smaller fronds to regenerate. The same beaches are picked repeatedly over the harvest season, and the Dulse has time to regrow between successive spring tides. Unlike Ascophyllum nodosum (Linnaeus) Le Jolis, Dulse is not harvested in vast quantities; the average harvest on the Nova Scotia coast of the Bay of Fundy from 1982-1991 was 2 dry tonnes (Chopin and Ugarte 2006). This is much less compared to the New Brunswick shores of the Bay of Fundy, which, during the same time frame, had an average yield of 38 dry tonnes (Chopin and Ugarte 2006). This difference between the two sides of the Bay Fundy suggests that either the resource in Nova Scotia is much less, or it is not being harvested to its maximal potential. To address the latter issue we carried out field studies on which to base a mathematical model of the harvest. Our study aims to determine the optimal harvest quantities that will maximize yields while maintaining the sustainability of the resource. While this is largely a theoretical study, it is based on actual harvest data conducted during commercial harvesting.
Biological growth processes are modeled in a variety of ways, depending on the characteristics of the system, the availability of data for parameter estimation, and on choices of the modeller (see Edelstein-Keshet 1988 for an excellent overview). In the context of seaweed growth, a wide variety of models arise, depending on the above factors. Where the temporal domain spans years or generations, discrete models are typically used. Discrete models are composed of difference equations, which are recursive relations usually in the form At+1 = f(At), such that the state of the system (e.g., population) at the next time period depends on some function of the current state of the system. Conversely, for temporal domains lacking a generational structure (e.g., growth within one season), continuous models are appropriate, and lead to differential equations in the form dp / dt = f(p,t).
The dimension of the model is governed by the structure of the seaweed population modeled. Total biomass (i.e., production) models (e.g., Seip 1980, Lee and Ang 1991) represent the entire population by one variable, whereas populations that contain a class structure lead to higher-dimensional models (Ang and De Wreede 1990, Nyman et al. 1990, Aberg 1992a, 1992b, Duarte and Ferreira 1997, Santos and Nyman 1998). Common classes include age (‘age-structured models’), size, or developmental stage. The models that result from this classification generally include a system of difference or differential equations, with one equation per class.
For growth of a population subject to environmental limitation, the most basic and widely used model is the logistic model (Tsoularis and Wallace 2002), originally developed by Verhulst (1838). The central assumption of this model is that the relative growth rate (percentage growth per unit time) decreases as the population approaches its environmental carrying capacity; the simplest assumption which leads to the classical logistic model is a linear decrease. Evidence of logistic-type growth in seaweeds include reports of increased growth rate attributed to reduced standing crop post-harvest for kelp (Smith 1986), and growth curves of Ascophyllum nodosum (Linnaeus) Le Jolis that are well-approximated by a logistic curve (i.e., of sigmoid type) (Baardseth 1955). More recently, in cultivation bags of Palmaria palmata, frond growth decreased with increased frond density (Martinez et al. 2006). Both continuous (e.g., Seip 1980, Lee and Ang 1991) and discrete (Scrosati 2004) logistic growth models have been applied to seaweeds.
Logistic models are parameterized by the intrinsic growth rate, r, and carrying capacity, K, the values of which vary according to species and environment. In one tank-cultivation study, P. palmata, cultivated at a density of 4.2 kg m-2, had maximal yield of 609 g m-2 per day, and a maximal growth rate of 12% per day (Pang and Luning 2004). Lower growth rates of 2-8% per day were obtained by Morgan and Simpson (1981a, 1981b). In an open-sea cultivation study, the maximal growth rate of Dulse was 14% of the initial fresh weight per day (Martinez et al. 2006). On the other hand, in the natural environment, maximal specific growth rates reported range from 0.89% (Northern Ireland unpublished) to 1.5% (Spain) (Faes and Viejo 2003).
We construct a one-year, continuous logistic growth model for the growth of P. palmata on Digby Neck. We
then investigate the effects of harvesting on the resource, both in the context of the current harvest, and the optimal harvest possible.
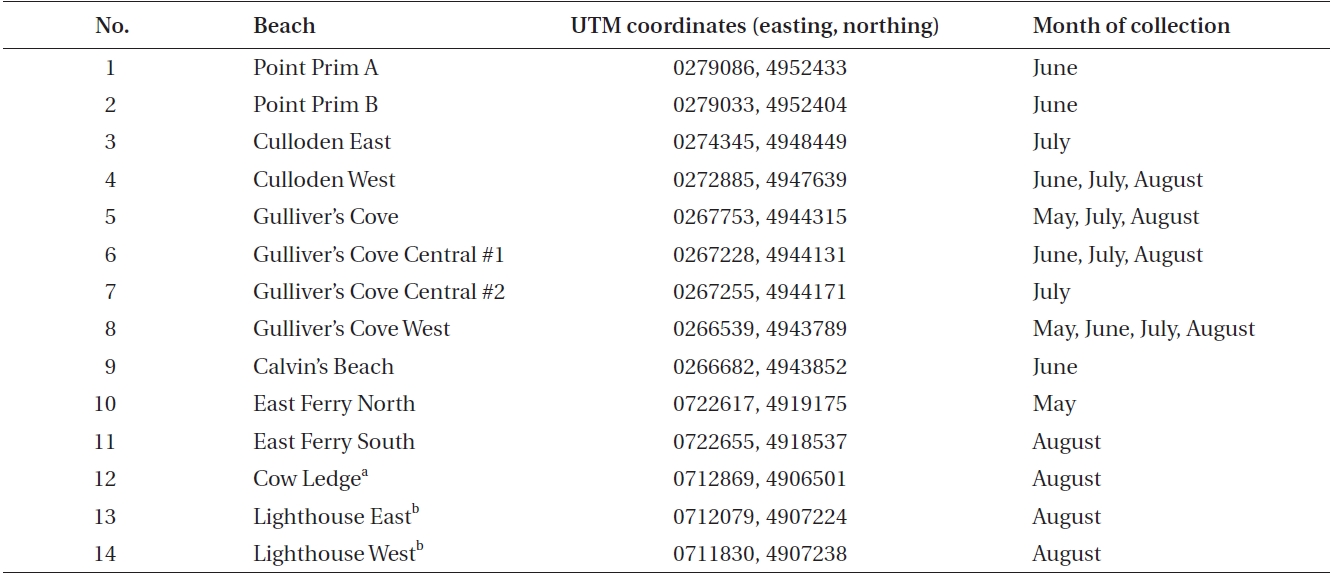
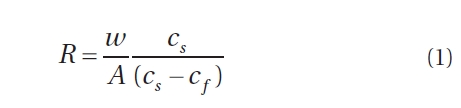
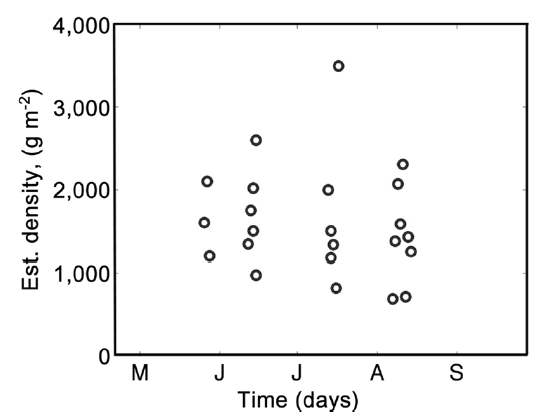
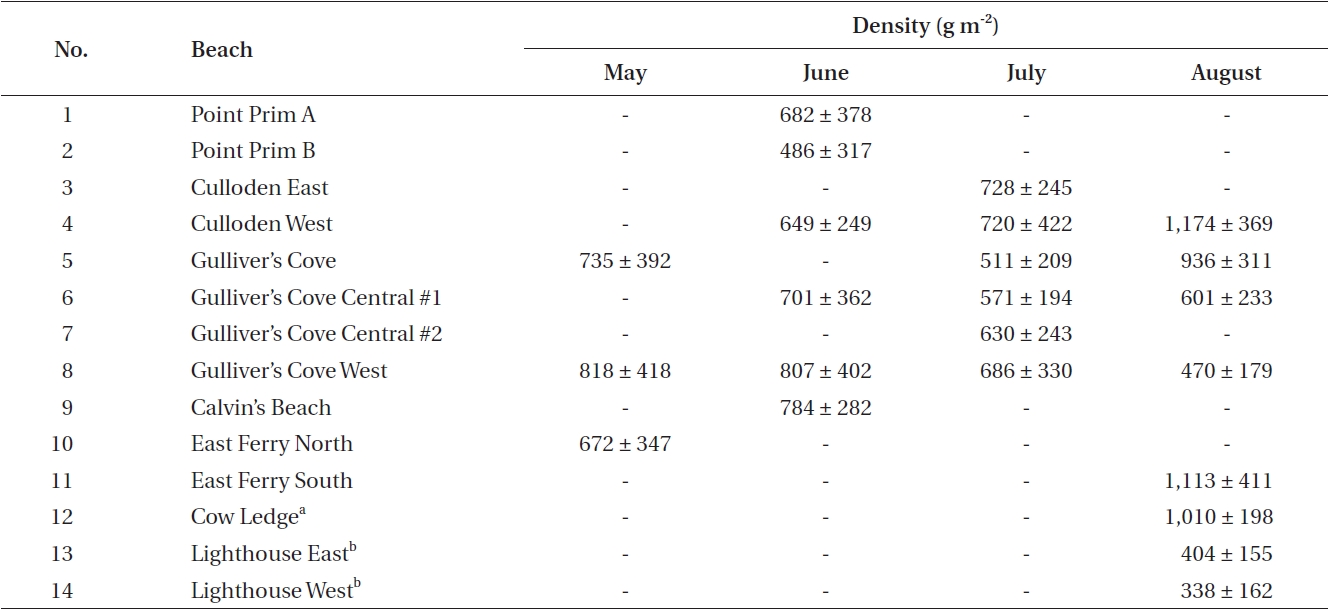
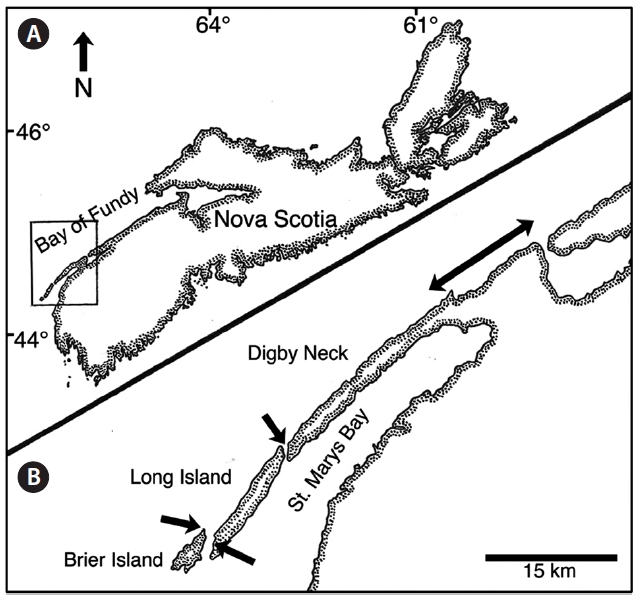
Data was collected during the one-week period of the spring tides of each month from May to August along the western coast of Digby Neck (Table 1, Fig. 1). These months span the primary period of the Dulse harvest with reduced harvesting extending into September and early October depending upon weather conditions. During each low tide series, beaches were accessed by foot or with local Dulse harvesters by boat. Beach and transect locations were recorded using a hand-held GPS (Garmin etrex, Olathe, Kansas). Arrival time at the beach was approximately one hour before the documented time for low tide (http://www.waterlevels.gc.ca/english/Canada.shtml) using Saint John (NB), Digby (NS) or Westport (NS) as reference ports. Twenty-five rocks on each beach were picked by hand to the extent demonstrated by a local harvester. Before- and after-harvest percent cover of Dulse on each rock was recorded (cs, cf, respectively) as well as the size of the rock being picked. As the Dulse was picked, it was put into a mesh onion bag, swung to remove excess water, and weighed using a 2,000 g spring scale (Stansi Scientific Com, Chicago, IL, USA) with a resolution of 25 g. Resource density, R was obtained by taking the quantity of resource harvested divided by area (w/A) and then scaling by the inverse of the relative fraction of Dulse cover picked, via
Thus R represents the approximate total available resource (how much would be harvested should all the Dulse be removed from a 1 m2 patch). R was calculated for each rock measurement, and the median value of these measurements was taken for each shore (Fig. 2). By averaging all the data, a carrying capacity for P. palmata on Digby Neck was estimated.
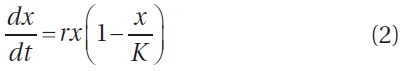
To understand the growth dynamics and potential harvest of P. palmata, we construct a model for one-year growth in a domain of size 1 m2, which is meant to represent an average patch of the resource in the harvest area. As a starting point, we assume that the growth dynamics are well approximated by the classical logistic model
where x (grams) is the amount of the resource, r (percent/day) is the fixed per-capita growth rate throughout time, and K (grams) is the carrying capacity; in this context, the amount of the resource found on an unharvested 1 m2 patch is assumed to have grown to maturity.
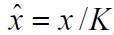
To decouple the model results with the estimated carrying capacity, the logistic model is non-dimensionalized via the substitution
, in which case Eq. 2 reduces to
where ^ notation has been removed for simplification, and x is now interpreted as the unitless fraction of the carrying capacity K for P. palmata, and therefore, x ranges between 0 and 1, assuming the initial resource density is below K.
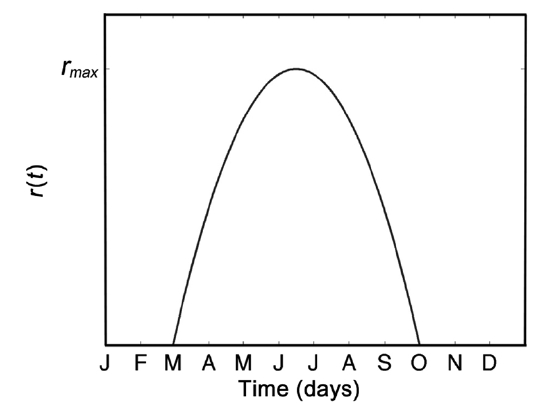
Environmental factors such as light level, water temperature, average wave height, etc., result in an intrinsic growth rate that is time-dependent (Faes and Viejo 2003). For instance, unpublished data from Northern Ireland showed that Palmaria palmata exhibited dominating growth in the summer months, whereas dominating decay through frond breakage occurred from August to March. Therefore, the assumption of fixed per-capita growth rate r must be modified, and a suitable r(t) constructed. Our model does not require growth between October and February inclusively as this is largely a period of large frond reproduction and senescence, and initiation of small fronds. For the remaining months, we approximate r(t) with the quadratic function (Fig. 3), leading to
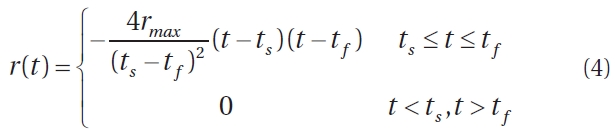
where rmax is the maximal per-capita growth rate, and ts and tf are the day of year for which positive new growth starts and finishes, respectively. We set ts = 59 days and tf = 273 days (a total of 214 days) to correspond to positive growth during March through September inclusively. Vadas et al. (2004) estimated a frond generation time
of 30 days, and observed growth for 7 months (roughly 210 days). We cannot estimate per-capita growth rate for the resource in the Fundy region because data were not collected at precisely the same location across monthly harvests. Thus, we let rmax vary over the range [0.04, 0.15], which corresponds to a range of 4 to 15% daily growth. The minimum rmax value (4%) was chosen because it corresponds to approximately 50% logistic regrowth of the resource over the 28 day harvest cycle, assuming half the resource has been previously harvested, which is lower than observed regrowth in the data collected. Fifteen percent was chosen as an upper limit, somewhat higher than the maximal recorded growth rate of 14% (Martinez et al. 2006).
Next, Eq. 3 is modified to include the effect of a harvest, giving
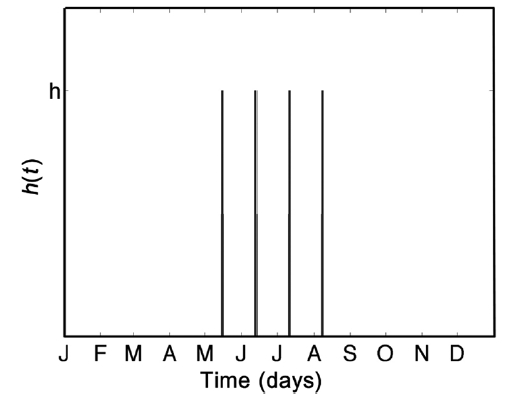
where h(t) (per day) is a time-dependent harvesting policy. To model the harvesting cycle that takes place in the Fundy region, a periodic proportional impact-harvest function h(t) is used such that a constant fraction f of the resource is harvested at regular 28-day intervals. The fraction h is collected during one time-step of the model, as opposed to harvesting over a 7-day period because we are modeling a hypothetical 1 m2 patch, which can be effectively harvested instantly, relative to model timescales. Fig. 4 demonstrates the four annual harvests that occur once a month on a 28-day cycle between May and August inclusively. Although a positive per-capita growth of the resource is observed through September, there is typically little harvest in this month due predominantly to cultural and customary reasons and vagaries of weather.
The total annual yield per square meter of resource x(t) is defined as y = ∫h(t)x(t)dt. To obtain actual yield in grams, values can simply be scaled by the carrying capacity; i.e., Ky.
For a given value of rmax, total yield is the result of a trade-off between the frequency of harvesting and the harvest fraction h. To investigate the relative productivity of the current Fundy Dulse harvest, optimal harvesting strategies h(t) are investigated under two assumptions: a fixed growth rate [r(t) = r, as in Eq. 2], for which analytical results are available, and the more realistic time-dependent growth rate r(t) as in Eq. 4. It is assumed that n harvests occur at equally spaced time intervals throughout [ts, tf] and for each, a constant fraction f of the resource x(t) is harvested. Harvest frequency n = 1, 2, . . . , 20, and the harvest fraction h is varied over the interval [0, 1]; no harvest to complete harvest.
To study optimality in the context of the Dulse harvest, the harvest period is modified to the typical summer harvest season May-August, in which it is assumed that n harvests of constant fraction h occur at equally spaced time intervals throughout the period. As done previously, rmax is varied as a model parameter.
Mean densities for each site time sample are given in Table 2. In May, the three sampled shores had a mean density of 740 ± 75 g m-2 (mean ± standard deviation [SD] with values round to nearest 5 g). In June, six beaches were visited, two of which were along the same shoreline (Point Prim A and Point Prim B). Density dropped slightly to 685 ± 115 g m-2, but there was no significant difference between months (p > 0.05). Six beaches were also surveyed in July, with a mean density of 640 ± 87 g m-2. This, again, was lower than the previous month, but was most likely an underestimate because partial harvesting occurred on some beaches before data collection. There was no significant difference between the densities of beaches in June and July (p > 0.05). Eight beaches were sampled in August, two of which were from Brier Island and are non-harvested shores with low densities. Thus mean density of 755 ± 340 g m-2 is an underestimate of
biomass available for harvest on harvest shores. Again, this value is not significantly different than in July (p > 0.05) even when the two Brier Island samples are omitted.
The pre- and post-harvest cover of P. palmata were calculated at cs = 0.795, cf = 0.419 respectively. Over all the surveys, the average harvest fraction was h = 0.478, and the average total resource was R = 1,601 g.
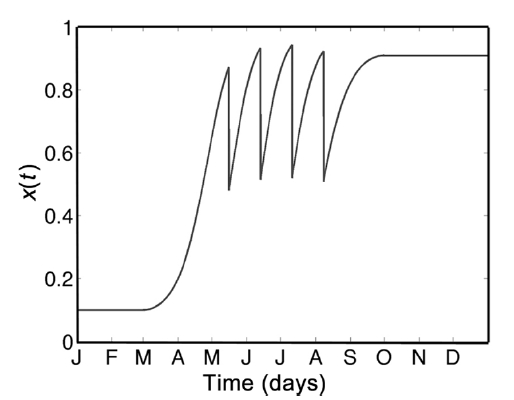
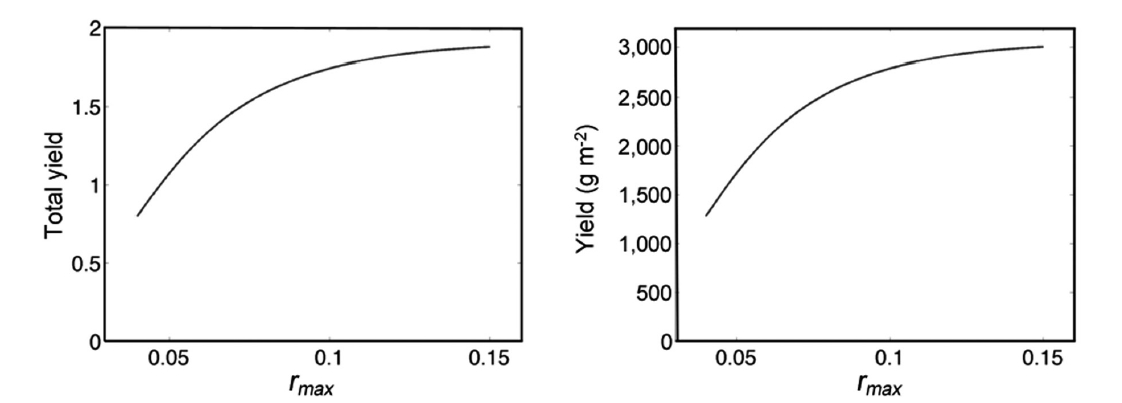
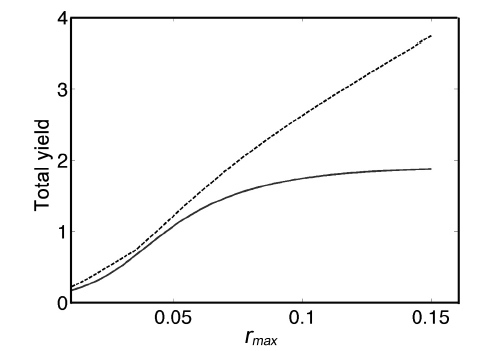
Fig. 5 demonstrates annual growth with rmax = 0.10. The total yield y, as a function of rmax is asymptotic to 4h = 4(0.478) = 1.912 for increasing values or rmax. Using the carrying capacity estimate K = 1,601 g, we show actual yields (g m-2) in Fig. 6.
For r(t) = r, analytical conditions of optimality have been derived in Zhang et al. (2003). Specifically, for a given value of r, the optimal harvest fraction depends on the harvest frequency n via
h* = 1 ? e-rT/2 (6)
where T = (tf ? ts)/n is the period of the harvest. Thus, as n increases, optimal harvest fraction is reduced, as intuition suggests. Although there are inherent difficulties in applying this optimality condition to the Fundy harvest, as the assumption of fixed growth rate is not realistic, nevertheless choosing T = 28 gives an optimal harvest fraction of h* that increases from 0.429 to 0.877 as r increases from 0.04 to 0.15. The long-term (sustainable) yield per unit time for this model is (Zhang et al. 2003):
To obtain an approximate total seasonal yield (neglecting effects of initial quantity of the resource), the quantity
in Eq. 7 is multiplied by tf ? ts. Again, limitations arise in applying this analytical result to the Fundy harvest, yet for 4 harvests of period T = 28 days, tf ? ts= 112, and total yield ranges from 1.043 (r = 0.04) to 2.98 (r = 0.15).
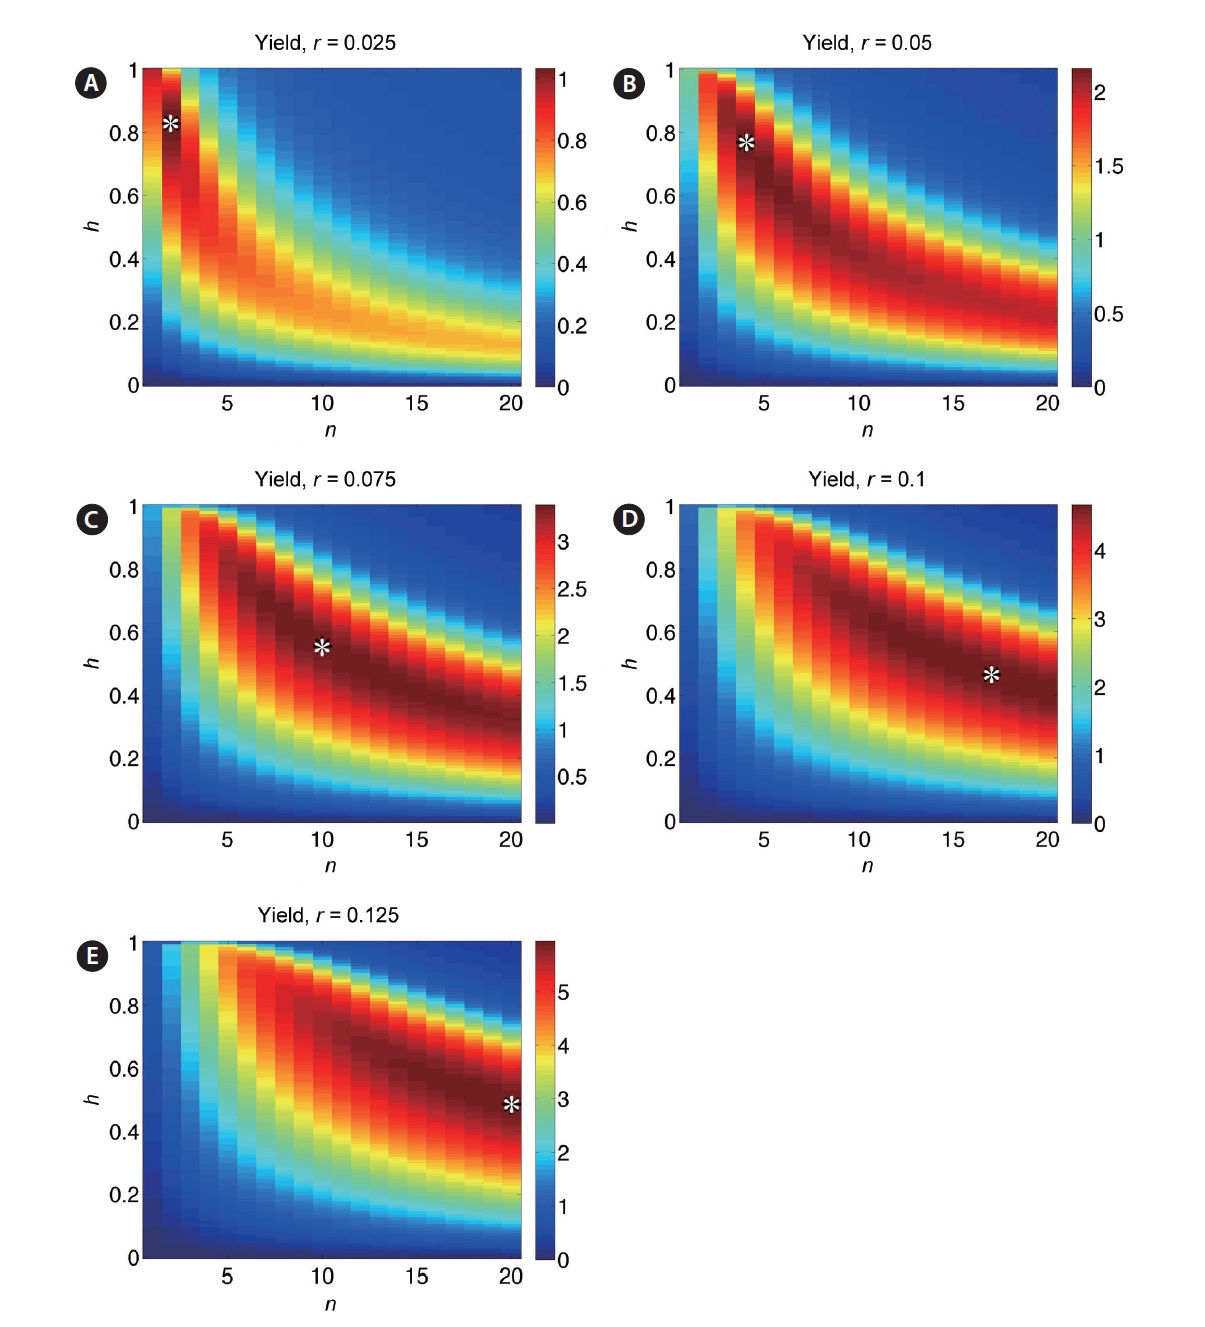
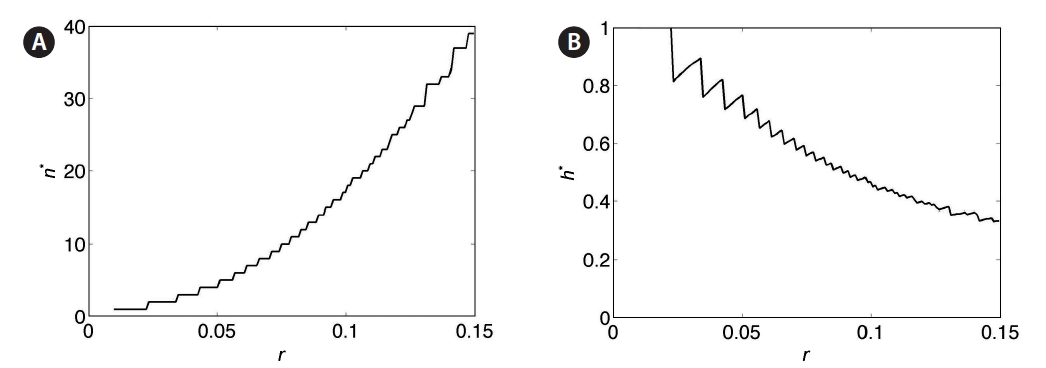
For a clearer picture of how optimal yield depends on harvest fraction and number of harvests, simulations were performed over a range of values of the parameters h, n, and r. Yield is plotted as a function of both harvest frequency n and fraction h for r = 0.025, 0.05, 0.075, 0.10, and 0.125 in Fig. 7A-E. The yield value at a given (n, h) is represented by the color at that point. Values of parameters n and h corresponding to the optimal yield are denoted by (n*, h*). These plots demonstrate the trade-off between n and h: highest yields occur at frequent small-fraction harvests, infrequent large-fraction harvests, or some intermediate combination. Contour lines indicate that this trade-off is sharpest at low n values, in keeping with the negative exponential trade-off function in Eq. 6. For smaller values of r, yield is more sensitive to changes in (n*, h*) (Fig. 8A & B). The non-smooth nature of these plots stems from the discrete variation of the parameter n, which must take on integer values. Clearly, higher r leads to optimal harvests of increasing frequency (n) and decreasing fraction per harvest (h).
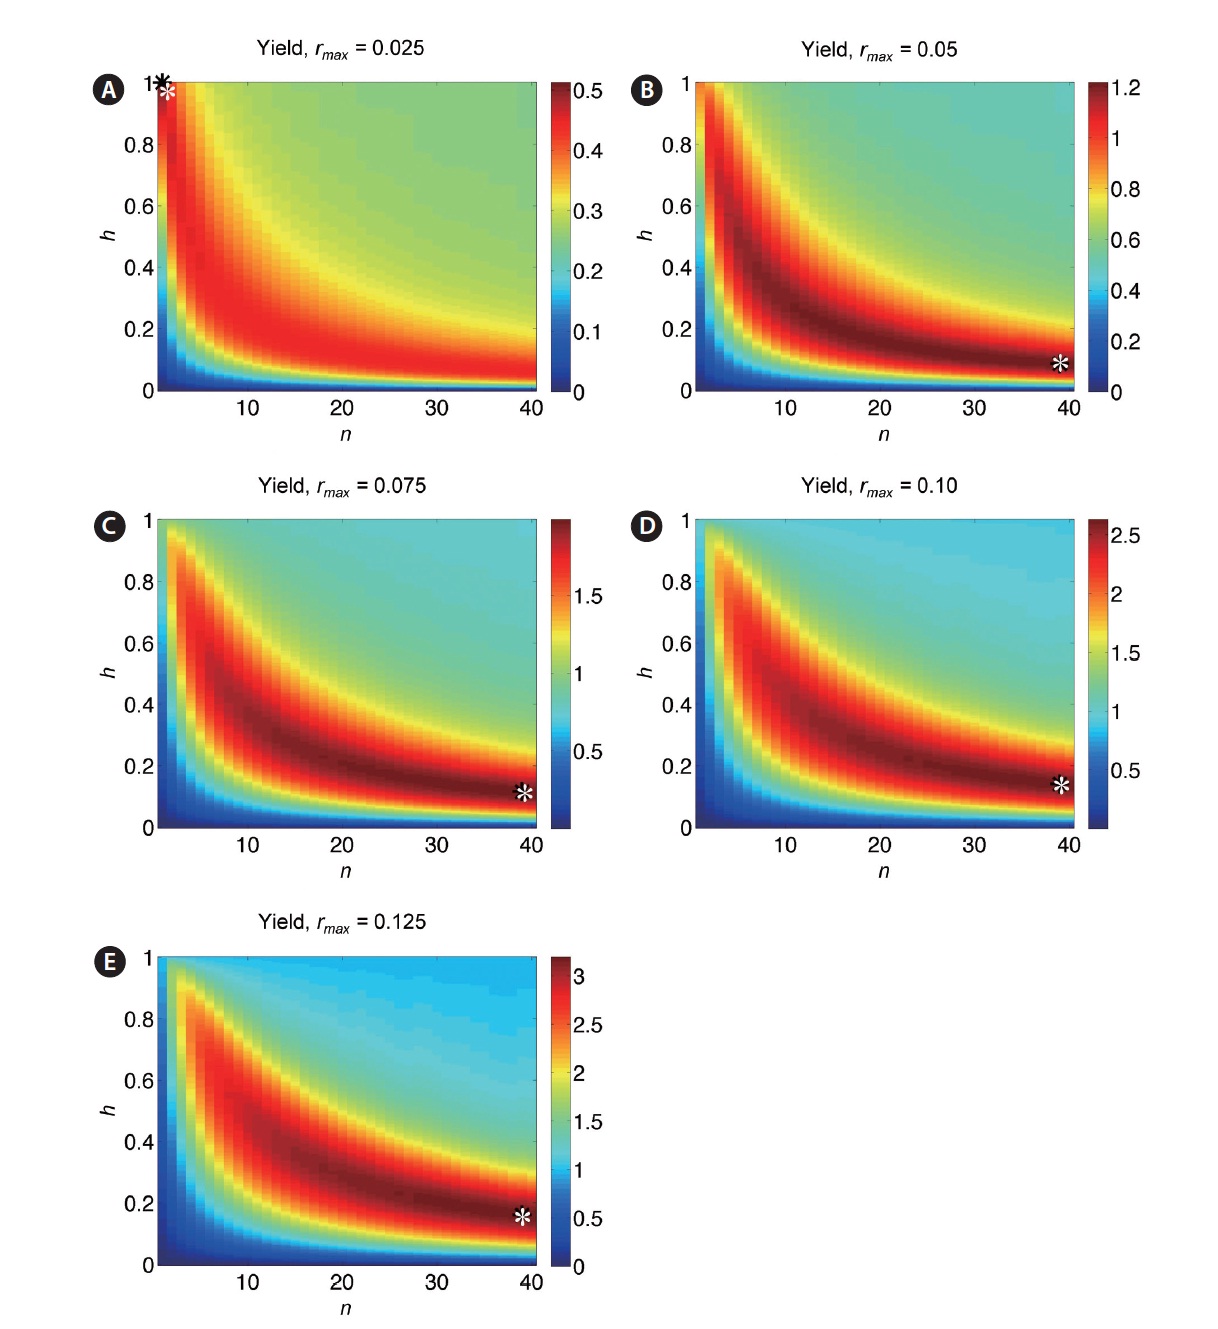
When the time-dependent growth rate r(t) (Eq. 4) is incorporated, analytical results are no longer available, although optimal harvest fraction / frequency trade-off is qualitatively similar (Fig. 9A-E). Overall yields are reduced due to the lower average growth rate, and optimal harvest for intermediate and high values of rmax are obtained by more frequent, low-fraction harvests (limited in these plots by chosen range n). For both fixed r and time-dependent r(t), Figs 7 and 9 indicate that yields very near the optimal are possible for a broad combination of n and h values, so long as the exponential-type trade-off rela-tionship is obeyed.
Optimal yields are greater than yields on Digby Neck and Islands (as expected), but only slightly for low values of rmax (Fig. 10); e.g., for rmax < 0.05, the Fundy harvest is sub-optimal by no more than 0.175 K per m-2, or approximately 280 g m-2. As rmax increases, the harvest yield diverges from the optimal yield due to the increased benefit of more frequent harvesting due to the higher growth rate; e.g., for rmax = 0.10, the Fundy harvest yield is 0.888 K per m-2 less than the optimal yield, or approximately 1420 g m-2 less.
Palmaria palmata is a perennial, clonal species in which thalli can survive for more than one year, and form fronds that successively grow, reproduce and senesce from a holdfast that survives multiple years (i.e., a pseudo-perennial) (Garbary 1976, Vadas et al. 2004). The basic phenology of the species on Digby Neck is one where thalli grow vegetatively through the winter, spring and summer producing numerous fronds from a discoid holdfast. During late summer and fall fronds become increasing reproductive with spermatagia or tetrasporangia. Over the winter many large reproductive fronds may remain in the population, but as these fronds senesce the population becomes increasingly dominated by the new fronds developing from the holdfasts (Garbary et al. 2012, Katelyn White unpublished data). We do not have sufficient information on the relative importance of vegetative regeneration from holdfasts (vs. reproduction through tetraspores) to effectively study the population from a multi-year perspective. Also, at established locations, it appears that growth is predominantly from exist-
ing holdfasts; accordingly, the ‘spread’ of the resource in space across generations is not modelled, and our time period is limited to one season. Furthermore, the specialized life history of P. palmata with its microscopic female gametophytes and absence of carposporophytes (Van der Meer and Todd 1980, Gabrielson and Garbary 1986) have not been studied in terms of perennation or colonization. While these are important constraints on the basic ecology of the species, they do not alter the key elements of our model.
Within one growth season, there is not a clear discretization of growth phases; we, therefore, opt for a continuous model over a discrete model. Because we have neither growth rate data nor frond size distributions throughout the growing season, we lack sufficient data to incorporate a class structure into our model. If we were to do so, the obvious choice would be frond size-classes; then harvest strategies that are based on picking particular-sized fronds could be investigated.
The chosen range of maximal growth rate is most likely larger than the actual range; 4% is lower because, according to the data, almost complete regrowth takes place over the harvest cycle, while the maximal growth rate used in this model (15%) is greater than that found in the literature for both cultivated and natural growth. The range of growth rates is higher than that recorded from some non-aquaculture field samples, e.g., Faes and Viejo (2003), suggesting the growth rates for P. palmata in the Fundy region significantly exceed those in other regions (e.g., Spain, N. Ireland).
The most detailed evaluation of in situ productivity of P. palmata comes from Cobscook Bay in Maine (Vadas et al. 2004). Their values for biomass at three sites of about 25-120 g dry wt m-2 from June to August converted into 34-240 g dry wt m-2 y-1 at their low site (mean minimum and maximum), to 119-830 g dry wt m-2 y-1 (mean minimum to maximum) for the most productive site. Using a 1 : 10 ratio of dry to wet mass, the productivity of Cobscook Bay P. palmata (up to 8,300 g wet wt m-2 y-1) seems much higher than for Digby Neck (i.e., between 1,250 and 3,060 g m-2 y-1, depending on growth rate). The reconciliation of the two studies is derived from the complete replacement of frond biomass each month over a seven month period (Maine) rather than our four months of our harvesting in which only 50% of the material is removed at each sampling. We also consider our value of 1,600 g wet wt m-2 y-1 an underestimate based on the fact that some of our beaches had previously been harvested when our quantification had occurred. Furthermore, the values from Vadas et al. (2004) are for average m2 on the shore whereas our data is from harvested boulders that do not comprise 100% of the shore. Incidental observations of P. palmata populations on Digby Neck in 2011 suggest that large biomasses continue into September and October that remain unharvested (Garbary unpublished observations).
Total harvest yield for a range of growth rates were obtained using the model based on the estimated carrying capacity K = 1,601 g. However, this value is an underestimate of the actual carrying capacity of the resource because, especially in July and August, some beaches were surveyed after partial harvesting had taken place, because of the time restrictions placed upon the harvesting by the tides, and because several of the beaches included in the model are not currently harvested.
In order for the Dulse industry of Digby Neck to expand, the growth rate of the Palmaria palmata in the region must first be determined as the combination of harvest frequency and fraction, and total optimal yield are dependent on rmax. Our model is based on quadratic growth of P. palmata from March to September inclusively, therefore, in the spring and fall, the maximal growth rate is less than in mid-summer. We have demonstrated that at low maximal growth rates, the current harvest yields are slightly less than the optimal yields. During mid-summer, however, when growth rates are higher, harvest yields are much less than the optimal yields. Our model predicts that in order to maximize yields when maximal growth rates are high, harvesting should occur at very high frequencies, and only small fractions of the standing population should be removed. However, this is unrealistic based on the time constraints of harvesting at low tides, and the 7-day duration of the spring tides. This could be compensated for by adding harvesters, but, if there are more people, each removing a small quantity, it may not be profitable for the individuals. However, our model also showed that larger fractions, taken at only moderately higher frequencies than exist currently, result in yields not significantly lower than the optimal yield.
The two intertidal seaweeds with commercial harvests in Nova Scotia and New Brunswick are Ascophyllum nodosum and P. palmata. These seaweeds have radically different patterns of government regulation and resource management. The A. nodosum industry is highly managed with 90% of the harvest licences granted to Acadian Seaplants Ltd., and the resource base is carefully monitored to ensure that only 17 and 25% of biomass is harvested annually in New Brunswick and Nova Scotia, respectively (Ugarte et al. 2009). The Dulse harvest is unregulated, without harvest licences or official monitoring. Given the extreme difference in management strategies, it is of interest that both resources appear to be equally sustainable. This is especially surprising for P. palmata given the paucity of study of the regional ecology in the context of resource management. Indeed, the current study, and the related paper by Garbary et al. (2012) are the first detailed studies of Dulse ecology in Nova Scotia, and the first to document the state of the resource rather than simply harvest amounts (e.g., MacFarlane 1966, Ffrench 1974) or growth rates based on tank cultivation (e.g., Morgan et al. 1980, Morgan and Simpson 1981a, 1981b, Corey et al. 2011).