Understanding of the variation in the atmospheric en-ergy circulation and water circulation systems is impor-tant in observing global climate change and improving the accuracy of numerical weather prediction models.Water vapor serves as a factor that causes the atmospheric circulation since it transmits energy in the form of latent heat, which heats the atmosphere when released as water vapor as it undergoes the process of condensation. Thus,understanding of the water circulation process in the climate system is needed to predict the climate change caused by natural or artificial activity, and accurate wa-ter vapor observation is necessary for this (Labraga et al. 2000). Total precipitable water (TPW) is expressed as the weight of the total water vapor contained in a vertical column as it is converted to the liquid phase. The repre-sentative TPW observation method to employ a radio-sonde, but it has temporal and spatial limitations since the observation is performed 2-4 times per day. On the contrary, satellite-based remote sensing enables global atmospheric observation and provides observation data for the scanned area. Hence, due to its importance, the space-based monitoring technique is being developed for the observation of climate change and the improve-ment of numerical weather prediction models.
Aqua (EOS-PM1), which is the follow-up satellite of the Terra (EOS-AM1) satellite, is aiming at the understand-ing of the interaction between the ocean and the earth's surface and the observation of the earth environment in search of the causes of the interaction. The payloads of the Aqua satellite are six high-technology weather ob-servation sensors including the atmospheric infrared sounder (AIRS) which is an all-weather atmospheric ver-tical structure probe, the Advanced Microwave Sounding Unit (AMSU) for all-weather vertical temperature prob-ing, the Humidity Sounder for Brazil (HSB), the Advanced Microwave Sounding Radiometer for EOS (AMSR-E) for the observation of sea surface precipitation intensity and the Clouds and the Earth Radiant Energy System (CE-RES) for the observation of the gross terrestrial thermal radiation balance as well as Moderate Resolution Imaging Spectroradiometer (MODIS) on the Terra satellite. The observation data from these sensors are provided free of charge. The TPW and water vapor profile are provided in the level 2 standard retrieval of the AIRS/AMSU/HSB sensors (AIRS L2 standard retrievals, hereafter) (National Aeronautics and Space Administration, AIRS Homepage).
In order to use the TPW data acquired from the satel-lite, the accuracy should be validated by comparison with measurements acquired by other equipment. There are a number of previous studies on the accuracy verifica-tion of AIRS TPW data using radiosondes and numerical models (Fetzer et al. 2003, Divakarla et al. 2006, Pierce et al. 2006, McMillin et al. 2007). According to the results of previous studies, the AIRS TPW data showed that they are wetter at low altitudes (800 hPa) and drier at higher alti-tudes (300~600 hPa) when compared with the results of numerical models (Pierce et al. 2006), and the accuracy was about 15% within the altitude rage of 2 km from the ground surface (Divakarla et al. 2006). However, since the accuracy verification results from the previous studies are focused on the tropical region (Pierce et al. 2006) or Eu-rope and the USA (Fetzer et al. 2003, McMillin et al. 2007), there have been no sufficient verification researches con-ducted specifically for the observation environment in Korea.
In this study, we estimate the global positioning system (GPS) TPW data over the South Korean area to evaluate the accuracy of the AIRS TPW data and performed a compar-ative analysis of the accuracy of the TPW data. Generally, a radiosonde is employed for the verification of the AIRS TPW data accuracy. However, it is not easy to compare the AIRS data with the radiosonde data for the same time pe-riods. Hence, we used GPS-based estimates of TPW which
[Table 1.] Locations of permanent GPS sites used in this study.
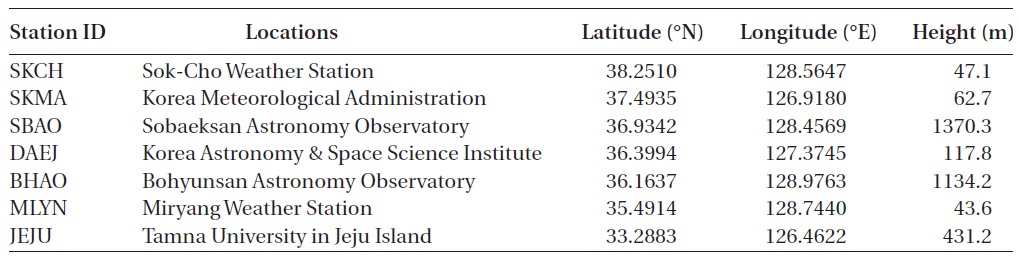
Locations of permanent GPS sites used in this study.
provide accurate and precise results with respect to mea-surements of radiosondes (Bevis et al. 1992, Rocken et al. 1995) and allow 24-hour continuous observation. To evaluate the accuracy of the AIRS TPW data over South Korea, we used the data from the permanent GPS stations being operated by the Korea Astronomy and Space Sci-ence Institute (KASI). The KASI GPS sites are equipped with the GPS-exclusive weather sensor whose model is MET-3A produced by Paroscientific Inc. The comparative analysis was performed between the TPW data acquired using the AIRS IR-only data (AIRS-I) and the TPW data generated from the data prepared by combining the AIRS IR-only data and the AMSU sensor data in order to cor-rect the effect of clouds (AIRS-X). The error estimates and the TPW results were compared to analyze the accuracy of the AIRS L2 standard retrieval products, and the bias, root mean square error (RMSE) and correlations with reference to the GPS data were analyzed. Additionally, to compare the seasonal characteristics particularly shown in South Korea, we analyzed the accuracy in terms of the annual and seasonal means for one year in 2008.
2. DATA COLLECTION AND ANALYTICAL METHODS
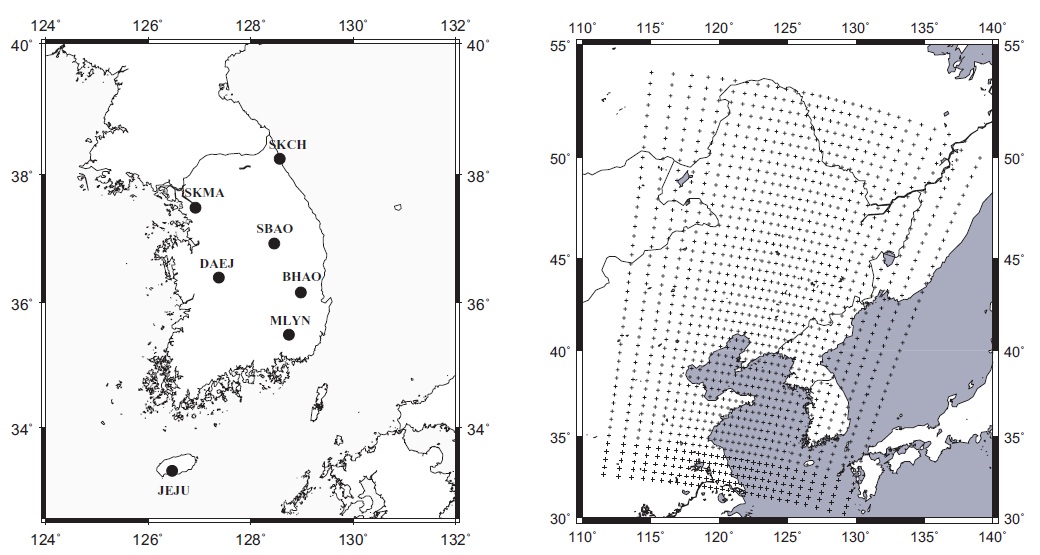
To compare the TPW provided as AIRS L2 standard re-trievals with the GPS TPW, we extracted the AIRS-I and AIRS-X data with reference to the position of the perma-nent GPS. Among the nine GPS stations of the KASI, the data from seven stations were used except the Koheung (KOHG) and Mokpo (MKPO) stations. Those two sites were excluded from the analytical subjects because the KOHG station was recently established in June 2008, and the weather data of the MKPO station contained errors. Table 1 lists the names and coordinate values of the sta-tions and shows that the GPS sites are distributed over a wide range of altitudes.
Fig. 1 shows the positions of the permanent GPS sta-tions used for the analysis (left) and the footprint centers
of the AIRS L2 standard retrievals provided from the 178 granules on January 5, 2008 (right). The granule-based file provided in the hierarchical data format gives the observation data for six minutes, containing a total of 45 scan lines with 30 footprints in each scan line (Olsen et al. 2007). The footprints of the Aqua are at an equal in-terval in the orbital direction (latitude) due to the cross-track scanning method, while the distance between two footprints is increased as their distance from the center is increased in the scanning direction (longitude). In the research area, the interval between the AIRS footprints is 55 km in the latitude direction and 40-105 km in the lon-gitude direction.
To compare the TPW data acquired from different in-struments, the horizontal interval between the two ob-servation instruments were limited to 50 km so that the TPW variation depending on the interval to be minimized (Park et al. 2008, Wang & Zhang 2008). For this purpose, the AIRS L2 data at the footprint nearest to the GPS sta-tion within the range of ±0.5° latitude and longitude were extracted and used for the analysis. The subject TPW data were selected with reference to the flag informa-tion contained in the AIRS L2 standard retrievals. The flag information as well as the TPW estimates represents the quality of the data: The “best” state is expressed as "0", "good" as "1", and "not to be used" as "2". In this study, we used only the observation data having the flag value of“0” and “1”.
The AIRS L2 standard retrievals were calculated by the JPL data processing algorithm version 5. The GPS TPW data were generated with the GIPSY-OASIS 5.0 software (Webb & Zumberge 1993). Due to the limit of the pages, the detailed method to calculate the GPS TPW is replaced by a reference (Ha et al. 2007). The GPS TPW had the time interval of five minutes, and the data were used for the analysis through a linear interpolation with reference to the time of the observed AIRS TPW. The GPS TPW is generally expressed as precipitable water vapor (PWV), which is converted to the unit equal to that of TPW by dividing the value with the density of water. In other words, the TPW value of 1 kg/m2 corresponds to the PWV of ~ 1.002 mm. In this study, all the values were generated in the unit of TPW. Some of the references of this article mention PWV in the unit of millimeters (mm), but it can be considered as equal to the TPW value.
3. COMPARISON OF THE ACCURACY AMONG THE AIRS L2 STANDARD RETRIEVALS
The TPW of flags 0 and 1 was generated from the AIRS data over the Korea Peninsula in 2008 and 394 AIRS-I data and 390 AIRS-X data, on average, were gathered from the seven permanent KASI GPS stations. Only those mea-surements taken in the same time range were used for the analysis. After this procedure, an average of 361 data was selected for the final analysis. It is known that the GPS or radiosonde PWV values over the Korea Peninsula do not go below the minimum of 0 mm in winter and exceed the maximum of 100 mm in summer (Kim et al. 2009, Sohn & Cho 2010). The AIRS TPW obtained using the flag infor-mation was also within the range of 0 from 100 mm. For the seasonal analysis, the data from the months of June, July and August were used for the summer analysis, and the data from the months of December, January and Feb-ruary were used for the winter analysis.
3.1 Comparison of the TPW Error Estimate
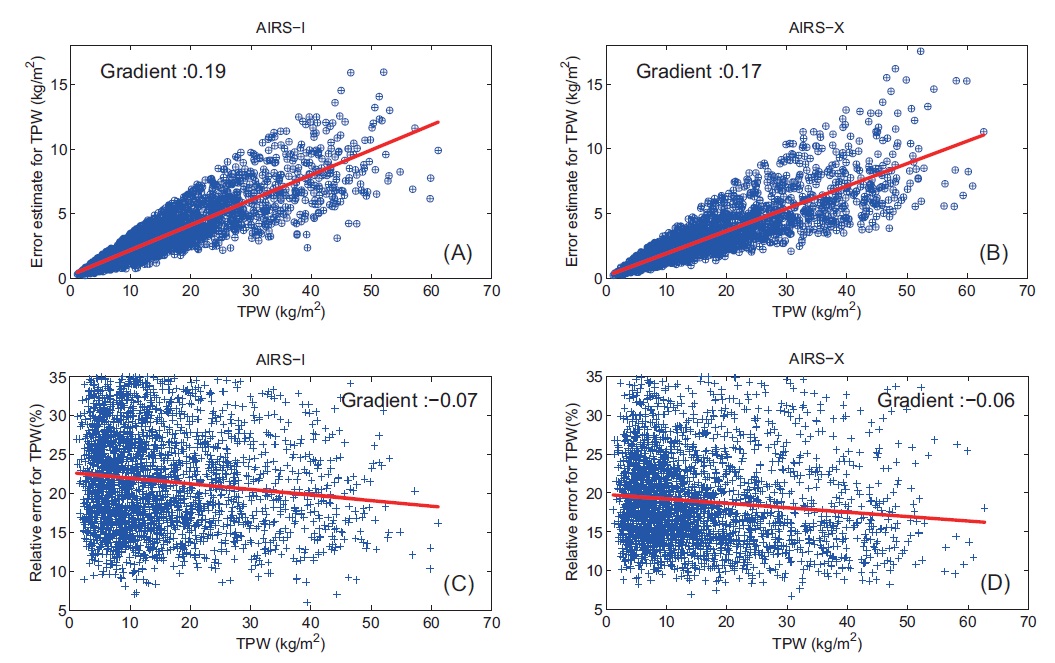
The AIRS L2 standard retrievals provide not only the flag information that represents the quality of the TPW data but also the error estimates of the TPW data. The error estimate analysis showed that the maximum error estimate was as great as 18 kg/m2 although the AIRS-I and AIRS-X TPW data that were considered available with ref-erence to the flag information. The most of the error es-timates were in the range of 10 ~ 35% in comparison with the relative error of the TPW data.
Fig. 2 shows the magnitude of the AIRS-X error estimate and the relative error in comparison with the TPW data. Figs. 2a and b show the error estimate and the TPW data together, indicating that the maximum error estimate was larger in the AIRS-X data than in the AIRS-I data. The slope of the fitted line was lower in the AIRS-X data than that in the AIRS-I data, indicating that the error estimate was smaller as the TPW value was greater. Figs. 2c and d show the relative size of the TPW error estimates. The y-intercept of the linear trend curve was 23% in the AIRS-I
whereas it was less than 20% in AIRS-X, which indicates that AIRS-X provided more accurate data than that of the AIRS-I even in the case where the TPW values were small and that the relative error was decreased as the TPW value increased. The mean error estimate of AIRS-I and AIRS-X was 3.2 kg/m2 and 2.9 kg/m2, respectively, and the mean relative error was 21.6% and 18.9%, respectively, which indicates that the TPW accuracy of AIRS-X data was high-er than that of the AIRS-I data.
3.2 Direct Comparison of the TPW Data
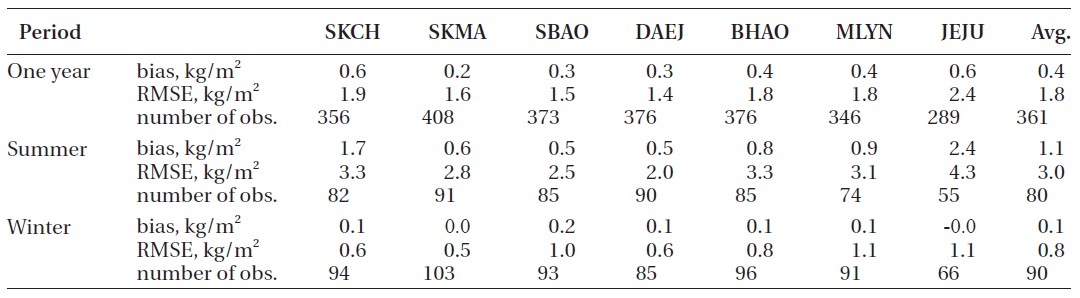
Two types of TPW provided by the AIRS were directly compared to analyze the difference between them. The TPW difference was calculated between the AIRS-I data from infrared measurements and the AIRS-X data that combined the infrared observation data with the micro-wave observation data. Table 2 shows the annual and sea-sonal mean differences at the seven GPS permanent sta-tions. The TPW provided from the two observation data showed that the AIRS-X that eliminated the cloud reflective effect is wetter by 0.4 kg/m2 in the annual mean, 1.1 kg/m2 in the summer seasonal mean and 0.1 kg/m2 in the winter seasonal mean than that of the AIRS-I that did not eliminate the effect. The RMSE was 1.8 kg/m2 in the an-nual mean, 3.0 kg/m2 in the summer seasonal mean and 0.8 kg/m2 in the winter seasonal mean, indicating that the difference between the AIRS-X and AIRS-I data was

Statistics of AIRS-I TPW with respect to AIRS-X TPW and number of observations used for the analysis.
greater in summer where the TPW values were greater. However, since the TPW accuracy of the AIRS sensor over South Korea could not be determined only by the numeri-cal comparison between the two data, we also performed the accuracy analysis with the GPS TPW data of the same period at the same locations.
4. TPW ACCURACY COMPARISON USING GPS
To verify the TPW accuracy of the AIRS L2 standard retrievals over South Korea, we generated the TPW data at the KASI permanent GPS stations. On the basis of the data, we verified the accuracy over the region of South Ko-rea through the bias analysis and the correlation analysis.
4.1 Bias and RMSE with Reference to the GPS TPW Data
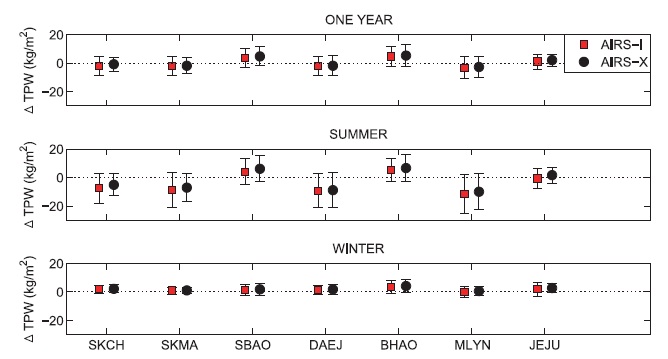
Fig. 3 shows the difference in the TPW values between the AIRS-I (square) and AIRS-X (circle) in terms of bias and RMSE using the GPS data. In the annual mean analy-sis result in Fig. 3, the TPW bias is divided into the stations with a positive value and those with a negative value with reference to "0" denoted as the dotted line. The positive value means that the AIRS TPW data is wetter than that of the GPS data, while the negative value means that the AIRS TPW data is drier than that of the GPS data. As shown in Table 1, the Sobaeksan Astronomy Observatory (SBAO) and Bohyunsan Astronomy Observatory (BHAO) stations having a positive value are located at high altitudes over 1 km. The Tamna University in Jeju Island (JEJU) station is also located an altitude higher than 400 m, but the bias was not greater than that of the SBAO and BHAO stations.
If a GPS station is located at a high altitude and the area surrounding the site is lower, the water vapor beneath the station is not included in the GPS-based TPW value and thus it should be different from the result of remote sensing which provides the information for the entire scanned area as in the case of the AIRS value. Hence, the TPW information observed by the AIRS sensor shows it wetter than that of the GPS data. The characteristic is also found in Fig. 3. The analytical result for summer in Fig. 3 indicates that the TPW bias at the two high-altitude sta-tions was positive. The analysis of the seasonal difference shows that the magnitude of the bias increased in sum-mer, indicating a distinctive difference depending on the altitudes of the stations. The GPS TPW showed it wetter than that of the AIRS-I and AIRS-X data in summer except the two stations, while the GPS TPW showed it drier than that of the AIRS-I and AIRS-X data in winter at all the sta-tions.
To quantitatively represent the TPW accuracy of the AIRS sensor numerically, we calculated the bias and RMSE with reference to the GPS data as well as the cor-relations and the results is shown in Table 3. To show the TPW accuracy of the AIRS sensor quantitatively, the nu-merical comparison was performed with only the four stations except the three stations, SBAO, BHAO and JEJU that showed singular characteristics as described before.
The comparison of the two observation data with ref-erence to the GPS data shows that the annual mean bias
[Table 3.] Statistics of AIRS-I and AIRS-X with respect to GPS TPW.
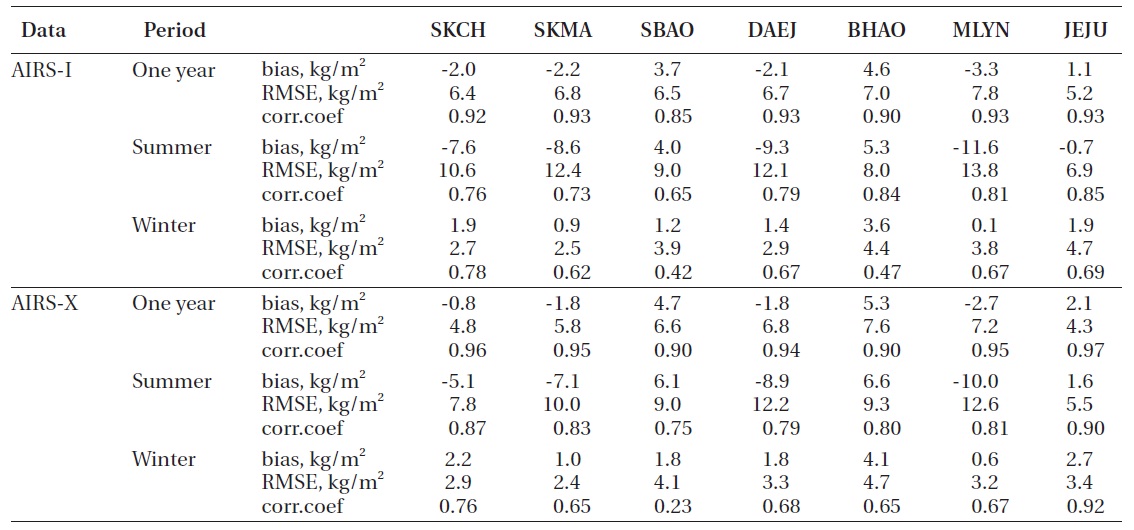
Statistics of AIRS-I and AIRS-X with respect to GPS TPW.
was lower by 0.6 kg/m2 and the RMSE was lower by 0.7 kg/m2 in the AIRS-X data than in the AIRS-I data. With respect to the seasonal difference, the AIRS-X data show it wetter than that of the AIRS-I in summer with the ac-curacy improved by 1.5 kg/m2 and the bias decreased by 1.5 kg/m2. In winter, the accuracy was not improved but the bias was greater in the AIRS-X data than in the AIRS-I data, since the TPW of the AIRS-X data showed it wetter than that of the AIRS-I data. The annual numerical values of the AIRS-X data used for the analysis showed the bias of -2.7 ~ -0.8 kg/m2 and the RMSE of 4.8 ~ 7.2 kg/m2. The result was at a similar level to the result of the AIRS-X ac-curacy comparison performed by McMillin et al. (2005) using the radiosonde and GPS station located in the USA with the bias of about 1.5 kg/m2 and RMSE of 4 ~ 5 kg/m2.
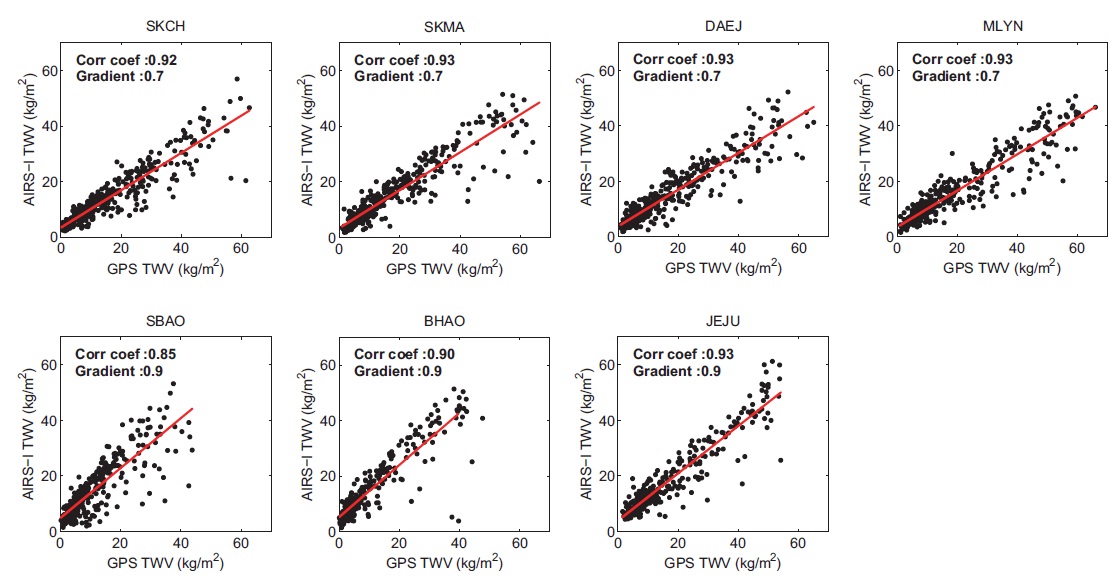
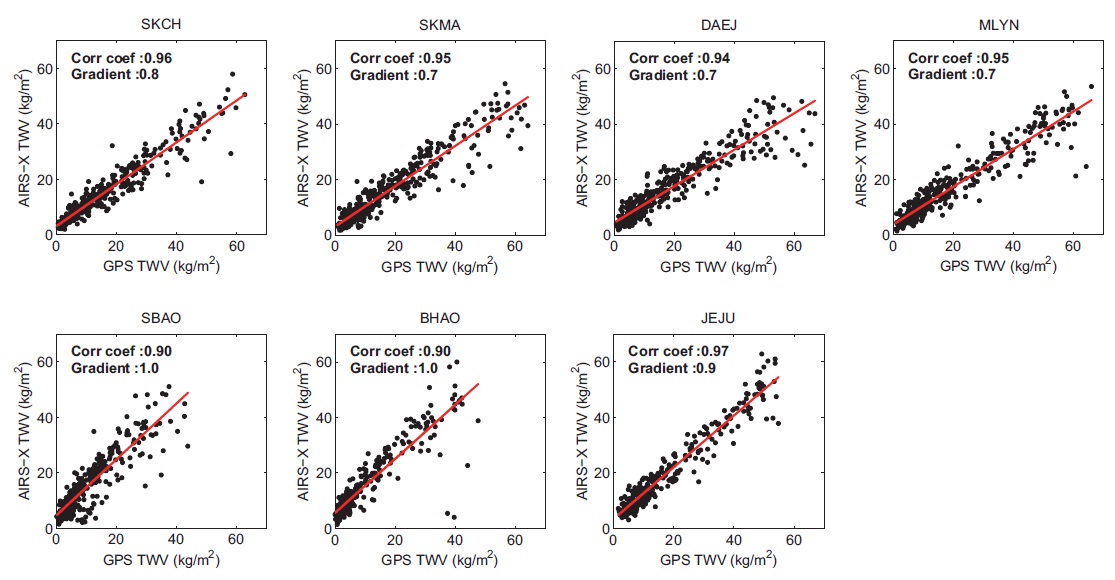
4.2 Correlations between the GPS TPW and the AIRS TPW
Figs. 4 and 5 show the correlation between the GPS TPW and the AIRS TPW. The correlation coefficients at the seven stations were analyzed and the result showed that the mean was 0.91 and the maximum was 0.93 between the AIRS-I TPW and the GPS TPW whereas the mean was 0.94 and the maximum was 0.97 between the AIRS-X TPW and the GPS TPW. Thus, the correlation of the AIRS-X TPW was higher with the GPS TPW than that of the AIRS-
I TPW. The correlation coefficient was the lowest at the SBAO and BHAO stations located higher than 1 km. The mean correlation coefficient except the two stations with lower correlation coefficient was 0.93 for the AIRS-I data and 0.95 for the AIRS-X data.
Figs. 4 and 5 show the AIRS-I and AIRS-X TPW distri-butions with the linear trend curves, indicating that the slope was lower than 1 at the five stations that are not lo-cated at higher-altitude locations while it was higher than 1 at the SBAO and BHAO stations. The difference in the slope occurred because the GPS TPW was as high as 60 kg/m2 or higher while the AIRS-I and AIRS-X TPW did not exceed 60 kg/m2 and the GPS TPW was less than 50 kg/m2 at the highly located SBAO and BHAO stations. In the case of the JEJU station, the ellipsoidal height was consider-ably high as 431 m and thus the GPS TPW value was small but the AIRS TPW was greater than that of other stations. The distribution of the AIRS-I and AIRS-X TPW verified that the singular points were less in the AIRS-X data and thus the data were more stable.
The result that the AIRS TPW became smaller when the GPS TPW was increased over a certain level can be con-sidered as the result of the algorithm that calculates the TPW based on the brightness temperature of the AIRS sensor (Koo & Sohn 2005) and the decreased accuracy by the heat islands in urban areas as well as cloud shielding (Park 2001). The AIRS TPW and the GPS TPW were simi-lar with each other at the JEJU station, which might have been caused because the AIRS TPW accuracy is higher on the sea than in the land as suggested by Divakarla et al. (2006).
In this study, we analyzed the accuracy of the two types of TPW data (AIRS-I and AIRS-X) provided as the AIRS L2 standard retrievals over South Korea. We compared the accuracy of the two types of observation data based on the flag information and the error estimate provided to-gether with the AIRS L2 standard retrievals. The accuracy was verified in terms of the bias, RMSE and correlations with reference to the GPS TPW. According to the error es-timate provided by the AIRS, the accuracy of the AIRS-X data was higher than that of the AIRS-I data. The direct comparison of the TPW values indicated that the AIRS-X data showed it wetter than that of the AIRS-I data. The accuracy analysis using the GPS TPW showed that AIRS-X data were more strongly correlated with the GPS data than the AIRS-I data and the accuracy was also higher. The seasonal analysis showed that the AIRS-X accuracy was much higher in summer than in winter. Despite the improved accuracy, the TPW provided as the AIRS L2 standard retrievals showed RMSE of 4 ~ 7 kg/m2 with the GPS TPW. In particular, the AIRS TPW was lower than the GPS TPW in summer. Therefore, when the TPW data pro-vided as the AIRS L2 standard retrievals over South Korea need to be used, proper data should be selected accord-ing to the research purpose. Further studies may need to be conducted to develop the data processing algorithm that can eliminate the error factors of brightness temper-ature in order to improve the accuracy of the AIRS TPW.