Understanding of long-term electron density variation is very important in ionospheric forecasting and nowcast-ing modeling for improving the accuracies of positioning and navigation of single frequency global positioning sys-tem (GPS) users because the ionospheric range delay is the largest error source in GPS after selective availability was turned off in May 2000. The electron density affecting GPS high accuracy products show significant temporal and spatial variations with year, season, month, and lo-cal time which results from changes in the solar extreme ultraviolet (EUV) and X-ray radiation, and from various chemical and dynamic processes with thermosphere and magnetosphere. Especially, the GPS ionospheric delay er-ror in polar region is large because an accessible GPS net-work is limited and its composed GPS sites are few (Jee et al. 2010).
The electron density variations in polar region have been mostly studied to investigate the coupling processes of ionosphere-magnetosphere in Arctic, but in Antarctic few of ionospheric measurements are only made during the short-term period of geomagnetic storm events from radar system and satellites measurements (Kitamura et al. 2009). Moreover, the observational results for ionospheric climatology, anomalies, and various of responses to geomagnetic storms are rarely reported in the West Antarctic, especially the Antarctic Peninsula until recent-ly. It is one of reasons that the ground-based ionospheric measurements in the Antarctic Peninsula are very sparse because of lots of problems in managing observational instruments by severe natural environments such as strong wind and blizzard.
Recently, the geodetic ground-based GPS has been widely used as a powerful measurement tool to investi-gate the global and regional ionospheric structures owing to its continuous, easy operation, and many of worldwide distributed receivers. The total electron content (TEC) is an integrated measurement electron density from GPS satellite with the altitude of ~22,000 km to GPS receiver. The GPS TEC includes the electron densities in D, E, F re-gions, and plasmasphere along the path between GPS sat-ellite and ground-based receiver. Although electron den-sities in D and E regions and plasmasphere contribute to the measured GPS TEC, they are much narrower regions in height and have normally lower electron density than the F region, and at the production, loss, and transport rates of electron in the F region can be more significant than other regions (Liu & Gao 2004). Consequently, GPS TEC can represent the behaviors of F region ionosphere.
This paper describes the first results of ionospheric variation using GPS TEC value that is calculated the dual-frequency GPS measurement at King Sejong (KSJ) Station (geographic latitude 62°13?S, longitude 58°47?W, cor-rected geomagnetic latitude 48° S) at King George Island
on the Antarctic Peninsula between 2005 and 2009 in condition of solar minimum. In the first section, we will describe the observational environment at KSJ and the data processing. Then we present results for yearly, sea-sonal, and local time variation of GPS TEC, and discuss a physical process that may be responsible for temporal variation of GPS TEC over KSJ. A final summary section is provided to conclude this paper.
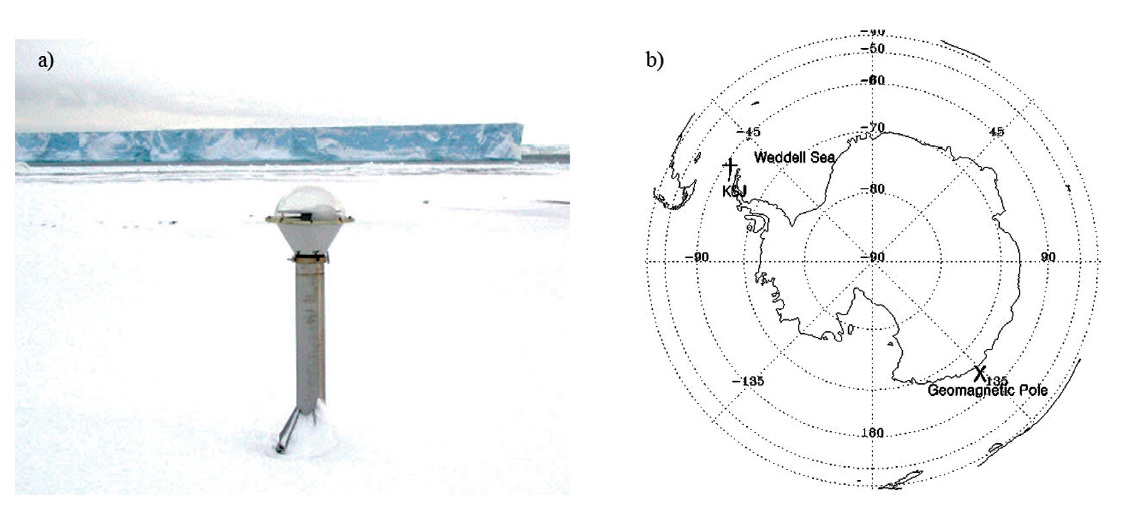
The KSJ station on King George Island in the Antarctic Peninsula has been continuously operated the GPS site from 2005 except for tens of days due to an operational malfunction. The GPS receiver model is Ashtech UZ-12 from 1 January 2005 to 30 November 2009 and is changed into Trimble NetR-8 from 1 December 2009. No measure-ment days in Table 1 may be by the bad GPS signal recep-tion due to the frozen dome condition by heavy snowy storm called blizzard that usually occurred in winter sea-son. Fig. 1a is the picture of the KSJ GPS site and Fig. 1b
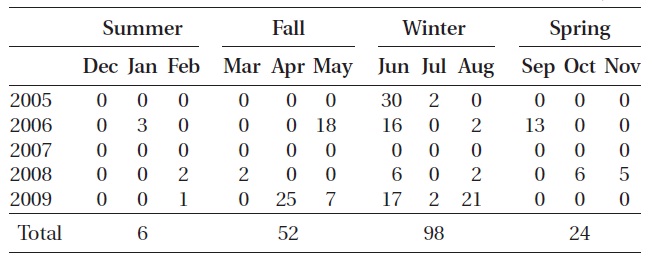
GPS measurement statistics at King Sejong station in Antarctic between 2005 and 2009. The numbers represent no measurement days.
shows the KSJ location on geographic map. Its geographic latitude and longitude are 62°13?S and 58°47?W, respec-tively and its geomag-netic location is corrected geomagnetic latitude of 48° S, declination of 11° E, inclination of 55°, and L-value of 2.6 that are computed by international geomagnetic reference field-11 model. Although KSJ is geographically located at high latitude near the Weddell Sea, its geomagnetic location is mid-latitude of outer re-gion of aurora oval.
The arrival time to GPS receiver of two L-band frequen-cies (
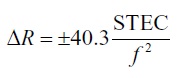
The STEC can be computed by Eq. (2) using Eq. (1) and pseudorange measurements of
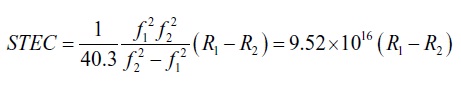
The STEC estimation with GPS pseudorange measure-ments has an uncertainty because of the high noise level of the pseudorange. In contrast, the noise of carrier phase shows significantly lower values than pseudorange ones.
So, we smoothed GPS pseudorange data with carrier phase measurements to reduce the pseudorange noise on STEC. The
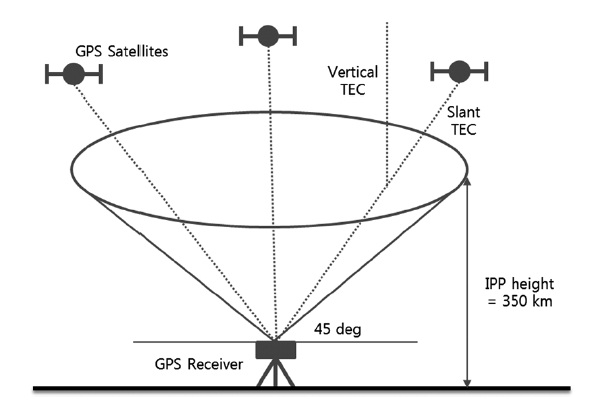
Global and regional GPS TEC maps have been general-ly used to examine the spatial morphology of ionospheric variation in case of geomagnetic disturbances or to cor-rect the ionospheric time delay error for single frequency GPS users. However, it is not proper to investigate the ionospheric variation using single GPS receiver because its measurement points are deficit to construct the TEC map with high time resolution less than 1 hour. So, the new method is needed to monitor GPS TEC at single site. Fig. 2 shows the schematic diagram for the GPS TEC esti-mation at single site. We define this method as GPS TEC conical model (GTCM). The GTCM is based on single layer geometry model that assumes all free electrons are concentrated in a shell of infinitesimal thickness. In Fig. 2, the ionospheric pierce point (IPP) is point where the ling-of-sight between the satellite and the ground receiv-er intersects this shell, and IPP height is typically set to expected height of the maximum electron density. We as-sume that IPP height where STEC is converted to vertical TEC is 350 km (Liu & Gao 2004), and set the satellite mask elevation angle of 45° to reduce the horizontal gradient of electron density by precipitating electrons in auroral region considering the location of the KSJ station that is shown in Fig. 1.
While the satellite observations can globally cover the wide area but not the local time variation yet, the ground-based instruments have an advantage to continuously measure the ionospheric variation over a certain loca-tion with high temporal resolution. In order to see the ionospheric features over KSJ station near the Antarctic Peninsula under solar minimum condition, we analyzed the KSJ GPS TEC dataset of 1,644 days between 1 Janu-ary 2005 and 30 November 2009 with exception of 181 days when the operation was disrupted by electric power failure, instrumental malfunction, and dome frozen by blizzard. The KSJ GPS operational ratio during the da-taset period is 90.1%, which is sufficient to examine the ionospheric variation with high temporal resolution. In this study, the KSJ GPS TEC with local time is quantita-tively analyzed by simple harmonic model with year. The parameters that are computed from this model can con-tribute to construct an empirical ionospheric model for Antarctic Peninsula and then can be applied in the area of space weather and ionospheric error correction in space navigation system if more data are accumulated and ana-lyzed in the future.
We construct the simply model using the KSJ GPS TEC dataset with the harmonic function with two periods of Eq. (3) considering the diurnal and semidiurnal varia-tion. The diurnal variation usually represents the elec-tron density variation by solar EUV and X-ray radiation fluxes and the semidiurnal variation characterizes atmo-spheric semidiurnal tidal wave that significantly affects ionosphere by dynamical variations in the neutral wind, temperature, and chemical composition in polar region
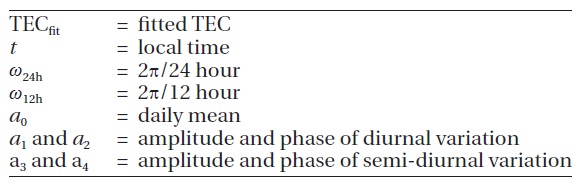
[Table 2.] Coefficient and variables of the model function.

Coefficient and variables of the model function.
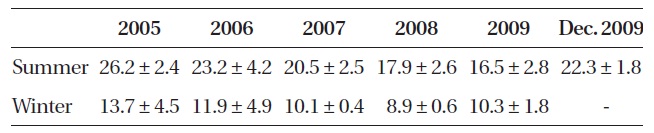
[Table 3.] Seasonal mean TEC in summer (December-February) and winter (June-August).

Seasonal mean TEC in summer (December-February) and winter (June-August).
(Nozawa et al. 2010). The semidiurnal term can also rep-resent the abrupt changes of electron density in case of geomagnetic disturbances in nighttime.
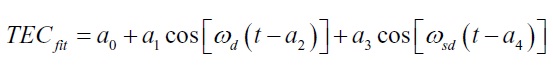
In Eq. (3), the
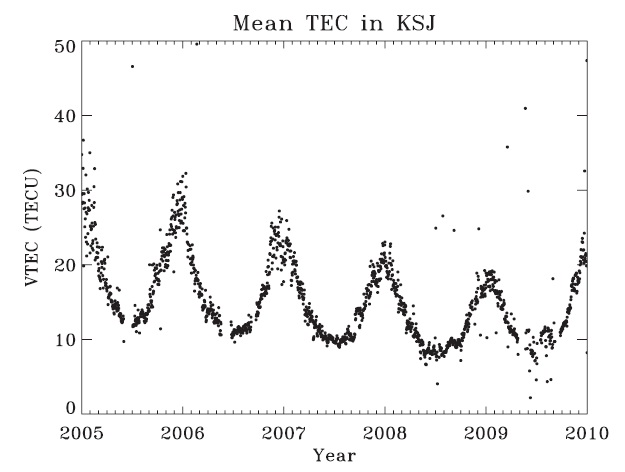
Fig. 3 shows the annual variation of the daily mean TEC,
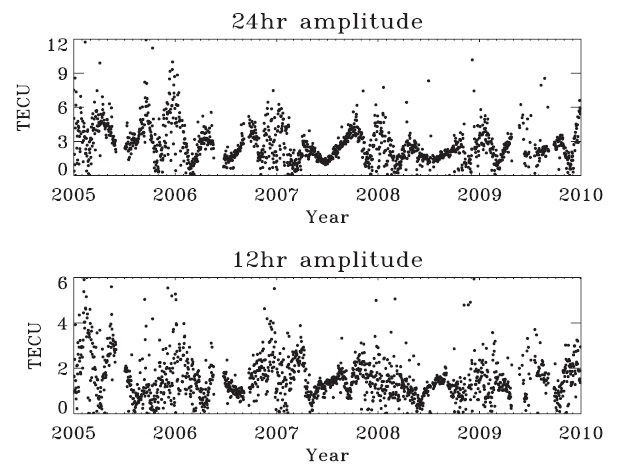
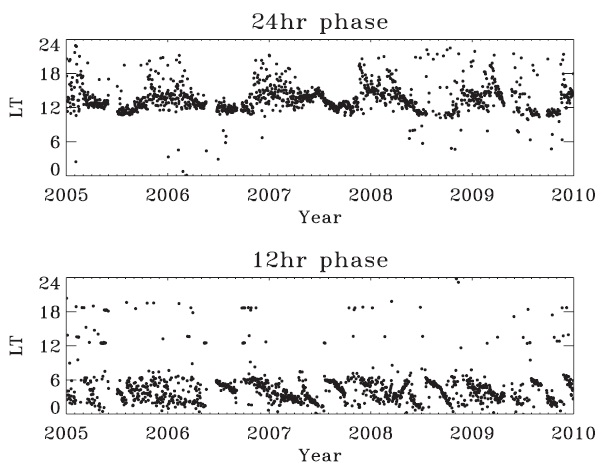
Fig. 4 presents the variation of the
tion is depend upon the month, and may be triggered by a regular variation of thermospheric neutral wind, geo-magnetic field configuration, or aurora activities besides of ionization by solar radiation. It is needed to analyze with the theoretical model and other measurements.
In solar minimum condition between 2005 and 2009, the GPS TEC variations over KSJ station near the Antarc-tic Peninsula show the noticeable semidiurnal variations that the GPS TEC values in nighttime are higher than the daytime values in summer. The features indicate the Weddell Sea anomaly (WSA) of larger nighttime electron density than a daytime electron density that has been ob-served around the Antarctic Peninsula. Horvarth (2006) and Jee et al. (2009) reported the global WSA morphology and its available mechanisms using the altimetry TEC from TOPEX/Poseidon satellites. Their results for WSA show the globally spatial changes according to season, year, and solar activities. However, the evolution of the WSA with local time is not suggested yet because satel-lite observation has a constraint to cover the whole local time. Our study using ground-based GPS TEC measurement is expected to increase an understanding for the WSA morphology and its mechanism together with sat-ellite measurements. In the following work, we examine the KSJ ionospheric variation using the neutral wind and geomagnetic field configuration using the model results and other measurements.
In order to see the ionospheric features over KSJ sta-tion (geographic latitude 62°13?S, longitude 58°47?W, corrected geomagnetic latitude 48 S) near the Antarctic Peninsula on the solar minimum condition, we analyzed the KSS GPS TEC dataset of 1,644 days between 1 January 2005 and 30 November 2009. The annual variation of the daily mean TEC decreases from January 2005 to February 2009, but increase from the June 2009. The variations of diurnal amplitude with years show the seasonal features but the greatly dispersed features in summer. In contrast, the semidiurnal amplitudes show the clear peak in sum-mer. The diurnal phases show the significant seasonal oscillation between 00 LT and 06 LT and gradually move with month. Consequently, the GPS TEC variations over KSJ station near the Antarctic Peninsula show the notice-able semidiurnal variations in summer. It is suggested the KSJ GPS TEC may be clearly affected by the WSA of larger nighttime electron den-sity than a daytime electron density that has been observed around the Antarctica pen-insula. We will further examine the local time evolution of WSA according to the year and season using extensive observation dataset such as neutral wind, more ground-based GPS TEC data.