Water in a liquid state or ice in a solid state is changed to water vapor in a gaseous state at a certain degree of temperature, which is colorless, odorless and transpar-ent, and mostly resides in the troposphere. The quantity of water vapor contained in air is tiny, but plays a key role in global environmental change as one of main green-house gases. The quantity of water vapor which changes depending on temperature or pressure is one of main me-teorological factors indicating the status of atmosphere.
Recently, the rise of temperatures caused by global warming increases the amount of water vapor inflow into the atmosphere by increasing the capacity of air for water vapor per unit volume. The increased amount of water vapor acts as a factor which results frequently in the nat-ural disasters such as localized heavy rainfall or floods. In addition, water vapor in the atmosphere also acts as a major error factor in the space geodetic techniques us-ing radio signals, such as global positioning system (GPS) and very long baseline interferometry.
The signals transmitted toward the earth from space is refracted and delayed in transmission time by water vapor distributed irregularly in the atmosphere. In the observational data received, errors proportional to the amount of the delay are included, so by a reverse analysis, we can calculate the amount of water vapor in air over the observatory. Therefore, the accurate estimation of the radio signal delay by water vapor contributes not only to studies on the atmosphere but also to improvement of accuracy in the space geodetic techniques.
As for observation systems to measure the amount of water vapor in the atmosphere, there are radiosonde, mi-crowave radiometer (MWR), aircrafts, Earth observation satellites in the infrared or microwave wavelength range and GPS, etc., and we summarize the characteristics of reeach observation system in Table 11. Radiosonde is an aerological observational device to make direct measure-ments by altitude as the balloon flies up into the atmo-sphere with hanging the observational device equipped with the sensors like a barometer, a thermometer, a hy-grometer, etc. and is the oldest observational equipment for amount of water vapor in the atmosphere.
However, due to the high cost of an observing run, the radiosonde observation is carried out only 2-4 times a day and there is the limitation that it is managed and operat-ed directly by person. As far as the precision of equipment is concerned, it contains the margin of error shown as ap-proximately 0.2°C for temperature, approximately 3.5% for relative humidity (Elliott & Gaffen 1991), and 5-10% for precipitable water vapor (PWV) (Motell et al. 2002) by and large.
The ground-based MWR can deliver information on condition and vertical distribution of the atmosphere on a real time basis by passively measuring the radiation energy from the atmosphere, but the equipment is very expensive, requiring the absolute calibration for observa-tion sensors on a regular basis, and there is the limitation that it is affected by precipitation. Airborne observation can directly measure the amount of water vapor on the course, using the water vapor sounding system mounted in the aircraft, but its spatial and temporal resolution is low because the measurements are made only at takeoff or landing, around the airport. The research on the tro-posphere using satellite-mounted sensors has the advan-tage that a wide range on the globe can be covered for observation, but there is the limitation depending on the
[Table 1.] Comparison of water vapor measurement systems.
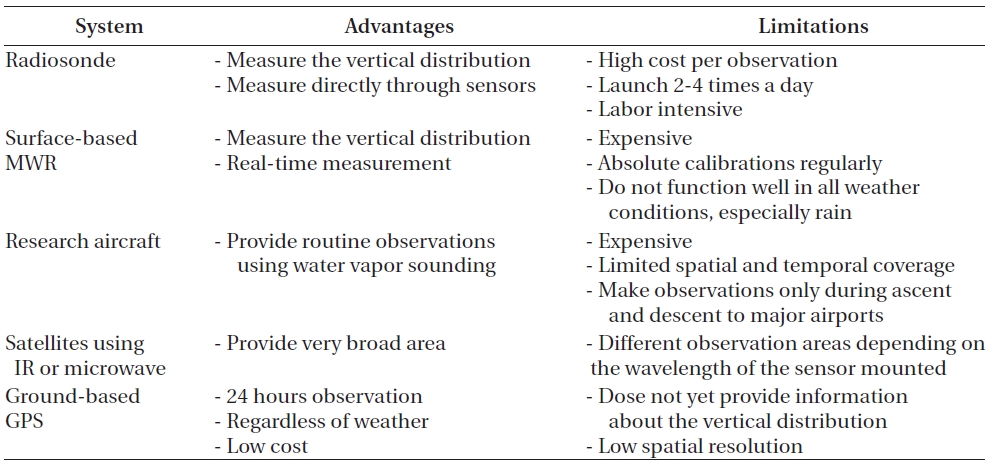
Comparison of water vapor measurement systems.
wavelength of observing signal. The observation using the infrared is valid in areas where there is no cloud, and the observation using radio wave is valid in areas where there is cloud and over the ocean.
Finally, the research on the troposphere using the ground-based GPS was first proposed in the early 1990s and has been developed continuously in technically advanced countries like the United States, Japan and in Europe, and the resulting information is being used increasingly as a basic data for weather forecast. The ground-based GPS observation has the advantage that it can provide an accurate observation at low cost for 24 hours regardless of the weather, but there is the limitation that its spatial resolution is low and only integrated water vapor (IWV) is calculated.
There are diverse research examples which conduct-ed the cross-correlated comparison on the PWV results measured by these observation systems. The observation values of radiosonde which has been used for the longest period of time are used often for verification, calibra-tion and analysis of characteristics for values measured by other systems. For example, in a relative comparison with values measured by MWR, average difference from radiosonde results was represented as 1-5 mm, and stan-dard deviation was represented as 1-2 mm (Westwater et al. 1989, Liou et al. 2001, Basili et al. 2002, Pacione et al. 2002), and in a relative comparison with values measured by GPS, average difference from radiosonde results was represented as 1-4 mm, and standard deviation was rep-resented as 1-5 mm (Moon et al. 1999, Kwon et al. 2007, Park et al. 2010).
The observation values of GPS and MWR which have high temporal re-solutions are frequently used in re-searches of cross-correlated comparison on observation values and data assimilation cases in order to use them as basic data for model to predict the rapidly changing weather (Pacione et al. 2002, Ha et al. 2007, Jeon et al. 2008). In recent years, the researches using observational data by satellites are actively under way (Birkenheuer & Gutman 2006, Prasad & Singh 2009).
In this research, we calculate the respective PWV using the two-year data of GPS and MWR which are operated at the same location and conduct a comparative analysis on the relative characteristics of PWV measured by those two equipments. For the purpose of this, we summarize the temporal changes in PWV and their differences between the equipments by representing the measured PWV in time series, and conduct a comparative analysis on the characteristics of the distribution of PWV, which are sub-ject to seasonal changes, and on the characteristics of observational data between the two systems. In addition, we analyze the change characteristics and differences between the two observation values by representing the observational data for two years as changes in daily cycle and confirm their relationships with temperature.
1http://www.gpsmet.noaa.gov/background.html (2011.11)
GPS is used to determine the user's location and time. In GPS observation data, there are included the errors
delayed by free electrons and water vapor while passing through the ionosphere and the troposphere. The infor-mation on delayed errors in the atmosphere like this is used to estimate total number of electrons in ionosphere and amount of water vapor in the troposphere. Owing to the advantage that continuous observation is possible re-gardless of the weather, GPS is widely used in the field of atmospheric research these days.
MWR is the equipment that can obtain the property information on target of observation by measuring the microwave energy of long wavelength emitted from the atmosphere, earth surface and the ocean, etc. In the case of ground-based MWR for atmospheric observation, it can calculate the information on atmospheric condi-tions, such as atmospheric temperature, relative humidi-ty, cloud water content, cloud ceiling height, etc. on a real time basis and can also derive the information on verti-cal distribution of observed parameters (Rose & Czekala 2009).
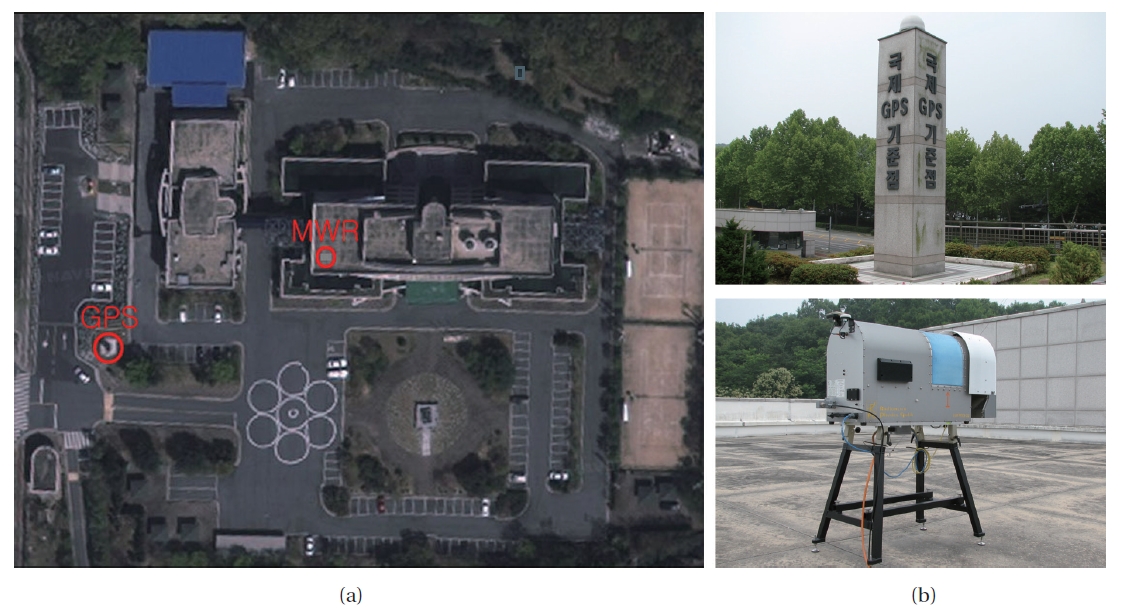
GPS and MWR used in this research are installed at Korea Astronomy and Space Science Institute (KASI) in Daejeon, and the spatial distance between the two equip-ments is approximately 60 m (Fig. 1). The GPS equipment consists of Trimble's NetRS receiver, Choko Ring antenna and Paroscientific's MET3A meteorological sensor and collects the observational data automatically at every 10 minutes. MWR is RPG-HATPRO model manufactured by Radiometer Physics Gmbh, Germany and consists of 7 channels (22.2-31.4 GHz) to measure the humidity in the atmosphere and 7 channels (51.2-58.5 GHz) to measure the temperature (Rose & Czekala 2009). Using these dual-frequency band, MWR measures atmospheric tempera-ture, humidity, IWV, etc. up to 10 km altitude from the ground on a real time basis. Resulting data of MWR are stored largely in three stages. At 0th stage, the observed voltage of equipment and set values of observational environment, etc. are saved as raw data and at 1st stage, converted brightness temperature by frequency is saved and at 2nd stage, the vertical distribution of atmospheric temperature, humidity, etc. and meteorological informa-tion on the ground, IWV, cloud water content, etc. are saved. To obtain a stabilized observational data, absolute calibrations are performed on a regular basis using liquid nitrogen and the accuracy of measurement on PWV is ± 0.2 mm root mean square (Rose & Czekala 2009).
We perform the processing of collected GPS observa-tional data using the GIPSY 5.0, software for high-pre-cision data processing, and calculate total delay in the troposphere based on transcendental method (Webb & Zumberge 1993). The calculated total delay is computed as IWV using the measured values of meteorological sen-sors attached to GPS antenna support and is converted to PWV. In this process, we calibrate the differences of at-mospheric pressure due to altitude differences between GPS receiver antenna and MWR. In general, as for GPS PWV, the quantity of variations due to differences of at-mospheric pressure is represented greater than that due to differences of atmospheric temperature. Because the GPS receiver antenna used in this experiment is located at altitude lower than MWR by approximately 9 m, we calibrated the pressure differences through the pressure correction equation of Ninomiya (2003). For more in-formation about the calculation procedure of GPS PWV and related equations, refer to the references (Bevis et al. 1992, Ha et al. 2007).
MWR calculates the amount of water vapor in the atmosphere in real time using the quantity of radia-tion energy from the atmosphere received by individual channels. The observed radiation energy is converted to brightness temperature by Plank’s law. The converted brightness temperature is calculated as IWV through multiple regression method and artificial neural network algorithm which uses the radiosonde data observed for a long time as learning materials (Rose et al. 2005, Rose & Czekala 2009). Our equipment also uses artificial neu-ral network algorithm to calculate the information on atmospheric conditions by altitude as well as IWV and uses radiosonde data as learning materials for the data processing algorighm. Radiosonde observations in Ko-rea are performed at Baekryeong island, in Sokcho, in Osan, in Pohang, in Gwangju, at Heuksan island, and in Gosan, and among these, we use the data observed at the Gwangju radiosonde, which are provided by the manu-facturer in the unique file format for the MWR data pro-cessing.
3. COMPARATIVE ANALYSIS OF PWV
MWR was installed in mid-July, 2009 and is in opera-tion until now. The subject of this research is data ob-served for 2 years from August 1, 2009 to July 31, 2011, sample extracted every 30 minutes. Among the results of calculation, we exclude abnormal values of MWR created from precipitation, mostly rainfall, and data of GPS PWV in the same time zone and also GPS results from August 1, 2010 to September 29, 2010 because observations were not conducted due to repair of MWR in this period.
3.1 Comparison of PWV between GPS and MWR
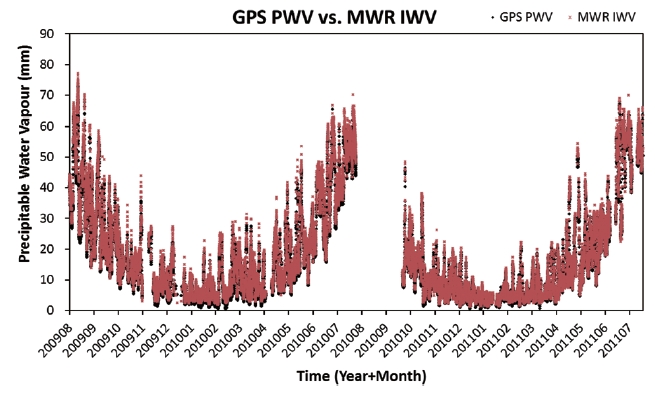
Fig. 2 represents the distribution of PWV in time series observed for 2 years, and it shows the typical pattern of water vapor change in Korean peninsula that increases in summer season (June-August) and decreases in winter season (December-February). In general, the observation values of MWR were represented greater than the calcu-lated values of GPS. The average PWV in summer for the two equipments was represented as 39.4 mm or so and approximately 88% of observation values are distributed in 20-60 mm zone. On the contrary, the average value of PWV in winter is 5.6 mm or so, and approximately 90% of observation values are distributed below 10 mm. The coefficient of correlation between the two observational results is represented as approximately 0.99 showing a high correlation.
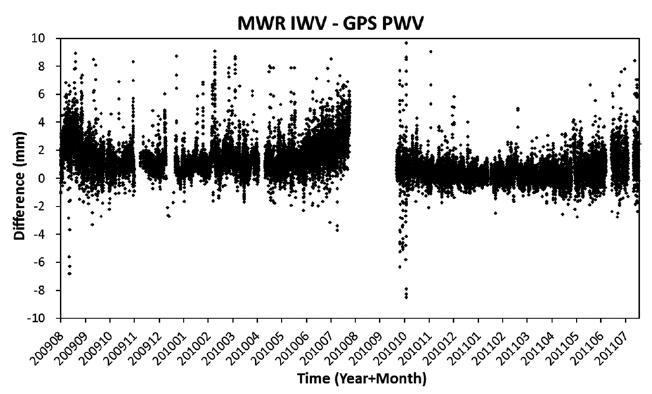
Fig. 3 represents the differences in PWV measurement between the two equipments in time series, the average is 1.1 mm and the standard deviation is represented as 1.2 mm. This is a result similar to average value of 0.5 mm and standard deviation of 1.4 mm for differences be-tween two equipments measured by Pacione et al. (2002), respectively. In summer when there is a large amount of water vapor in the atmosphere and the range of temporal variation of PWV is large, the average value of differences between two equipments is represented as 1.9 mm, and the standard deviation is represented as 1.4 mm while
in winter when it is dry and the range of temporal varia-tion of PWV is small, the average value is represented as 0.7 mm, and the standard deviation is represented as 0.9 mm, showing small differences compared to summer.
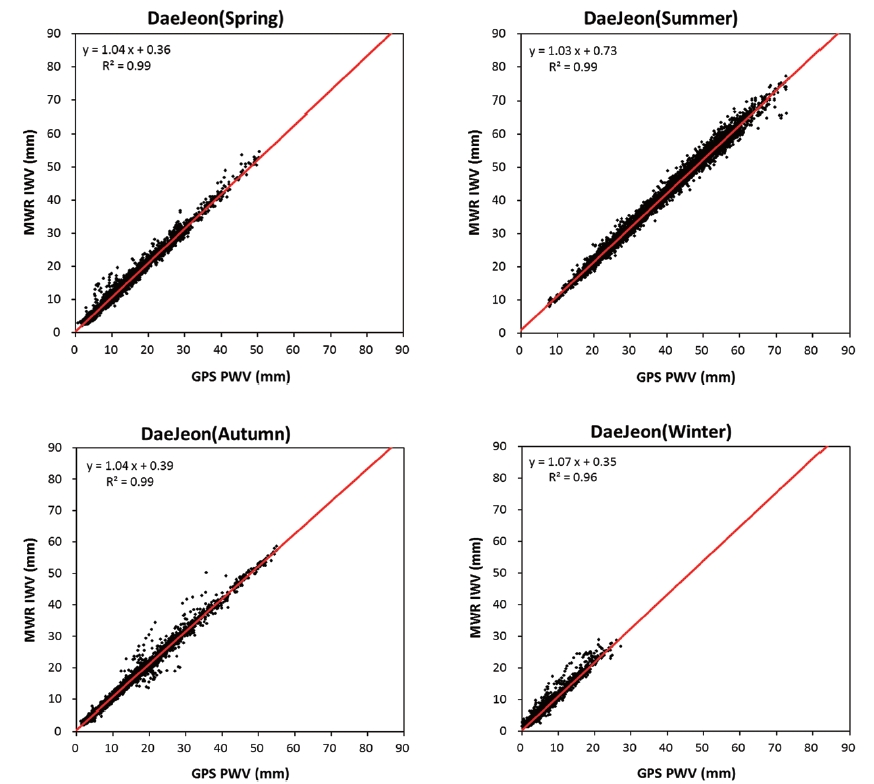
3.2 Analysis of Characteristics by Season
To confirm the characteristics by season of the two ob-servation equipments, we conduct the comparative anal-
[Table 2.] Seasonal statistical parameters between GPS PWV and MWR IWV.
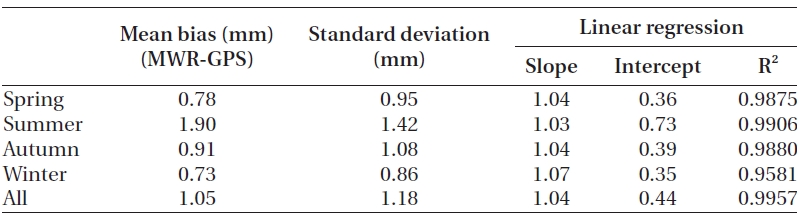
Seasonal statistical parameters between GPS PWV and MWR IWV.
ysis after dividing the PWV measured for two years into four seasons. The average differences in season for two observation values are approximately 0.7-1.9 mm and the standard deviation is represented as approximately 0.9-1.4 mm (Table 2). It shows the biggest differences in sum-mer when the amount of water vapor contained in the atmosphere is large while the differences between two values are represented as least in winter when the humid-ity is low. In Table 2, we summarize the average values of differences, the standard deviation, and the coefficient of linear regression for measured data of two equipments by season, and we can see that the linear regression expres-sion explains the observed data well because the determi-nant coefficient (R2) is close to 1.
The PWV measured by two equipments shows differ-ent characteristics between summer and winter. The dif-ferences of average value are larger in summer than in winter, but because the distribution of measured values for two seasons is different, there show the differences in tendency of estimation between two equipments. Al-though the distribution of measured values is represent-ed as similar between two equipments in summer, MWR represents the tendency of being overestimated more than GPS in winter.
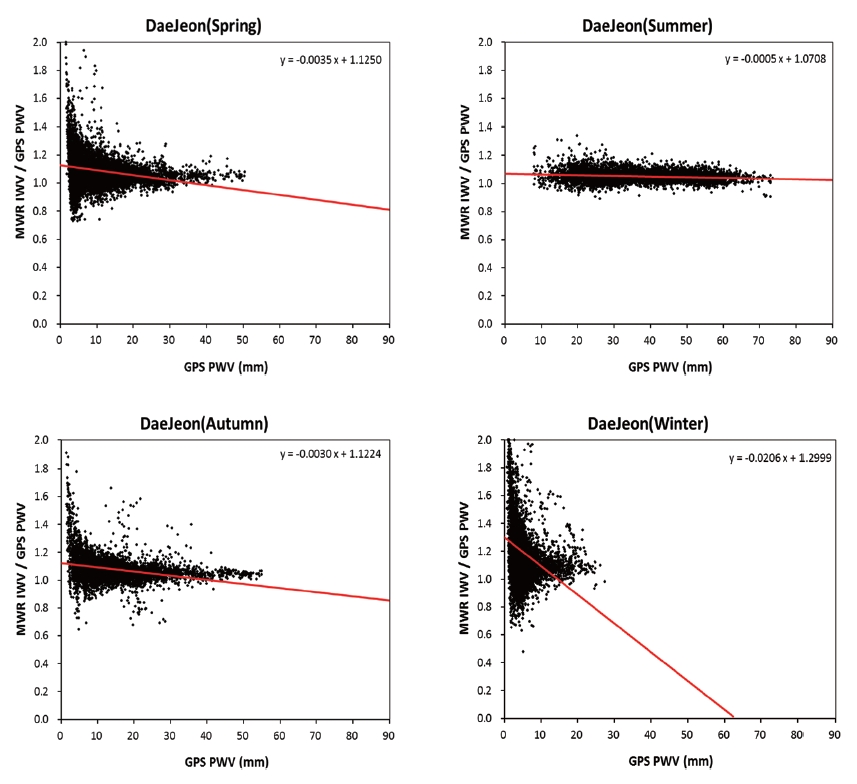
Fig. 4 represents the distribution of correlation by season between two observation values. In summer, the value of slope for linear regression of two observation val-ues is represented as 1.03 close to 1 compared to other seasons, but in winter, it is represented as 1.07, relatively large value, showing a little biased to axis of MWR mea-surement value. In addition, in Fig. 5 which represented the ratio between two observation values depending on changes in GPS PWV, we can see that the measured values of MWR is inclined to be measured larger than the calcu-lated values of GPS in winter compared to summer.
And, in the figure, the reason that the ratio between ob-servation values of two equipments is represented larger in region where GPS PWV is smaller (below 10 mm) is due to the fact that the ratio between observation values of
two equipments is represented as relatively large com-pared to region where PWV is large, although the absolute differences between observation values are small.
The seasonal differences in PWV measured by two equipments are considered as due to various error com-ponents arising out of estimation process for precipitable water, and the estimated error components by each sys-tem are as follows.
In case of GPS data processing, it is considered as due to errors occurring from estimation of average tempera-ture value or use of mapping function. The differences in average temperature value come from underestimation or overestimation depending on model expression in use (Morland et al. 2009). According to Ha et al. (2006), in winter, there occur the differences of 0.1-0.3 mm and in summer, there occur the differences of 0.5-2.7 mm de-pending on model expression for average temperature. In addition, through experiment, Jones (2008) has shown that if there occur the differences of 1°C in average tem-perature, there occurs about 0.08 mm in PWV.
So, we can see that there occur the differences in cal-culated PWV according to average temperature value in seasons whose atmospheric temperature is high or low, and it is considered that this fact may act as an error com-ponent. The mapping function in space geodetic research is used to convert the cumulative information in vertical direction to delay information in line-of-sight when es-timating the quantity of signal delay in the atmosphere. But, because the coefficient of function differs depend-ing on latitude and time of observatory, there occur dif-ferences in the delay (Janes et al. 1991). Won et al. (2010) has shown that the change in delay in the troposphere represented the biggest differences in February or August as seasonal signal with1 year cycle depending on the sort of mapping functions used for GPS data processing, and that the differences were represented as average 1-2 mm and maximum 5 mm.
In case of MWR data processing, the errors are consid-ered to originate from uncertainties in the Radiosonde measurements, which are used as reference data for the estimation algorithm, or from influences of protecting film of the scanning mirror. MWR uses the observation values of radiosonde as learning materials for Artificial Neural Network algorithm in order to estimate PWV. The data of radiosonde used in this experiment is the values observed over Gwangju area about 150 km away from ex-periment place and it is considered that the spatial dif-ferences may act as an error component for calculated values of PWV. In addition, the observation data of radio-sonde is inclined to calculate the dry-biased measure-ment value due to hygrometer heated by solar radiation (Wang et al. 2002, Turner et al. 2003).
According to model experiment of Richardson et al. (2000), PWV in summer is most influenced by dry-bias due to radiation and PWV in winter is least influenced by it. Wang & Zhang (2008) has shown that the relative hu-midity in the atmosphere and solar radiation at different altitude angles are major elements for deviation of radio-sonde, and according to results that compared the obser-vation values of radiosonde in 14 products of 3 kinds with the values measured by GPS, the average dry-bias was represented as the level of about 1 mm and the standard deviation was represented as the level of 1-3 mm.
In addition, according to Park et al. (2010), the average dry-bias was represented as the level of about 2 mm and the standard deviation was represented as the level of 3-5 mm in observation data of radiosonde and the values measured by GPS in Sokcho and as GPS PWV increases, the dry-deviation is strengthened. The protecting film of scanning reflector is made of rubber material of about 1 cm, so it plays the role of protecting the receiving reflec-tor from precipitation or outer environment.
However, due to dew drops, frosts, ice, etc. formed on protection film in winter, the quantity of water vapor in the atmosphere is inclined to be overestimated, so it is considered that this acted as an error component.
According to researches which compared the values measured by two equipments with the values measured by radiosonde by season, in summer, the average differ-ences between the values measured by radiosonde and the values measured by MWR were represented as 1 mm while the average differences between the values mea-sured by radiosonde and the values measured by GPS were represented as 8 mm. And in winter, the average differences with MWR increased to 2 mm, but the aver-age differences with GPS decreased to 4 mm (Basili et al. 2002). According to this research, in summer, the accu-racy was represented as 88% higher in MWR than in GPS, but in winter, it decreased to 50%, so, GPS was improved relatively while MWR deteriorated.
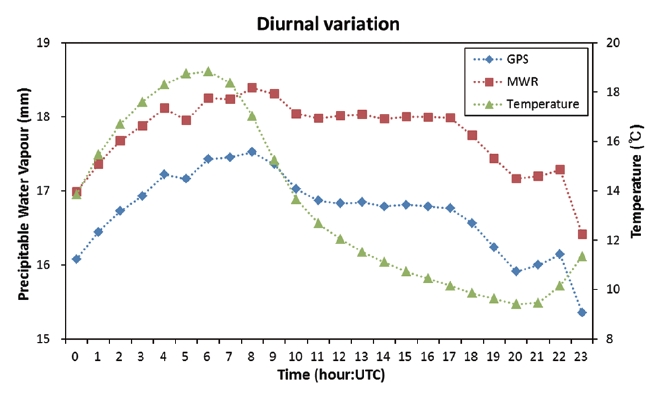
The quantity of water vapor in the atmosphere changes rapidly according to local characteristics and time. So, it is not easy to analyze PWV based on a certain specific day. However, if PWV observed for a long period is represented in diurnal variation, it is possible to analyze the degree of change in a day typically. In this section, we represent PWV observed by GPS and MWR in changes of daily cycle and analyzed the characteristics of changes in a day. The diurnal variation is calculated by averaging the measured data in each time zone over 2 years.
The changes of daily cycle for PWV measured by two equipments are represented in Fig. 6. The amplitude of changes in values calculated by GPS is about 2.2 mm and its maximum value is represented in 08 coordinated uni-versal time (UTC) and its minimum value is represented in 23 UTC. MWR PWV shows the variation range of about 2.0 mm relatively less than that of GPS and its maximum and minimum values were represented in 08 UTC and 23 UTC, respectively. The changes in daily cycle like this for PWV is represented as similar to the changes in daily cy-cle for atmospheric temperature, so, at the daytime zone when the temperature goes up, PWV increases while at the nighttime zone when the temperature goes down, it decreases.
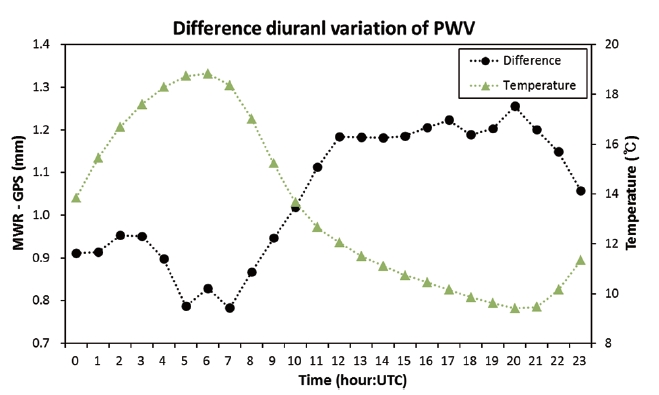
The average differences for PWV by time zone between GPS and MWR is represented as about 1.1 mm and at the afternoon time zone (05-07 UTC), the differences of mea-sured values between two equipments are represented
as the smallest value of about 0.8 mm, but in dawn time zone (19-21 UTC), the differences between two values are represented as the largest value of about 1.3 mm (Fig. 7). This is considered as due to influences similar to the error component described in Section 3.2.
In case of afternoon time zone, because the tempera-ture of earth surface is high, average temperature of at-mosphere and, consequently, GPS PWV is inclined to be overestimated. According to Jones (2008), if the average temperature is overestimated by 1°C, GPS PWV increases by about 0.08 mm. On the contrary, MWR uses the values of radiosonde as learning materials for estimated algorithm, and this value is measured as dry-biased due to influences to humidity sensor by solar radiation, and based on measured value, PWV is inclined to be under-estimated. On account of this, it is considered that the differences between two equipments are represented as small at the afternoon time zone.
On the contrary, at dawn time zone when the tempera-ture is low and the solar influence does not exist, the re-verse phenomenon occurs, so GPS PWV is underestimat-ed while MWR PWV is overestimated, and it is considered that the differences between two values are represented as relatively large. In addition, it is considered that the in-fluences of dew drops, frosts, etc. formed on protection film of MWR also acted as error elements.
Morland et al. (2009) has shown the average differ-ences between the values measured by two equipments and those measured by radiosonde in diurnal variation At daytime zone, the average differences between the val-ues measured by two equipments and those measured by radiosonde were represented similarly as about 0.4 mm, however, at night zone, the values measured by GPS was represented as 0.5 mm less than those measured by MWR by 0.1 mm. According to this research, we could confirm that the accuracy at the daytime zone was represented as similar in both equipments, but at night time zone, GPS was more accurate in measurement compared to MWR by about 17%.
We conducted a cross-correlated comparison on PWV calculated using GPS and MWR, respectively, and also an-alyzed their characteristics. The PWV of two equipments observed for 2 years represented the average differences of about 1.1 mm and the standard deviation was repre-sented as 1.2 mm and in general, the values measured by MWR was represented as larger than those calculated by GPS. Because the amount of water vapor in the atmo-sphere in Korean peninsula represents big differences depending on season, we conducted the comparative analysis on the values measured by two equipments by dividing them by season.
The average differences in PWV measured in sum-mer was represented as 1.9 mm and in winter as 0.7 mm and the standard deviation was represented as1.4 mm in summer and 0.9 mm in winter, respectively. In analysis of values measured by two equipments sorted accord-ing to season, the distribution of values measured by two equipments was represented as similar in summer with high temperature and humidity, but in winter, cold and dry, there was shown the tendency that MWR was esti-mated higher than GPS. In proportional relation between two observation values according to GPS PWV, the values measured by MWR was shown as overestimated more in winter than in summer.
As a result of analysis on values measured by two equip-ments in diurnal variation, the variation range of PWV for GPS and MWR was represented as 2.2 mm and 2.0 mm, re-spectively, and the maximum and minimum values were represented in 08 UTC and 23 UTC, respectively. The dif-ferences of observation values between equipments were represented as small at the daytime zone (05-07 UTC) and as big at dawn time zone (19-21 UTC). The reason that there occur the differences between two observation val-ues in seasonal analysis and daily cycle analysis is con-sidered as due to various error components which occur in the process of estimating PWV by individual systems.
In case of GPS data processing, it is considered that the calculated values of PWV were influenced by underesti-mation or overestimation of average temperature value or mapping function in use and in case of MWR data processing, it is considered that the observation values of radiosonde used for learning materials of estimating algorithm or protection film of scanning reflector acted as error components for measured values of PWV. In fu-ture, we are planning to execute more clear analysis on differences of measured values between equipments us-ing PWV data measured by various kinds of equipments at various locations.