To broaden the understanding of classical Cepheid structure, evolution and atmospheres, we have extended our continuing secret lives of Cepheids program by obtaining XMM/Chandra X-ray observations, and Hubble space telescope (HST) / cosmic origins spectrograph (COS) FUV-UV spectra of the bright, nearby Cepheids Polaris, δ Cep and β Dor. Previous studies made with the international ultraviolet explorer (IUE) showed a limited number of UV emission lines in Cepheids. The well-known problem presented by scattered light contamination in IUE spectra for bright stars, along with the excellent sensitivity & resolution combination offered by HST/COS, motivated this study, and the spectra obtained were much more rich and complex than we had ever anticipated. Numerous emission lines, indicating 104 K up to ~3 × 10⁵ K plasmas, have been observed, showing Cepheids to have complex, dynamic outer atmospheres that also vary with the photospheric pulsation period. The FUV line emissions peak in the phase range φ ? 0.8-1.0 and vary by factors as large as 10×. A more complete picture of Cepheid outer atmospheres is accomplished when the HST/COS results are combined with X-ray observations that we have obtained of the same stars with XMM-Newton & Chandra. The Cepheids detected to date have X-ray luminosities of log LX ? 28.5-29.1 ergs/sec, and plasma temperatures in the 2?8 × 10⁶ K range. Given the phase-timing of the enhanced emissions, the most plausible explanation is the formation of a pulsation-induced shocks that excite (and heat) the atmospheric plasmas surrounding the photosphere. A pulsation-driven α2 equivalent dynamo mechanism is also a viable and interesting alternative. However, the tight phase-space of enhanced emission (peaking near 0.8-1.0 φ) favor the shock heating mechanism hypothesis.
1. A BRIEF INTRODUCTION TO CEPHEIDS
Classical Cepheids (in this paper shall be hereafter referred to simply as Cepheids) are a fundamentally important class of pulsating variable stars. Cepheids are moderate-mass (typically 4-10 M⊙), luminous (~103-105 L⊙), white-yellow (spectral types of approximately F6-K2) supergiants (luminosity classes of Ia, Ib and II) whose radial pulsations produce periodic variations in radius, temperature and, consequently, brightness. The pulsation periods of Cepheids range from just under 2-days to as long as ~45-days (for SV Vul, but as long as ~60-days depending on the classification of S Vul). The dominant (but not the only) pulsation mechanism at work in Cepheids is the kappa (
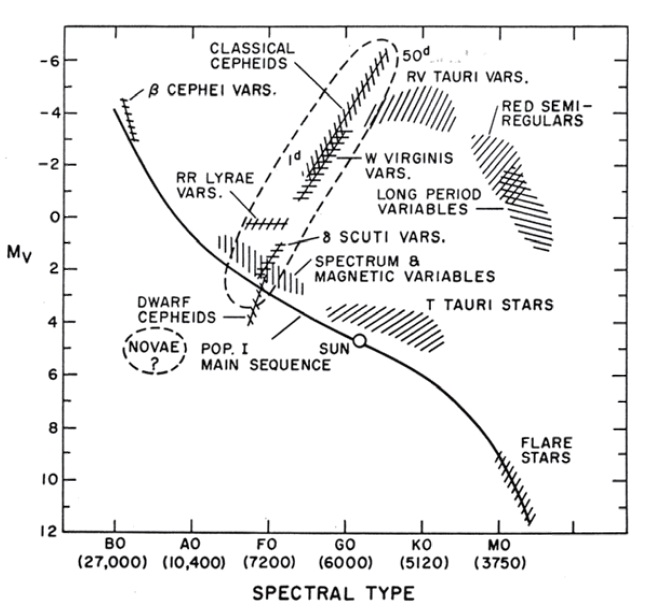
be satisfied: a sufficient amount of ionizing material (helium, in the case of Cepheids) must exist, and at a layer within the star where a transition is occurring from adiabatic to non-adiabatic behavior (Cox 1985). Specifically, a star must contain a concentration of at least 10-15% helium, roughly half of which must be ionized (Kukarkin 1975). Also, the second ionization of helium (He II to He III) begins at 35,000-55,000 K (Bohm-Vitense 1958). The stellar depth at which these temperatures exist progresses from nearer to the surface in hotter (earlier-type) stars down to depths nearer the core in cooler (later-type) stars. Because of the stringent requirements on ionization zone depth, combined with the dampening effect of strong convection in cooler stars, Cepheid pulsations can only be maintained in a specific range of effective temperature. This range is defined as the steep-diagonal “classical instability strip” where Cepheids are found on the HR diagram (Fig. 1).
The astronomical importance of Cepheids is long-standing. Since the discovery of the period-luminosity (P-L) relationship (the “Leavitt Law”) over a century ago (Leavitt 1908), Cephieds have become not just a cornerstone of the extragalactic distance scale (see Freedman & Madore 2010, but also are excellent laboratories to study radial pulsations, stellar structure and evolution of these astrophysically and cosmologically important stars. The scope of Cepheid studies has shifted somewhat over the years, specifically away from the brightest Cepheids, of which charge-coupled device (CCD) observations are very difficult. As discussed below, however, the brightest Cepheids are nonetheless very valuable because they possess long timelines of observational studies. Combining these archival data with continuing studies permits the possible delineation of stellar evolution along human timescales?e.g. changes in period, amplitude and possibly even average brightness. Additionally, due to the proximity of the brightest Cepheids, these stars are the most suitable targets for new and advanced instruments, as we will illustrate in the UV and X-ray regimes. In summary: to obtain a true understanding of their atmospheric structure and activity, the continuation and expansion of the observational database is necessary.
2. THE SECRET LIVES OF CEPHEIDS
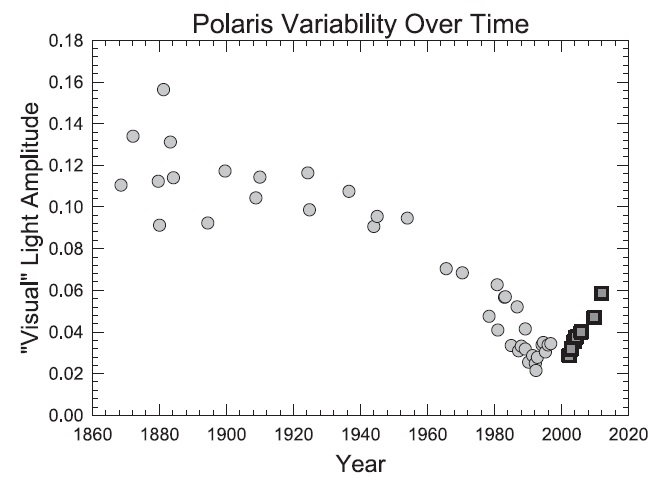
The secret lives of Cepheids (SLiC) program is a comprehensive study of Cepheid behavior, evolution, pulsations, atmospheres, heating, dynamics, shocks and winds that we have been carrying out for several years. This program currently includes ~15 of the brighter Cepheids, covering a representative range of pulsation properties. The program spans almost the entire electromagnetic spectrum, from X-ray observations (XMM-Newton & Chandra) and FUV/UV spectra Hubble space telescope (HST), the international ultraviolet explorer (IUE) and far ultraviolet spectroscopic explorer (FUSE), to the ground-based photoelectric photometry we continue to gather (along with CCD photometry of some fainter Cepheids), to IR-far-IR spectra (Spitzer space telescope). Taken together, these data have revealed Cepheids to be increasingly complex, with surprising levels of activity and variability. At optical wavelengths, we continue to monitor Cepheid light curves for evidence of evolutionary changes in morphology, average brightness and times of maximum light. For example, in several Cepheids, the pulsation period is known to change (increase or decrease) significantly, by as much as 200+ sec/yr (Turner & Berdnikov 2004). The low light-amplitude Cepheid Polaris?a program star?has been undergoing a +4.4 sec/yr increase in its pulsation period (Neilson et al. 2012). Additionally, Polaris’ light amplitude decreased for nearly a century, and it almost ceased to be a Cepheid in the early 1990s when V-band light amplitude reached minimum value of ~0.02-mag (Kamper & Fernie 1998). Our photometry first indicated the recovery of Polaris’ light amplitude in the early 2000s (Engle et al. 2004) and subsequent studies have confirmed our initial findings (Spreckley & Stevens 2008). Our 2011/12 photometry indicates the light amplitude continues its increase, with a V-band amplitude of ~0.062-mag (Fig. 2). Also, analysis of historic photometry and magnitude estimates of Polaris
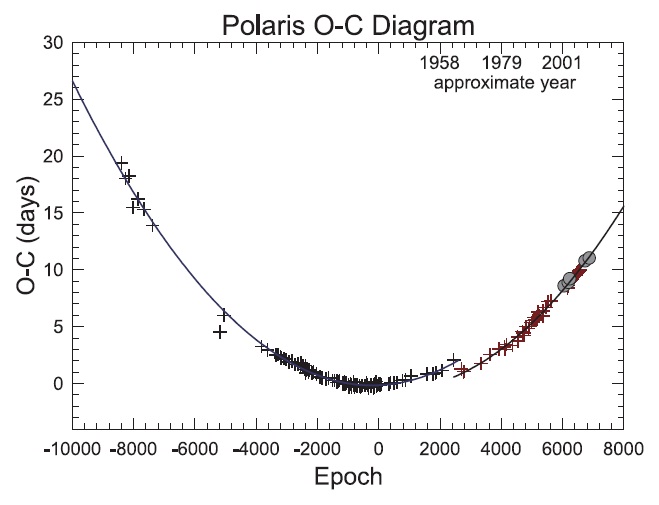
back to the Almagest (Ptolemy: circa ~130 CE; Sufi: circa ~960 CE?both listing Polaris as a “3rd” mag star, while today Polaris is near V ? 2.0 mag) indicates that its luminosity could have increased by nearly a magnitude (Engle et al. 2004) over this time. However, a great deal work is still required to reliably calibrate the historic data to the modern V-band. Finally, O-C data for Polaris show its period to currently be increasing at a rate of ~4.47 ± 1.25 sec/yr (Fig. 3), which could be indicative of enhanced mass loss from the Cepheid (Neilson et al. 2012). Another, possible more extreme example of real-time Cepheid evolution is the case of Hubble’s V19 in M33, which was discovered as a 54.7-day full-amplitude (~1.0 mag in blue) Cepheid, but has since brightened by ~0.5-mag and apparently stopped pulsating (Macri et al. 2001, Engle et al. 2011).
In addition to the evolutionary studies, we have begun investigating the atmospheric dynamics and heating of Cepheids using X-ray-UV data (the focus of this paper). Specifically, these data reveal plasmas in Cepheid atmospheres with temperatures of 103-106 K (Engle et al. 2009). Also, the hot plasmas are variable in accord with the pulsations of the Cepheids. The very long exposures required for good X-ray characterization have slowed progress in that wavelength range, but due to the excellent HST/cosmic origins spectrograph (COS) sensitivity, the UV-FUV situation is rather different.
3. PREVIOUS UV AND FUV STUDIES
The history of Cepheid “super-photospheric” (plasmas with a temperature above that of the photosphere) studies is sparse. The earliest of such studies appears to be that of Kraft (1957), who studied the Ca II H (3,968.5 A) and
Schmidt & Parsons (1982, 1984a,b) made perhaps the most thorough and revealing study of Cepheid atmospheres using IUE spectra. The wavelength range of IUE (~1,200-3,200 A) covers several important emission lines with temperatures of 104-105 K, equivalent to those found in solar-type chromospheres and transition regions. In accord with the results of Kraft (1957), Schmidt & Parsons (1982, 1984a,b) found these emissions to be variable, peaking shortly before maximum light (which is also shortly after minimum radius). At this phase, the stellar photosphere begins to expand again and, as such, this is referred to as the piston phase of a Cepheid. Transition region lines were also found, but were not as strong as chromospheric emissions and were more easily contaminated by the photospheric continuum in all but the longest exposed (and ideally phase-space located) spectra. Still, the sporadic detections of such lines served as evidence that Cepheid atmospheres could be more complex (and possibly hotter), and that perhaps a more modern, and higher resolution, instrument could reveal such lines in a more concrete way.
Motivated by these results, an analysis of FUSE (~920-1,190 A) spectra was carried out, and new observations were successfully proposed for. Sadly, although multiple FUSE observations of additional Cepheids were approved, just one observation (for β Dor) was carried out before the
fatal failure of the mission’s guidance system. The “FUSE Cepheid database” therefore includes only Polaris and β Dor (and only β Dor has multiple observations, but of somewhat poor phase coverage). However, both the C III 977 A and O VI 1,032/1,038 A line emissions were not only found in the spectra of both Cepheids, but were found to increase in strength at the piston phase of β Dor (φ ? 0.8, Engle et al. 2009). This result is in agreement with the phase of peak N V 1,240 A emission (N V forming at comparable temperatures to O VI), found from our HST/COS observations (discussed in the following section). The C III emission and variability was somewhat expected, given that it forms at similar temperatures (~ 4-5 × 10⁴ K) to emission lines studied in the archival IUE spectra. However, the discovery of the O VI lines was a pleasant surprise, given that they form in plasmas with temperatures of ~ 3-4 × 10⁵ K (Redfield et al. 2002). The O VI lines were, at that time, the hottest plasma emissions observed from a Cepheid. This study raised the questions: just how hot is a Cepheid’s atmosphere, and how is it being heated? Given the phase-timing of the enhanced emissions, the most plausible explanation is the formation of a shock that excites the atmospheric plasmas surrounding the photosphere. A pulsation-driven α2 equivalent dynamo mechanism (Chabrier & Kuker 2006) is also a viable and interesting alternative. However, the tight phase-space of enhanced FUV emissions lends found subsequently by our HST/COS spectrophotometry supports the pulsation-induced shock heating mechanism.
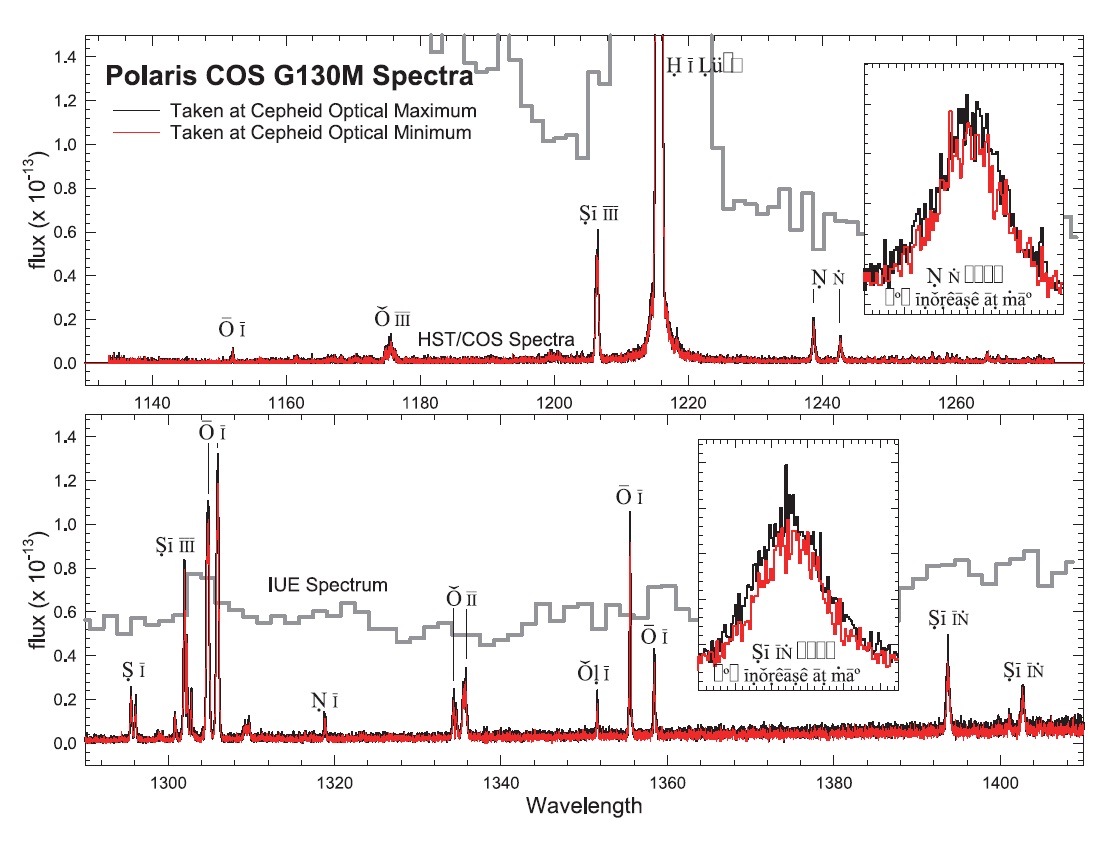
During 2009-10, we were awarded 20 HST orbits for COS spectroscopy of three Cepheids: 2 visits (2 orbits/visit) for Polaris, and 16 visits (1 orbit/visit) for δ Cep & β Dor. Because of the scattered light contamination (Fig. 4), IUE spectra of these stars only unambiguously show the only the strongest emission lines (if any). In the case of Polaris, as is shown in the Fig. 4, there was not even certainty that emission lines were present in the FUV spectra; these were only possible lines present in the IUE data. HST/COS spectra of Cepheids, however, display a wealth of emission lines not detected in archival the IUE spectra (Fig. 2). These lines define rich and complex Cepheid atmospheres and, as is well known, offer excellent atmospheric diagnostic potential (Linsky et al. 1995 and references therein), since different line species originate in plasmas of specific temperatures. Also, emission line strengths and ratios, as well as line broadening and radial velocities, when measured over the stars’ pulsation cycles, offer important atmospheric diagnostics. FUV emission line strengths and ratios (along changes in radial velocity [RV] with pulsation) can also help distinguish Cepheid supergiant atmospheric emissions from those of possible unresolved main sequence companions (if present).
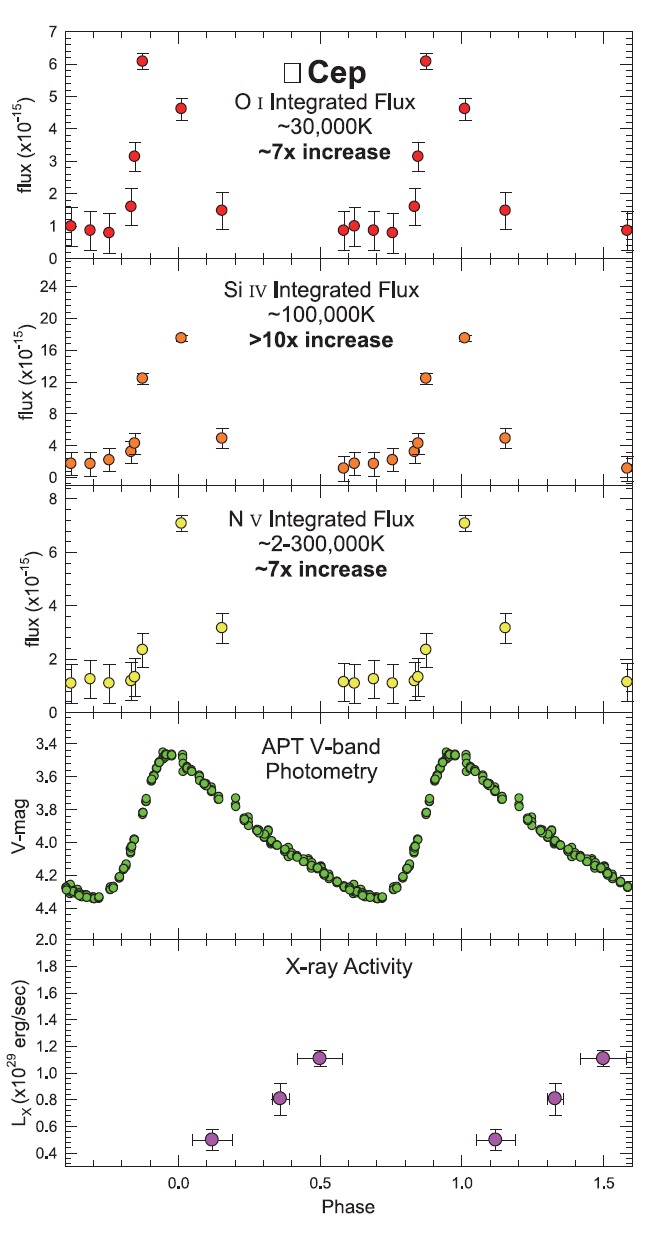
As an illustration of the initial results of the FUV program, the nearly complete COS light curves of δ Cep are shown in Fig. 5. As shown in these plots, a few features are striking: the specific phases at which line emissions begin to increase, the abruptness of the increase, and also the apparent phase-difference between various emission lines (notably in the most energetic emission feature observed: N V). In comparison to the included RV plots for each Cepheid, we see good correlation between the phase where emissions begin to peak and the beginning of the “piston phase” where the Cepheid photosphere begins to expand again. Because of this, we now realize that we most likely missed the expected phase of maximum FUV line emission in Polaris. One interesting result shown from our phase coverage of δ Cep (Fig. 5) is that the lower temperature plasma emission
lines such as OI 1,358A, appear to peak first (Phase ? 0.86 φ) while the hotter Si IV 1,400 A and N V 1,240 A emission lines reach maximum strength near ~0.94 φ (interpolated) and ~0.0 φ, respectively. But, as discussed by Bohm-Vitense & Love (1994), the emissions from the hottest plasmas are expected to peak first in the case of shock-heating, followed by the line emissions from the cooling plasmas in the post-shock regions.
5. THE (ALMOST) “UNDISCOVERED COUNTRY” OF CEPHEID X-RAY ACTIVITY
UV line emissions from 106 K (MK) plasmas are rare, typically weak, and only appear in the most active of stars (e.g. see Linsky et al. 1995 for a discussion of the coronal
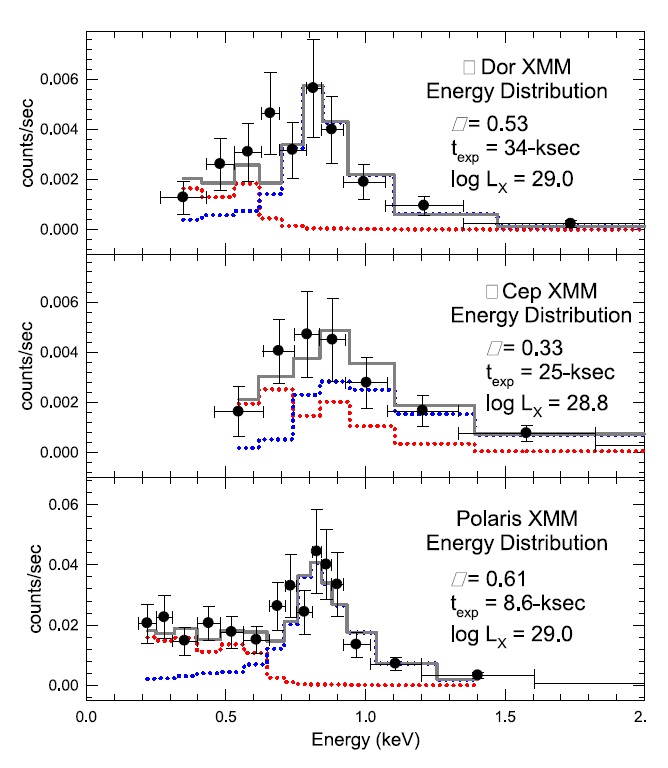
Accordingly, we successfully obtained Chandra (PI: Evans) and XMM-Newton (PI: Guinan) observations of multiple Cepheids?Polaris, δ Cep, β Dor, SU Cas and l Car have been observed so far. The nearest three Cepheids?Polaris, δ Cep & β Dor were detected in X-rays (Fig. 6: log LX ? 28.6-29.0 ergs/s). The short period Cepheid SU Cas (P = 1.95-d; d = 421 ± 36 pc: Turner et al. 2012) and the long period Cepheid l Car (P = 35.5-d; d = 498 ± 55 pc: Benedict et al. 2007) were not detected. Upper X-ray luminosity limits of log LX < 29.6 and 29.5 ergs/s were estimated for l Car and SU Cas, respectively. This means that SU Cas and l Car could indeed be X-ray sources but too distant to be detected with the < 50-ksec XMM-Newton exposures. When we began these X-ray studies a few years ago, we often encountered the argument that unresolved companions were responsible for the activity we assign to Cepheids. And of course this is possible since Cepheids are young stars (~ 50-200 Myr) and main-sequence G-K-M companions (if present) would be coronal X-ray sources. However, our HST/COS results show plasmas up to 105 K that are variable with the Cepheids’ pulsation periods?indicating these hot plasmas originate from the Cepheids. Also our (still sparse) X-ray observations of δ Cep and Polaris show variability possibly correlated with the stars’ pulsation periods, as with the FUV emission lines. While we feel confident that Cepheids are also capable of producing the detected X-ray activity, we are
awaiting further X-ray data to investigate the possible phase dependence of the X-ray emission on pulsation period. In addition to providing conclusive proof that Cepheids themselves are X-ray sources (and not the hypothetical young coronal companions previously mentioned), the additional X-ray observations would also shed more light on the formation and variability of hot (MK) Cepheid plasmas.
At first glance, the mean LX values observed for Cepheids are on the order of 30-60 × that of the mean solar value (adopting
The most plausible (and very promising) mechanism for the variable, pulsation-phase dependent UV-FUV emissions, and observed X-ray emissions, is discussed by Sasselov & Lester (1994). They conclude Cepheids could have outer atmospheres heated by acoustic (or magnetic) shock wave dissipation, in addition to the transient heating by pulsation dynamics. From this theory (and observations of the He I 10,830 A line), they predict average X-ray surface fluxes (0.05-1 keV) in the range of FX ? 600-11,000 ergs/cm2/sec. Taking into account the stellar radii of Cepheids, this suggests average LX values of ~1029 erg/s for Cepheids with P ≤ 10-days, in good agreement with what we have observed in Polaris, β Dor and δ Cep. This study was carried out in 1994, before X-rays were discovered from Cepheids (although pointed X-ray observations of the brighter (more nearby) Cepheids were carried out by Einstein and ROSAT). Our (so far) limited observations seem to confirm the theoretical expectations. Sasselov & Lester (1994) also predict the X-ray luminosities of Cepheids could vary by a factor of ~2.5 × over the pulsation period. Indeed, as shown in Fig 5, the X-ray observations to date for δ Cep vary by (at least) by a factor of ~2. Additional phase coverage is needed to cover the expected X-ray maximum (during 0.7-1.0 φ) to determine the true range in X-ray emissions.
As shown here, there is still much to learn about the most important class of pulsating variable stars?the classical Cepheids. In terms of stellar evolution, our studies, as well as others, provide strong evidence of “real time” evolutionary changes taking place. This is particularly striking from the well-documented behavior of the nearest Cepheid-Polaris (Neilson et al. 2012). As discussed previously, Polaris has been undergoing significant changes in its light curve, pulsation period and possibly in its luminosity. But this is not an isolated case, many other Cepheids, especially the more luminous, long period (higher mass) stars that have sufficiently long time baselines (>50 years) show changes in their pulsation periods (Turner & Berdnikov 2004). This makes a strong case for continuing photometry and spectroscopy of the brighter galactic Cepheids that have observations going back several decades to search for subtle (and sometimes not so subtle?as in the case of Hubble variable V19 in M33) changes arising from possible evolution effects. As an important part of the SLiC program, we are continuing photometry of over a dozen Cepheids.
In addition to the well-known optical variability of Cepheids, they are also found to have variable pulsation-phased UV line emissions. These emissions originate in plasmas with temperatures well above those of the Cepheid photospheres, showing Cepheids that possess extended atmospheres of heated, ionized plasma. The onset of enhanced line emissions (at phase ~0.8 φ) is coincident with the beginning of the “piston phase” of each Cepheid?the phase at which the photosphere begins expanding from minimum radius. This leads us to favor the emergence and propagation of a shock, from the photosphere and through the surrounding atmosphere, as the most probable mechanism for the observed heating. This is in agreement with the study of Fokin et al. (1996), where spectroscopic observations of δ Cep were used to construct a pulsational model of this prototype Cepheid. The model shows shocks to pass through the surface of the Cepheid as it pulsates, the strongest of which passes through the surface right around φ ? 0.8, the beginning of the enhanced UV line emissions. However, the Cepheids clearly display “quiescent” atmospheres at all observed phases. Because of this, we feel that additional smaller shocks could maintain a lower level of atmospheric heating throughout the all pulsational phases. However, a more likely explanation is that magnetic heating could be responsible for maintaining the “quiescent atmosphere” and the passage of a strong shock is then responsible for the phases of enhanced emission. Depending on the line species under study, the Cepheid emissions can vary by as much as roughly a factor of 10.
Our X-ray observations of Polaris, β Dor and δ Cep, show that Cepheids are indeed variable X-ray sources with LX ? 6-12 × 1028 ergs/s and kT ? 0.6-0.8. However, originally there were doubts that the detected X-rays were not from the Polaris (and the other Cepheids) but could originate from coronal X-ray emissions from young cool star companions. As discussed previously, the multiple HST-COS FUV observations of δ Cep and β Dor carried out by us over the pulsation cycles of each star show a pronounced 7-10 fold peak in the FUV line emissions (particularly, in the N V 1,240 A emission line which forms in hot ~3 × 10⁵ plasmas) near the expected ~ 0.8-1.0 φ. The apparent variations of high temperature FUV emissions (such as N V) with pulsation phase, as well as evidence for the X-ray variability of Polaris and δ Cep, show that (in these cases) the Cepheids themselves are likely the X-ray sources. It will be important to secure X-ray observations covering the critical pulsation phases of 0.7-1.0 φ, presumably when the X-ray activity should reach maximum strength.
In a broader context, recent multi-phase studies of Galactic and Magellanic Cloud Cepheids (Ngeow & Kanbur 2006) find the crucial P-L relation to display markedly different, nonlinear behavior during φ ? 0.70-0.95. As shown in Fig. 5, this corresponds to the phase at which the FUV line emissions are strongest in δ Cep and β Dor, and also coincides with observed rapid RV changes. The enhanced FUV emissions (and energy deposition) produce additional photospheric heating, with possible impacts on the P-L Law. The proposed HST/COS observations should also lead to much better characterizations of the shock-heating behavior and atmospheric outflow velocities in Cepheids, placing important constraints on Cepheid mass loss, a very important topic in terms of both the so-called “Cepheid mass discrepancy” and Cepheid evolution in general.
In addition to our continuing ground-based photometry program, we have recently submitted an observing proposal to the HST for additional HST/COS FUV spectrophotometry of δ Cep and β Dor to better define the exact phase of maximum line emission. The observations are requested to cover the critical ~0.8-1.0 pulsation phases. Also, to expand the parameter space of observed Cepheids, we have requested HST/COS phase-sampled FUV spectrophotometry of the long period (P = 35.5-d), luminous, high-mass Cepheid, l Car. To complement these FUV programs, we also have proposed for additional Chandra X-ray observations (and, in the future, XMM-Newton) of the Cepheid prototype/namesake, δ Cep, and the ~10-day “bump” Cepheid, β Dor, to expand phase coverage. When full X-ray and UV phase coverage is realized, we will carry out detailed models to characterize the shock behavior of the Cepheids, and emission measure analyses to detail their atmospheric plasmas (e.g. density, temperature distribution).