Polar cap potential has long been considered as an indicator for the amount of energy flowing in the magnetosphere-ionosphere system. Thus, the estimation of polar cap potential is important to understand the physical process of the magnetosphere. To estimate the polar cap potential in the Northern Hemisphere, merging electric field by Kan & Lee (1979) is adopted. Relationships between the PC index and calculated merging electric field (E*) are examined during full-time and storm-time periods separately. For this purpose Dst, AL, and PC indices and solar wind data are utilized during the period from 1996-2003. From this linear relationship, polar cap potential (Φ*) is estimated using the formula by Doyle & Burke (1983). The values are represented as 58.1 ± 26.9 kV for the full-time period and 123.7 ± 84.1 kV for a storm-time period separately. Considering that the average value of polar cap potential of Doyle & Burke (1983) is about 47 kV during moderately quiet intervals with the S3-2 measurements, these results are similar to such. The monthly averaged variation of Dst, AL, and PC indices are then compared. The Dst and AL indices show distinct characteristics with peaks during equinoctial season whereas the average PC index according to the month shows higher values in autumn than in spring. The monthly variations of the linear correlation coefficients between solar wind parameters and geomagnetic indices are also examined. The PC-AL linear correlation coefficient is highest, being 0.82 with peaks during the equinoctial season. As with the AL index, the PC index may also prove useful for predicting the intensity of an auroral substorm. Generally, the linear correlation coefficients are shown low in summer due to conductance differences and other factors. To assess the role of the PC index during the recovery phase of a storm, the relation between the cumulative PC index and the duration is examined. Although the correlation coefficient lowers with the storm size, it is clear that the average correlation coefficient is high. There is a tendency that duration of the recovery phase is longer as the PC index increases.
The PC index (PCN, PCS) was designed to monitor polar cap magnetic activity generated by geoeffective solar wind parameters. The PC index measures the part of the DP2 currents calculated from the projection of the horizontal magnetic perturbation on the dawn-dusk direction. This index is derived from the magnetic perturbations measured at a single magnetometer station near the magnetic pole, Thule (PCN) or Vostok (PCS) in the Northern and Southern Hemispheres. First attempt to examine the polar cap magnetic activity was made by Troshichev et al. (1979). They proposed a polar cap magnetic activity index based on data from a single near pole station: Vostok (83.4° in the Southern Hemisphere) and Thule (86.5° in the Northern Hemisphere). Troshichev & Andrezen (1985) showed the ground geomagnetic disturbances measured at the Vostok station highly correlate with the merging electric field. Afterwards, the main principles of the PC index derivation as an indicator of magnetic activity in polar cap regions were formulated by Troshichev et al. (1988). They derived an ionospheric electric field from a merging electric field by mapping down along magnetic field lines with the use of the magnetic field lines convergence factor.
In solar wind?magnetosphere coupling, energy transfer from solar wind into the magnetosphere is one of the fundamental problems in magnetospheric physics. It is well known that the coupling function is important to understand the relationships between ionosphere-magnetosphere and solar wind energy input. Perreault & Akasofu (1978) showed that interplanetary energy flux is estimated on the basis of Poynting flux and its variations with the rate of energy dissipation in terms of three subjects for 15 major geomagnetic storms. They found that the energy flux entering the magnetosphere is dissipated through substorm processes. As a result, they concluded that a geomagnetic storm represents the combined influence of Poynting flux and the substorm process. Continuously suggesting a schematic illustration of reconnection geometry, Kan & Lee (1979) introduced the equations of a merging electric field (
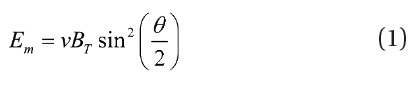
In Eq. (1),
and
On the other hand, Troshichev et al. (1996) examined the statistical dependence of the polar cap diameter on PC index of magnetic activity and the cross-polar cap voltage on PC index. In addition, they showed the relationship between observed cross polar cap voltage and various interplanetary quantities. Eq. (3) below is the obvious linear relationship
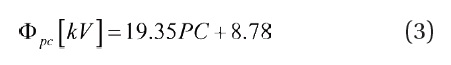
with the correlation coefficient equaling 0.797.
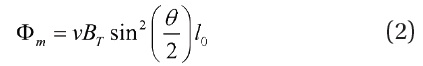
Since then, some researchers have investigated the relationship between merging electric field and the PC index through various methods (Troshichev et al. 2000). Using the Assimilative Mapping of Ionospheric Electrodynamics (AMIE) technique, Ridley & Kihn (2004) determined cross polar cap potential, polar cap electric field, and polar cap area. It is noticeable that the seasonally dependent y-intercept is considered in their linear relationship between AMIE data and the PC index. Doyle & Burke (1983) analyzed the S3-2 measurements of the polar cap potential during the period from August through to December, 1976 and obtained the linear relation between polar cap potential (
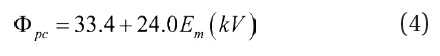
Their measured potentials ranged from 170 kV during a substorm to 12 kV during two periods of a northward interplanetary magnetic field. Chun et al. (2002) also showed the linear relationship between the PC and cross-polar potential. They developed average patterns of Joule heating as a function of PC using 56 days of AMIE data derived from various case studies.
The polar cap potential tends to be saturated when the value of the merging electric field (
As a proxy substorm indicator, it has been argued that the PC index is useful. Indeed, some research has shown these relationships in various manners. VennerstrØm et al. (1991) confirmed that there is indeed a high correlation between the PC and AE indices during winter and the equinox, the linear correlation coefficient being 0.8-0.9 for Thule. They convinced that the PC can be used as a fast available indicator of DP2 and DP1 activity in polar regions. As a function of time delay τ, Troshichev & Lukianova (2002) analyzed a distribution of coefficients of correlation (R) between PC and AE values during times of 12 magnetic storms in 2000. They found that each sharp increase of the PC index indicates a development of magnetospheric substorms in a matter of minutes. Pointing out that there is a certain relationship between the energy input into the magnetosphere and energy stored in the magnetospheric tail, it is suggested that the magnetosphere responds to the same variation of the solar wind parameters in a different manner. Takalo & Timonen (1998) also studied that the PC and AU indices show similar dynamics through analyzing the structure function. It is generally believed that isolated substorms are often correlated with sudden changes in solar wind.
To study the relations of polar cap magnetic activity to magnetic disturbances in the auroral zone, Troshichev & Janzhura (2009) analyzed the behavior of 62 repetitive bay-like magnetic disturbances. They further noted that the growth phase duration and intensity of magnetic disturbances in the auroral zone highly correlate with the PC growth rate. They also concluded that the PC index may be considered as a convenient proxy of the solar wind energy input of the magnetosphere. Lyatskaya et al. (2008) also investigated the relationship between substorm activity and magnetic disturbances in two polar caps. For this analysis, they used data from four years, 1990-1991 and 1997-1998, respectively. It is well known that the AL index represents westward auroral electrojets. They also examined the seasonal variation of the linear correlation coefficients R, for the correlation of the AL index with the polar cap index.
In this study, I performed research in three parts. First, the relationship between the PC index and the calculated merging electric field (
The PC index used in this study was obtained from the Thule (Qaanaaq, 86.5° magnetic latitude in the Northern Hemisphere) ground magnetometer that is operated by the Danish Meteorological Institute (http://www.dmi.dk). The solar wind data was provided via instruments on the advanced composition explorer (ACE) spacecraft. The geocentric solar magnetospheric coordinate system is adopted for solar wind velocity and interplanetary magnetic field data. The Dst and AL indices data for this study were provided by the World Data Center for Geomagnetism, Kyoto (http://wdc.kugi.kyoto-u.ac.jp). I used a one-hour average for the Dst index and a 5 minute average data for
3.1 Estimation of Polar Cap Potential from PC Index and Calculated Merging Electric Field (E*)
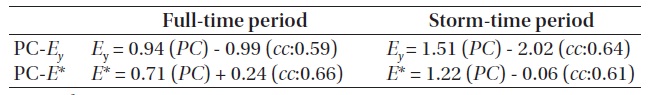
For the purpose of estimating the polar cap potential, the relationship between the PC index and the calculated merging electric field (
[Table 1.] The linear relationships between PC index and Ey, E* during the period of 1996-2003.

The linear relationships between PC index and Ey, E* during the period of 1996-2003.
PC index and
As noted in the previous section, Troshichev et al. (1996) investigated the relationship between polar cap potential and the PC index using only two months’ worth of data. However, in this study, one-hour averaged data over 8 years were used for analysis and utilized the Doyle & Burke (1983)’s empirical relationship after calculating
[Table 2.] Estimated polar cap potential (φ*) using the Doyle & Burke (1983)’s empirical relations.
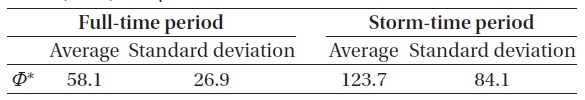
Estimated polar cap potential (φ*) using the Doyle & Burke (1983)’s empirical relations.
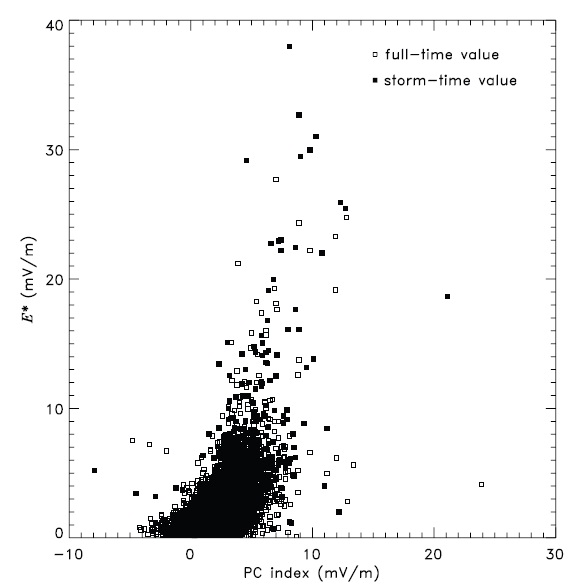
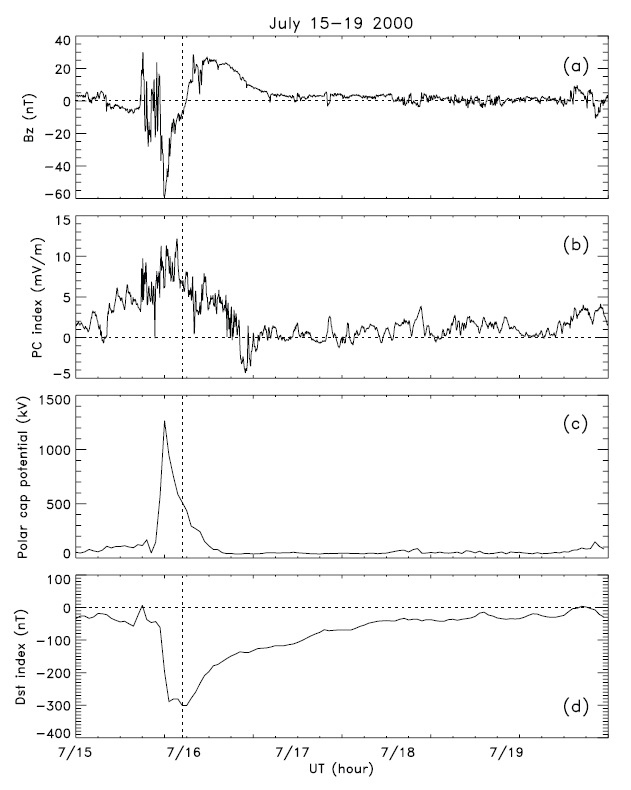
time, the PC index was also recorded above 10 mV/m several times as shown in Fig. 2b. It is well known that the polar cap potential is generally about 50 kV under ordinary conditions, however, such changes up to a few hundred kV or exceeds 1,000 kV during a magnetic storm period. Considering that the average value of the polar cap potential by Doyle & Burke (1983) is about 47 kV during moderate quiet intervals, these results are similar to such.
3.2 Relationship Between the AL Index and PC Index
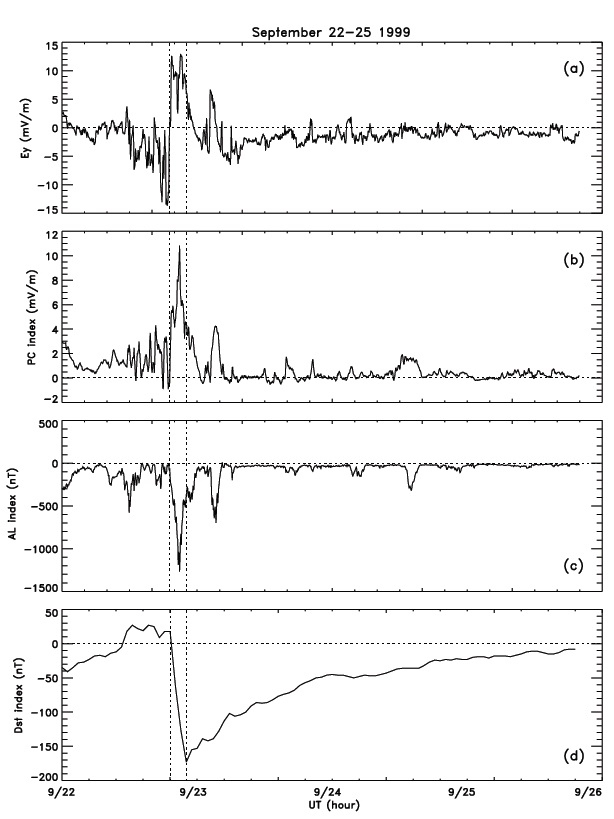
Fig. 3 shows variations of (a) interplanetary electric field (Ey), (b) PC index, (c) AL index, and (d) Dst index for 22-25 September 1999. The horizontal axis denotes universal time and two vertical dotted lines represent the main phase of the storm.
and c, the PC index was recorded being the maximum value of 10.84 mV/m at 21:45 UT and the AL index had also reached the minimum value recorded as -1,269 nT at that time prior to Dst reaching the minimum value. As shown in Fig. 3d, the Dst index decreased rapidly for just
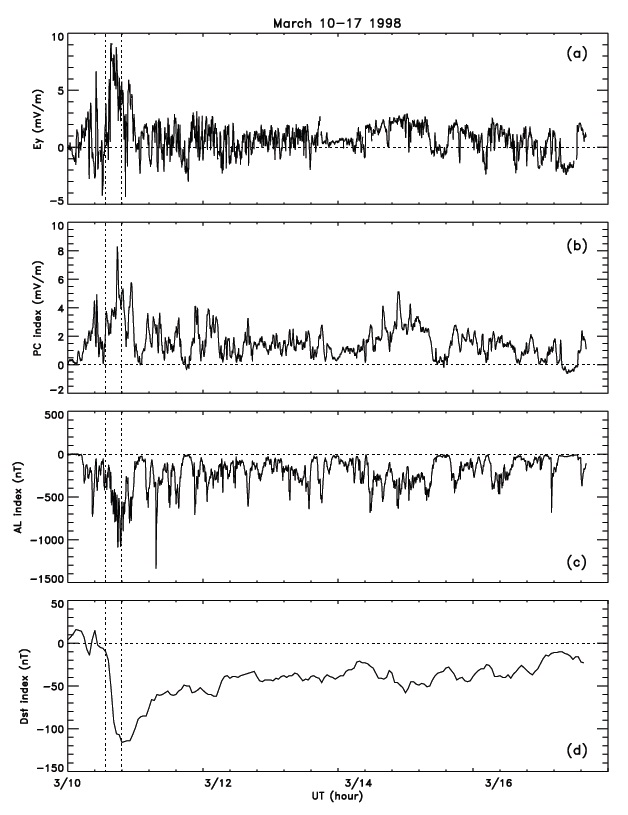
3 hours, and the minimum value of ?173 nT at 00:00 UT was recorded on 23 September 1999. In Figs. 3b and c, the variation of AL and PC indices are very similar during main and recovery phases, both. Fig. 4 shows another example for the variations of
As can be seen in Fig. 4, the variation of the PC index is also similar to that of the AL index rather than the
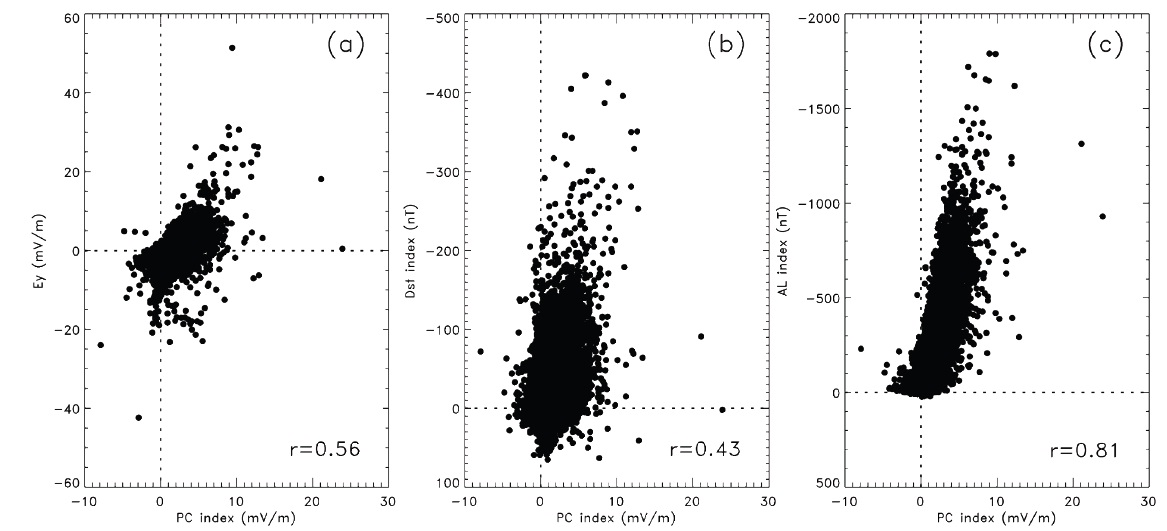
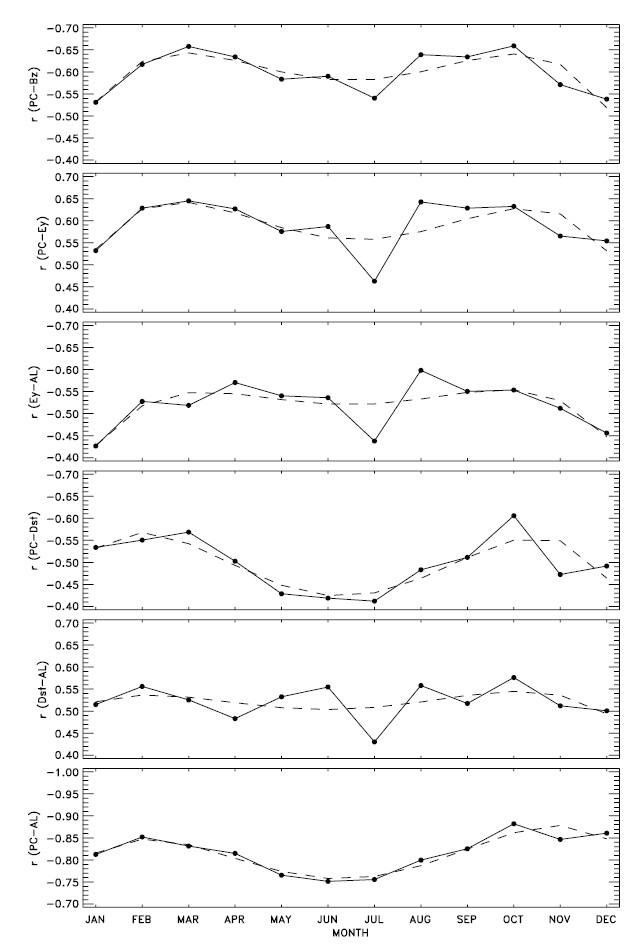
and geomagnetic indices, the monthly variations of the linear correlations coefficients for PC-
in winter. To summarize, the PC index appears to be more related to the AL index than other relationships. In other words, the PC index may be useful as a tool to diagnose an auroral substorm.
3.3 The Role of the PC Index for the Recovery Phase of Magnetic Storms
On the basis of Figs. 3 and 4, it is evident that the PC index is more closely related with the AL index than
I estimated the polar cap potential from the relationship between the PC index and calculated merging electric field (
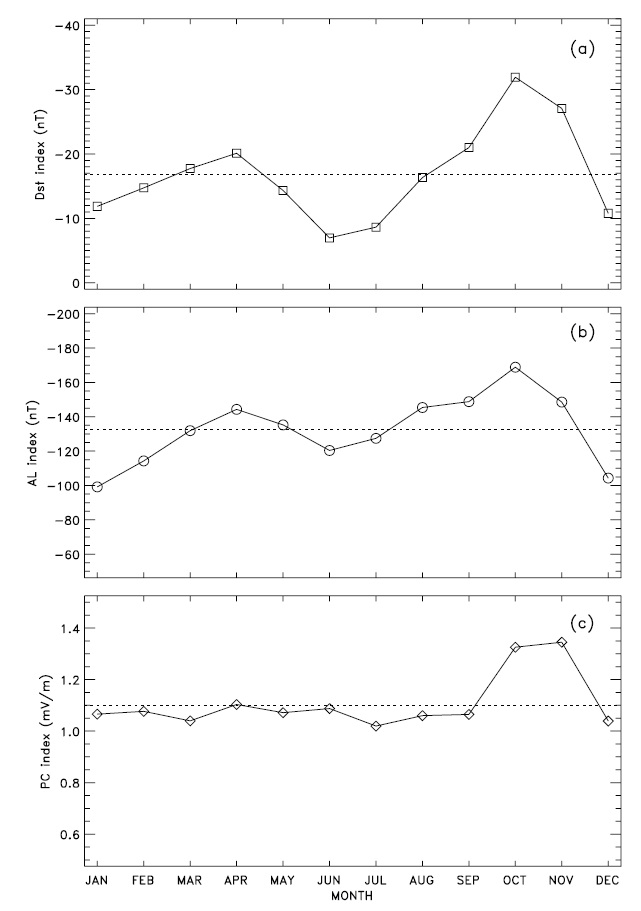
On the basis of the Russell & McPherron effect, I compared the monthly averaged variations of Dst, AL, and PC geomagnetic indices. The seasonal variations of Dst and AL indices are similar and show semiannual variations maximizing during the equinoctial season and minimizing during the solstitial season. However, the variations of the PC index show a higher value in autumn than in spring. Also examined are the monthly variations of the linear correlation coefficients for PC-
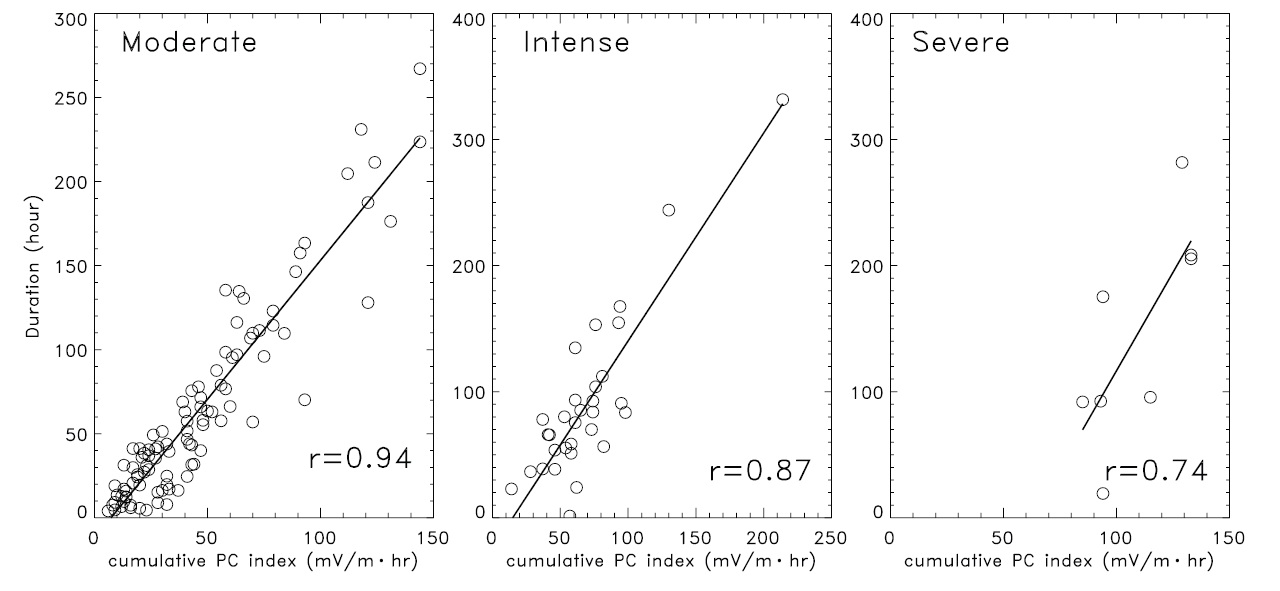
Admitting that the decay of the ring current is a dominant process of the recovery phase, it would be worth examining the contribution of the PC index during such. For this purpose, the correlation between the PC index and the duration of the recovery phase was examined. Although the correlation coefficient lowers with the storm size, it is clear that the average correlation coefficient is high. The correlation coefficients are 0.94, 0.87, and 0.74 for moderate, intense, severe storm, respectively. There is a tendency that the duration of the recovery phase is longer as the PC index increases. These results may be important to study the actual role of the PC index during the recovery phase.
In the early days, Troshichev et al. (1996) showed the statistical dependence of the polar cap diameter on the PC index of magnetic activity from the EXOS D spacecraft from January to June, 1990. Their results of the polar cap potential differ from other results, including my own. This is because the data set and methods are different and are accomplished in separate manners. Recently, the PC index was discussed at the International Association of Geomagnetism and Aeronomy (IAGA) meeting and is still a controversial topic within the IAGA. Pointing out that the descriptions of the derivation procedures are found not to be adequate to independently derive the actual PC indices, McCreadie & Menvielle (2010) emphasize the importance of the PC index derivation in order to endorse such as an official index. A full research of the PC index may be necessary in the future. Nevertheless, researchers have reported on various subjects in terms of the PC index .