As an element of the greenhouse gases, water vapor has a large variability and plays a key role in various temporal and spatial scales of meteorological phenomena. Water vapor is also involved in the formation of clouds and aerosol, and closely related to the energy transport in the atmosphere. The amount of water vapor tends to decrease upwards from the ground surface to the upper atmosphere, and the horizontal and vertical distributions of this element is less uniform compared to those of the other gases in the atmosphere. Inaccuracy in observation and knowledge of the temporal and spatial distributions of the amount of water vapor may result in failure in weather forecasts, particularly for precipitation.
In order to improve the predictability for precipitation in a weather forecast, it is important to fully understand the temporal and spatial distributions of water vapor by precise observations. Currently, radiosondes, microwave radiometers, and remote sensing satellites are mainly used in Korea for observations of the vertical distribution of water vapor.
Among those observing methods, the radiosonde is the oldest instrument for the observations of water vapor in the troposphere and provides the longest period of water vapor data (Durre et al. 2009), which are available over extensive areas throughout the world for a period of longer than 60 years (Wang & Zhang 2008). A radiosonde produces vertical data of air pressure (geopotential height), air temperature, relative humidity, and wind 2 to 4 times a day as it floats up. Although radiosondes have been one of the main observing methods for measuring water vapor in the atmosphere, their observations have the undesirable characteristics that a recycling after an observation is difficult and their operations cost a lot. Besides, the time resolution is limited to 2 times per day in most cases and a number of studies criticized the imprecision and bias in the water vapor observations using radiosondes (Elliott & Gaffen 1991, Lorenc et al. 1996, Motell et al. 2002).
In the previous studies on the error and bias of radiosondes, it was considered that the bias between a global positioning system (GPS) and a radiosonde in their observations of precipitable water vapor (PWV) could be mostly explained by the dry bias of radiosonde in daytime (Liou et al. 2000, 2001). It was also shown that the dry bias of radiosonde was greatly affected by the solar radiation (Wang et al. 2002) and the main factors of the radiosonde bias were relative humidity in the atmosphere and the solar radiation depending on the elevation (Wang & Zhang 2008). In addition, Kwon et al. (2007) showed that a radiosonde observation had a dry bias compared to a GPS observation and the PWV difference between those two observations increased especially in daytime.
The advantages of the PWV measuring technique using a GPS are that the observation is always possible regardless of the atmospheric condition, that the operation costs relatively less, and that the data can be obtained at a higher spatial resolution proportional to the number of GPS observation stations. A GPS PWV is derived by inversely converting the delay of GPS signal, which is caused by refractions by water vapor in the course from the satellite to the ground station, and it is known that the precision of a GPS PWV is comparable to that by a radiometer or a radiosonde (Bevis et al. 1992, 1996, Rocken et al. 1995, Businger et al. 1996, Duan et al. 1996). Currently, the Korea Astronomy and Space Science Institute (KASI) produces GPS PWV data at the time resolution of 10 minutes using GPS data from the permanent GPS network. An atmospheric variation in a small time scale can be detected by this level of time resolution, which is the superiority of the GPS observations over the conventional radiosonde observations.
In their analysis of the daytime and nighttime biases of the radiosonde PWV, Turner et al. (2003) used the PWV derived from radiometer observations as the reference of comparison but they suggested to rather use the PWV from GPS observations for the reference since some problems could occur in the calibration procedure or in the model for calculating PWV from brightness temperature. Also, Nakamura et al. (2004) considered that the accuracy of the GPS PWV was equivalent to or even higher than the PWV derived by a radiosonde. Wang & Zhang (2008) set the GPS PWV as a reference in their PWV comparisons, mentioning that the PWV difference between the radiosonde and GPS observations were explained by errors in the radiosonde data in most cases.
In this study, we compare the PWV from the GPS observation station at Sokcho provided by KASI with the PWV derived from the radiosonde observations at the Sokcho Regional Meteorological Office for an analysis of the radiosonde bias depending on the type of sensor. Through this comparison, the characteristics of the radiosonde PWV data of each sensor type are examined in different cases of seasons and observing times (day and night). In this paper, we first introduce the observation data and our analysis method, and then present results from the comparison of PWV between the GPS and radiosonde data.
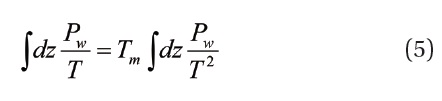
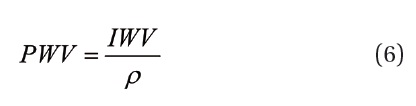
PWV, which is the object for the comparison between the two observational instruments in this study, is the total mass of water vapor contained in an air column of a unit cross-section (1 m2) extended up from the ground surface to the top of the atmosphere. PWV is used as a measure of the amount of water vapor in the atmosphere and calculated by (Ninomiya 2003):
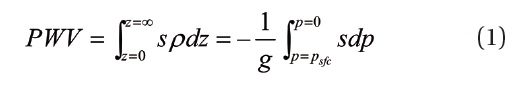
where
A GPS signal is delayed as it passes through the tropospheric part of the atmosphere and such a signal delay is classified into dry delay and wet delay depending on the composition of the atmosphere; a dry delay is caused by oxygen, nitrogen, carbon dioxide, etc. while a wet delay is by water vapor. Zenith total delay (ZTD) is divided into two parts: zenith hydrostatic delay (ZHD) by dry air and zenith wet delay (ZWD) by water vapor (Song et al. 2002).
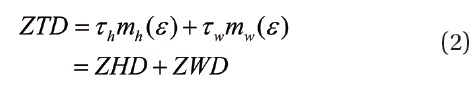
In this equation, τ denotes the dry delay and wet delay in the zenith direction, and
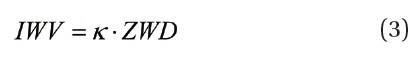
where κ is defined as in Eq. (4).
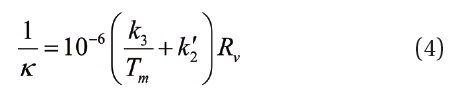
where
Bevis et al. (1992) showed that κ can be determined from the surface temperature in the relative root mean square error (RMSE) range of 2%, and that the error of
where
We estimated
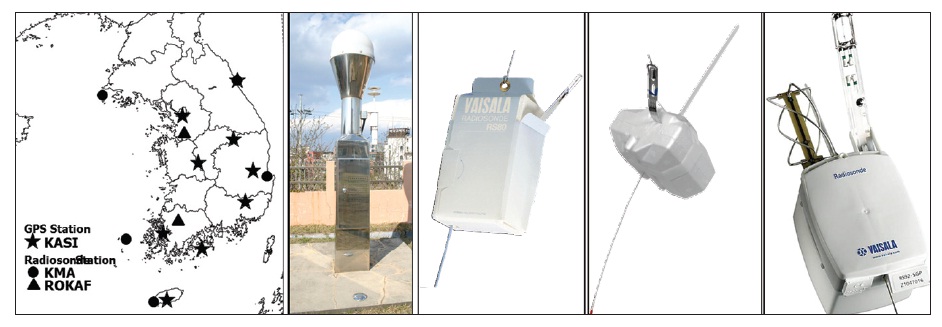
Fig. 1 shows the geographical distribution of the GPS
[Table 1.] The information about GPS and radiosonde observatories.
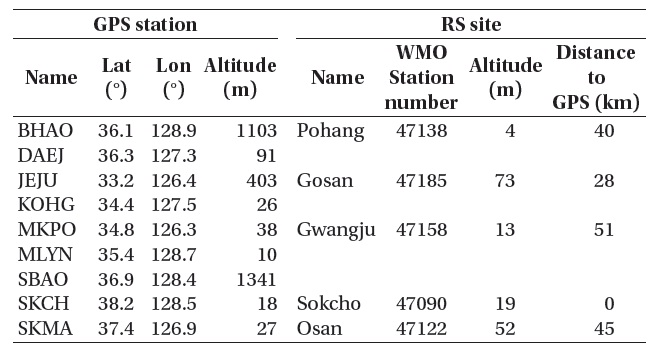
The information about GPS and radiosonde observatories.
and radiosonde stations, the GPS observation tower located in Sokcho, and the radiosonde sensors analyzed in this study. The information on the GPS and radiosonde stations in Table 1 shows that 5 radiosonde stations are located within 60 km from the GPS observation stations, while both a GPS and a radiosonde are positioned at the same station in Sokcho as mentioned before. The first GPS observation in Sokcho was performed on July 7, 1999 and the meteorological data for the estimation of PWV have been obtained since December 14, 2005.
Nine GPS stations are located in Daejeon (DAEJ), Mokpo (MKPO), Milyang (MLYN), Sokcho (SKCH), Seoul (SKMA), Jeju (JEJU), Mt. Bohyeon (BHAO), Mt. Sobaek (SBAO) and Goheung (KOHG) (station codes in parenthesis). Radiosonde observations are currently operated at 5 locations including Sokcho (47090), Baekryeongdo (47102), Pohang (47138), Heuksando (47169) and Jeju (47185) by the Korea Meteorological Administration, and also in Osan (47122) and Gwangju (47158) by the Air Force. Data from the public website of the University of Wyoming, USA (http://weather.uwyo.edu/upperair/sounding.html) were used for the PWV results of radiosonde.
The Sokcho Regional Meteorological Office has been
performing radiosonde observations twice a day (4 times a day depending on the situation) since June 1, 2001 and has a GPS observation station in its site which is operated by KASI. For the radiosonde sensors at the Sokcho office, Model 1524 of Jinyang Engineering was used prior to 2000 and then Model RS80-15L of Vaisala (Finland) was adopted until April, 2007. Model DFM-06 by GRAW (Germany) was working from 00:00 UTC on May 1, 2007 to 12:00 UTC on May 31, 2009, followed by Model RS92-SGP by Vaisala until now.
2.2 Sample Selection and Analysis Method
Statistically, the bias and error of radiosonde are classified into systematic bias and random error, respectively, which are quantitatively expressed with mean bias and RMSE. The systematic bias represents the degree of bias for the sensor and can be corrected, while the random error represents the range of values varying irregularly within the uncertainty of the sensor where a smaller random error means the higher precision of the sensor (Kim et al. 2009). A reference data set is required to be compared with the radiosonde data for the estimation of the systematic bias and random error of a radiosonde. Kim et al. (2009) calculated correlation coefficient, mean bias, and RMSE comparing with European Centre for Medium-Range Weather Forecasts data of air temperature and relative humidity for each radiosonde sensor. In this study, we use the GPS PWV data estimated by KASI.
[Table 2.] Summary of radiosonde data sets.
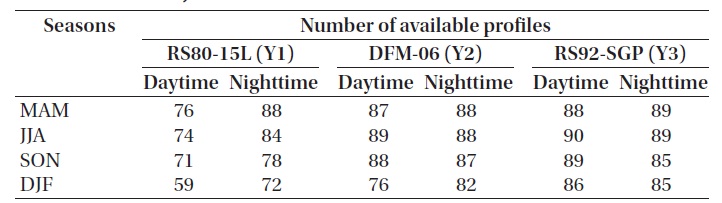
Summary of radiosonde data sets.
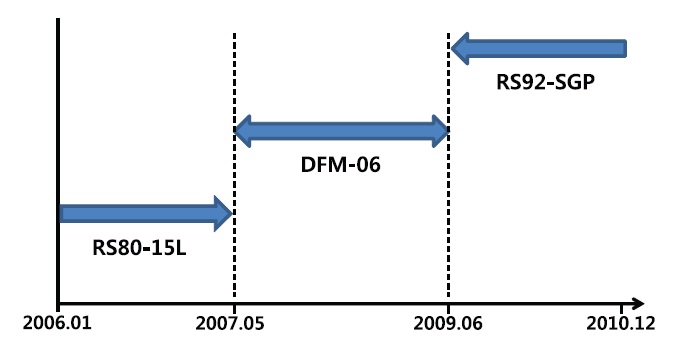
As mentioned earlier, the PWV estimation using meteorological data observed by the meteorological sensors on the GPS observation tower in Sokcho was initiated on December 14, 2005. The radiosonde sensors were replaced later at 00:00 UTC on May 1, 2007 and at 00:00 UTC on June 1, 2009 (Fig. 2).
Of the period from 2006 to 2010, the scope of analysis in this study is confined to 2006, 2008, and 2010 when each of the three types of radiosondes in Fig. 1 was engaged, respectively. To consider the seasonal and day/night differences in our analysis of the water vapor data from each radiosonde sensor, the radiosonde PWV is compared to the GPS PWV estimated by the 00:00 UTC data and the 12:00 UTC data, separately, which are the observing times of the radiosonde. Table 2 presents the number of analyzed observations by the Sokcho radiosonde separately in daytime and nighttime in each season. The cases in which the radiosonde observation was not successful or the required data of GPS PWV is missing are not counted in Table 2.
3. COMPARISON RESULTS AND ANALYSIS
Analyzing the PWV data from the Sokcho GPS station and the radiosonde at the Sokcho Regional Meteorological Office, which were estimated for the periods in Table 2, we investigate the difference between the GPS PWV and the radiosonde PWV for each type of radiosonde sensor separately in daytime and nighttime in different seasons in each year of 2006, 2008, and 2010.
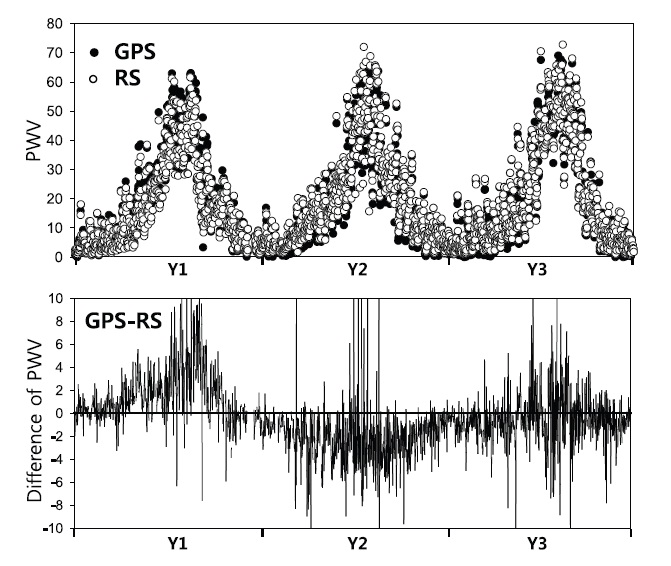
Fig. 3 presents the GPS PWV and the radiosonde PWV measured in Sokcho and their differences as a function of time. The horizontal axis in this figure ranges from January 1 to December 31 in each year of 2006, 2008, and 2010, and the vertical axis is for PWV in millimeters. The two observations are consistent with each other in general in the time-sequential representation, which shows the
seasonal variation of PWV. In Fig. 3, the sudden variations are considered to be the PWV increases or decreases in the atmosphere relative to precipitation phenomena, and the PWV differences show a tendency of dry bias of radiosonde in 2006 and wet bias in 2008.
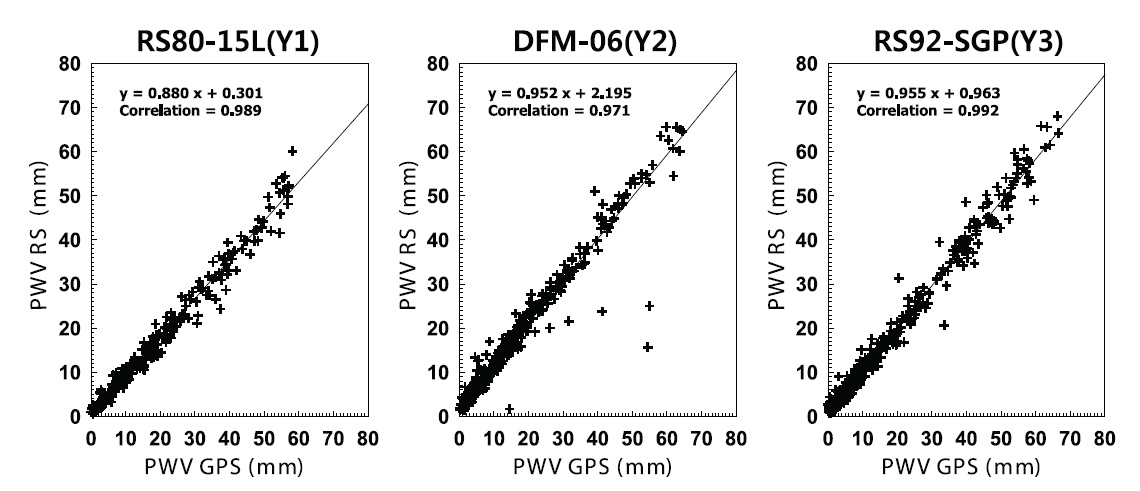
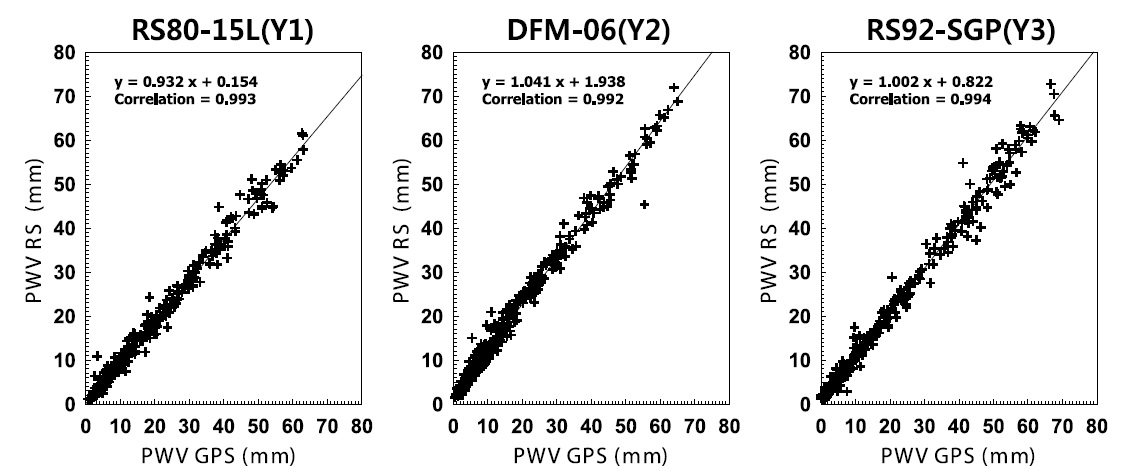
Figs. 4 and 5 are scatter diagrams of the radiosonde PWV and the GPS PWV in daytime and nighttime, respectively, for an investigation of the dependence of the PWV differences on the observing times of radiosonde. In these figures, the slopes of regression lines for the daytime and nighttime observations are 0.880, 0.952, 0.955 and 0.932, 1.041, 1.002, respectively, where the dry bias is found in the daytime observations of radiosonde as known in the previous studies. The degree of correlation between the radiosonde PWV and the GPS PWV is calculated higher for the nighttime observations than for the daytime observations, and it
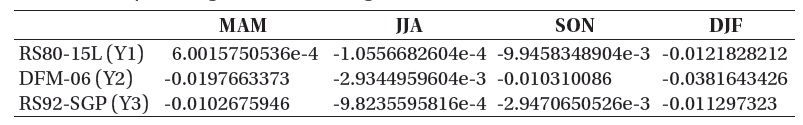
[Table 3.] Slopes of regression lines in Fig. 6.

Slopes of regression lines in Fig. 6.
[Table 4.] Mean biases and RMSEs of GPS and radiosonde PWV (unit: mm).
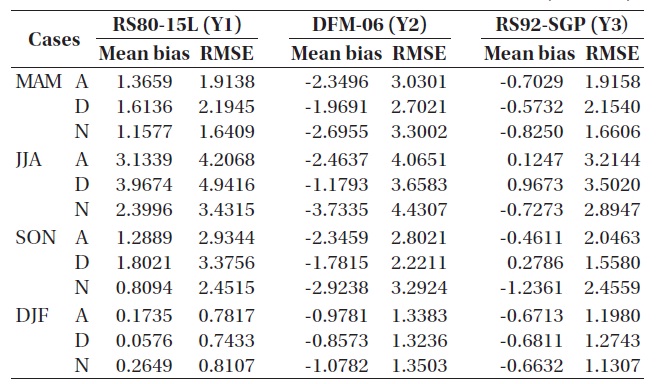
Mean biases and RMSEs of GPS and radiosonde PWV (unit: mm).
should be noted that there is a dry bias even in nighttime in the case of RS80-15L. Ferrare et al. (1995) showed that a RS80 radiosonde had a dry bias regardless of temperature or relative humidity.
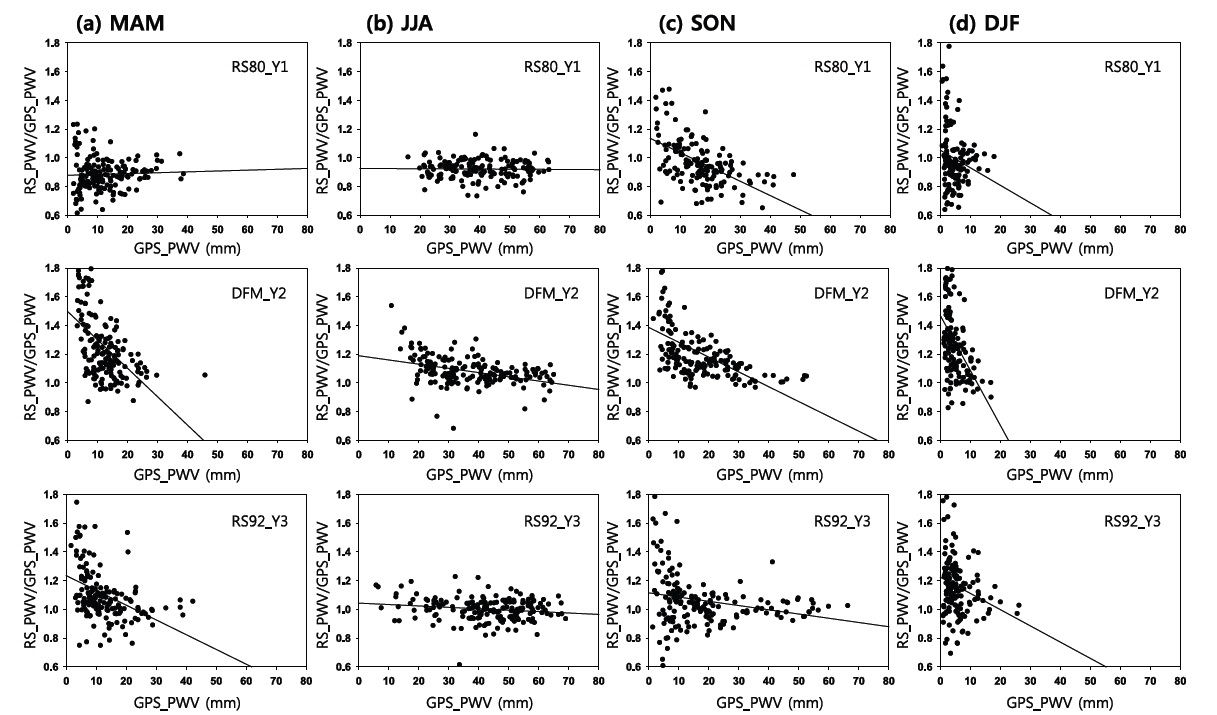
Fig. 6 presents the comparison results between the radiosonde PWV and the GPS PWV for an investigation of the seasonal dependence of the radiosonde PWV. Each panel of the figure shows how the ratios of the radiosonde PWV to the GPS PWV for different radiosonde sensors in different seasons change with the GPS PWV, where outlier data, with the radiosonde PWV less than a half of or greater than two times of the GPS PWV, are not included in the analysis.
In Fig. 6, except in the spring of 2006, the estimation of the radiosonde PWV compared to the GPS PWV is found to change from over-estimation to under-estimation with increasing GPS PWV (Kim et al. 2009), which is also confirmed by comparing the slopes of regression lines in Table 3.
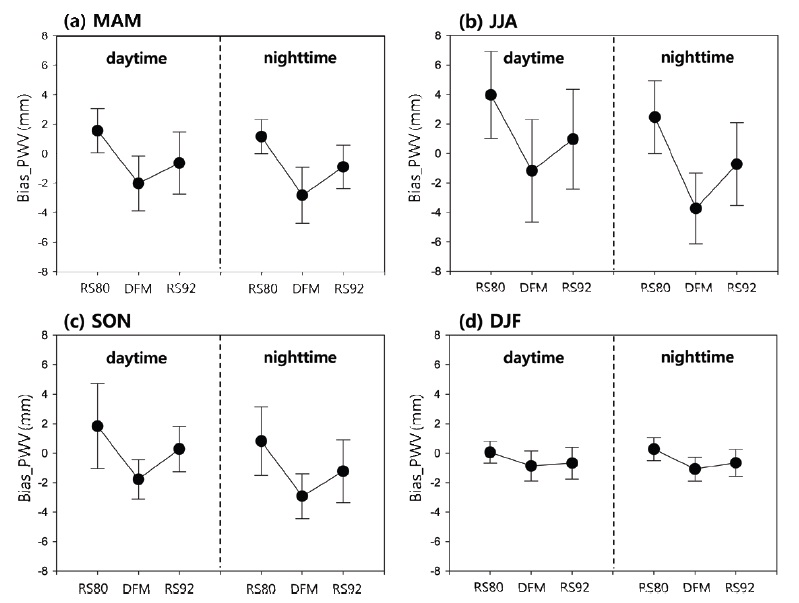
Fig. 7 shows mean and standard deviation of the PWV differences between GPS and radiosonde in different seasons and in daytime and nighttime. The degree of scattering is found to be higher in summer, when the PWV variation is relatively large, compared to other seasons. Only in summer, the variation of the PWV differences at different observing times but in the same season is larger in daytime than in nighttime, while the tendency is not obvious in other seasons.
The mean bias and RMSE of the radiosonde PWV compared to the GPS PWV are calculated as in Table 4 to analyze the bias and error characteristics of the radiosonde PWV. Also here, as in Fig. 6, the outlier data, of which the radiosonde PWV is less than a half of or greater than two times of the GPS PWV, are not included in the analysis. In the case of the RS80-15L sensor in 2006, the dry bias in daytime is larger than in nighttime and RMSE is also larger in daytime, as known from the previous studies. However, the opposite tendency is found in the winter of 2006, which is considered owing to the fact that the responding time of the humidity sensor on the radiosonde increases at lower temperatures (Hudson et al. 2004, Miloshevich et al. 2004, 2006). A wet bias and error in nighttime is found in 2008 when the DFM-06 sensor was used. The comparisons in the cases of summer demonstrates that the RS92-SGP sensor has the highest precision of PWV measurement in summer by showing the lowest mean bias and RMSE all day long both in daytime and nighttime. A long-term study of comparison with a larger set of data is required for more objective results.
We analyzed the radiosonde bias of each sensor type in different seasons and in the cases of daytime and nighttime by comparing the radiosonde PWV, observed at the Sokcho Regional Meteorological Office in each year of 2006, 2008, and 2010, with the GPS PWV at the Sokcho station provided by KASI. Through this comparison, the characteristics of the radiosonde data of each sensor type were examined in different cases of seasons and daytime or nighttime.
The two observations are consistent with each other in general in a time-sequential representation showing the seasonal variation of PWV, where some sudden variations are considered to be the PWV increase or decrease in the atmosphere relative to precipitation phenomena. The difference of PWV between the two instruments depending on the observing time in daytime or nighttime shows that a dry bias is found in the daytime observations of radiosonde as known in the previous studies and the correlation between the radiosonde PWV and the GPS PWV is higher in nighttime than in daytime.
We compared the radiosonde PWV with the GPS-estimated PWV to study the seasonal dependence of the difference in radiosonde PWV in daytime or nighttime. It is found that the estimation of the radiosonde PWV compared to the GPS PWV changes in general from over-estimation to under-estimation with increasing GPS PWV. The mean bias and RMSE of the radiosonde PWV were calculated with the GPS PWV as a reference to analyze the bias and error characteristics of the radiosonde PWV. In 2006, except in winter, the dry bias in daytime is larger than in nighttime and RMSE is also larger in daytime, while in 2008 the wet bias and error are found in nighttime. In the comparisons for each summer, the RS92-SGP sensor, which was used in 2010, is found to have the highest precision of PWV measurement in summer by showing the lowest mean bias and RMSE all day long both in daytime and nighttime.
The analysis of bias and error for each type of radiosonde sensor in different cases of seasons and daytime or nighttime can provide a guidance for using data of those radiosondes. A comparison using data from yearly observations over a long term is required for more general discussions since the analysis in this study was over a short period and thus might be influenced by a climatic variation. It is expected that the comparison analysis between the GPS and radiosonde PWVs in this study can contribute to improving the precision of humidity sensors of radiosondes and the capability of water vapor observation. GPS observations, which costs relatively less for operation and can obtain data with high temporal and spatial resolutions more easily than radiosonde, should be also able to help to improve the accuracy of numerical forecasting.