Multi-purpose infrared imaging system (MIRIS) is the main payload of the Korea Science and Technology Satellite-3 (STSAT-3). MIRIS is being developed by Korea Astronomy and Space Science Institute (KASI), and will be launched at the end of 2012. MIRIS will perform multi-purpose observation with two infrared (IR) cameras: the space observation camera (SOC) and the earth observation camera (EOC). The EOC will observe the Earth (particularly the Korean peninsula) to monitor forest fires, volcanoes, and the vegetation index (Lee et al. 2011). The SOC, on the other hand, will survey the Galactic plane to study the origin of the warm ionized medium through emission line survey and measure the absolute cosmic infrared background level through imaging in I and H bands, with a wide field of view (3.67 × 3.67 degree) in the wavelength range from 0.9 to 2μm (Han et al. 2010).
Eliminating thermal background radiation is vitally important for the MIRIS, as thermal radiations can affect the IR detector and increase image noise. To reduce this thermal noise, both passive and active cooling techniques were used. Passive cooling is a cooling process that consumes no electric power, and through this process a telescope can be naturally cooled through radiative heat exchange with the space environment. Active cooling, on the other hand, is a cooling technique using cooling devices such as mechanical coolers or refrigerants. These cooling devices ‘actively’ cool the telescope or the detector module. Implementations of passive or active cooling can be seen in previous and planned IR missions: Infrared Astronomical Satellite (IRAS) (Neugebauer et al. 1984), Infrared Space Observatory (ISO) (Kessler et al. 1996), Spitzer Space Telescope (Lawrence & Finley 2004, Finley & Schweickart 2005), AKARI (ASTRO-F) (Murakami et al. 2007), Herschel Space Observatory (Pilbratt et al. 2010) and Space Infrared Telescope for Cosmology and Astrophysics (SPICA) (Sugita et al. 2008). As part of the overall cooling process, passive cooling can determine the success or failure of the mission, because it is able to conserve the electric power of the satellite and the liquid helium carried from the ground. It is, therefore, very important to check passive cooling before launching a rocket. Optimized thermal designs were applied to the SOC for effective passive cooling, and a thermal analysis and passive cooling tests with the flight model (FM) were conducted so that final modifications could be applied. Thus, this paper describes the process and the results of the thermal analysis for the verification of passive cooling. The thermal design of the SOC is shown in Section 2. Section 3 is focused on the model and the results of the thermal analysis. In order to compare the results with those of the thermal analysis, the procedure and the results of the passive cooling test are added in Section 4. In the final Section, a summary is provided.
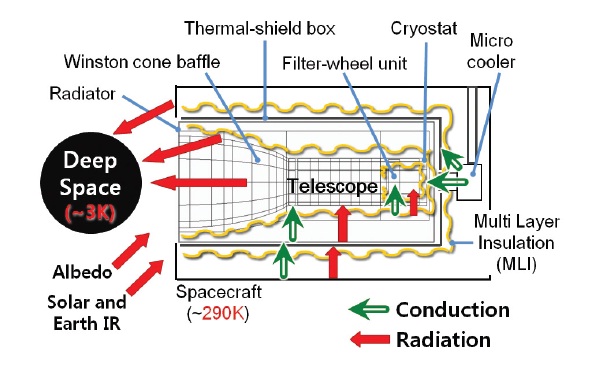
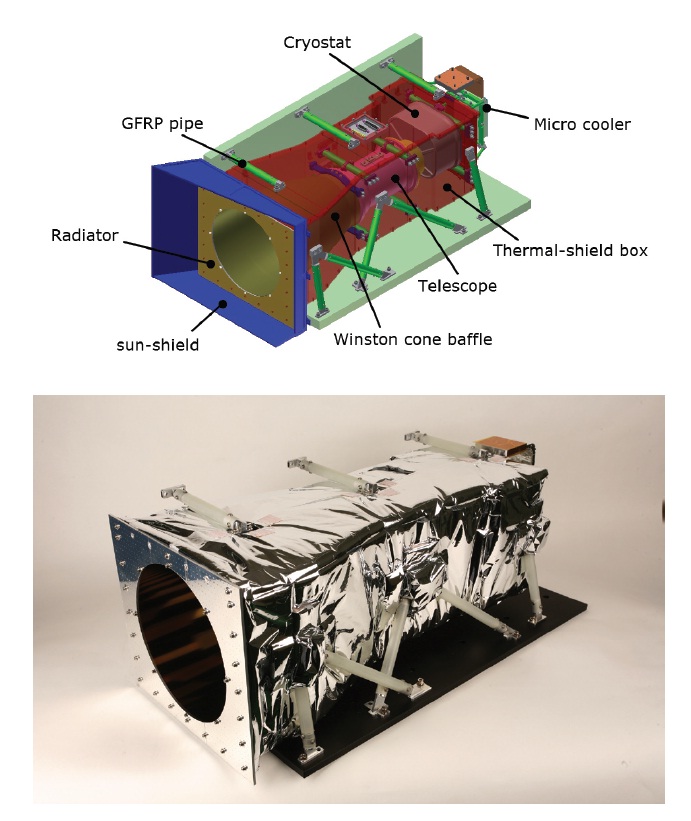
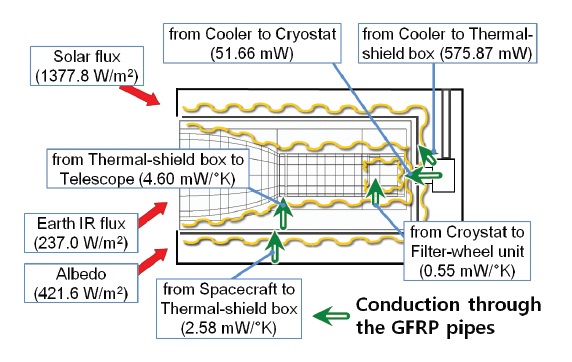
To perform the mission, the temperature of the telescope needs to be reduced to below 220°K. However, for optical performance, the telescope should be cooled to below 200°K. Fig. 1 is a heat transfer diagram of the SOC. The arrows in the figure indicate heat transfer by conduction and radiation. In consideration of the overall heat transfer, the SOC was designed for successful passive cooling, as shown in this figure. More details about the thermal designs are provided in the following.
The sun-shield and the Winston cone baffle were adopted to obstruct any incoming earth and solar radiation. In the FM of the SOC, one of the sun-shield panels was enlarged so that it could effectively block the stray light that may be
reflected from the surfaces of the antenna structures on the outside wall of the satellite. As a result, the shape of this panel was changed from a quadrangle into a right trapezoid (bottom panel of the sun-shield in Fig. 2). A Winston cone is a light-collection device (Winston 1970), but it can also be used as a baffle that blocks incident rays coming from out of the cone angle. The Winston cone baffle of the SOC, of which the cone angle is 30˚, reflects incoming heat radiations and protects the optical system. The Winston cone baffle was accurately machined and coated with nickel and gold to have a surface reflectivity of 89% (Moon et al. 2010). With its high reflectivity and the precise off-axis parabolic shape of the baffle, it will effectively reflect the IR radiations from the earth and unwanted sources.
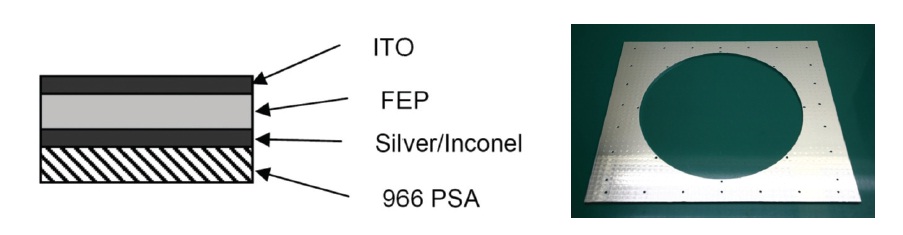
The radiative cooling method with the radiator and the optical system of the SOC was used. In the end, the radiator radiates away heat loads transferred from most parts of the SOC, and therefore, the emissivity of the outer surface of the radiator influences the cooling performance of the SOC. Originally, aluminum-deposited fluorinated ethylene propylene (FEP), with emissivity of 0.7, was attached to the radiator of the engineering qualification model (EQM). However, a silver-deposited FEP film was utilized in the
FM for better cooling performance. Furthermore, this film was coated with indium-tin-oxide (ITO) as shown in Fig. 3. ITO discharges static electricity on the surface of the FEP film and increases its emissivity. This silver-deposited FEP film, which has higher emissivity (~0.85) than EQM, was used. Then, the inside of the radiator was put into contact with the Winston cone baffle and the thermal-shield box. In this way, the heat conducted from the Winston cone baffle and the thermal-shield box could be radiated toward the cool vacuum of space. The radiative cooling effort was also applied to the optical system. With 5 lenses, we designed a wide-field optical system that has a clear aperture of 80 mm. The attitude of the MIRIS in orbit could be controlled so that the SOC optical system would point toward deep space. As the optical system points toward space, heat radiation from the inner surfaces of the optical system and the telescope is naturally released through the lenses directly into cold space (~3°K).
Using the thermal-shield box and glass fiber reinforced polymer (GFRP) supports significantly decreases heat transfer from the satellite body to the SOC. The thermal-shield box blocks thermal radiation that comes from the satellite body walls to the SOC components. Moreover, 30 layers of multi layer insulation (MLI) wrapped around the outer wall of the thermal-shield box (Fig. 2) increase the efficiency. Not only is the thermal-shield box covered with the MLI, but the outer surfaces of the Winston cone baffle, the telescope, the cryostat, and even the filter-wheel unit (10 layers of MLI) in the cryostat are also covered in this way. As a result, the IR detector in the filter-wheel unit is protected from thermal radiations by three layers of the MLI. The GFRP pipes, made of G10 material with low conductivity, prohibit heat transfer by conduction. These pipes, consequently, minimize heat conduction from hotter parts to colder parts: from the wall of the satellite to the thermal-shield box, from the thermal-shield box to the telescope and the cryostat, and from the micro Stirling cooler to the thermal-shield box and the cryostat. The shape of the GFRP pipes was designed in consideration of both structural stability and insulation efficiency. All the shock and vibration tests (~10 G rms) for
the MIRIS that were conducted passed the requirements. More details regarding the procedure and results of the vibration tests are described in Moon et al. (2010).
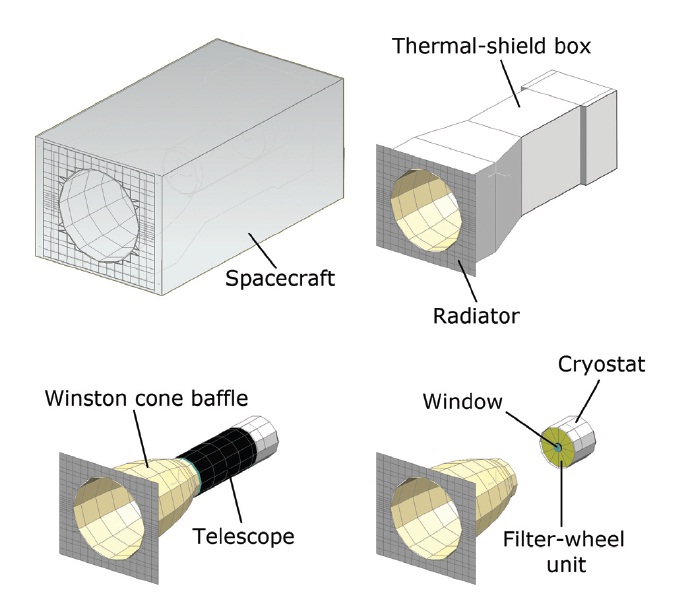
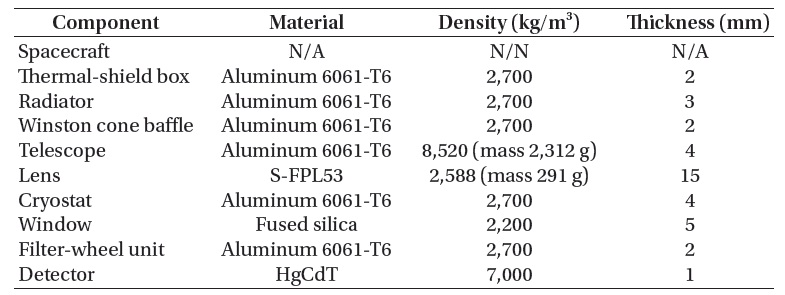
We used NX 7.0 TMG (Siemens PLM Software, Germany), with a specialized solver of ‘Space Systems Thermal’ for the analysis. A mesh was placed on the surface of the SOC model as shown in Fig. 4. Next, a 2-D thin shell mesh method appropriate for plate structures was used, as most components of the SOC are planar and cylindrical in shape. Material properties and thermo-optical properties applied to the simulation program are given in Tables 1 and 2. Thickness, as well as properties of matter and density, was input for the computation of the 2-D thin shell mesh (Table 1). Some of the SOC components were designed to
[Table 1.] Material properties of MIRIS SOC.

Material properties of MIRIS SOC.
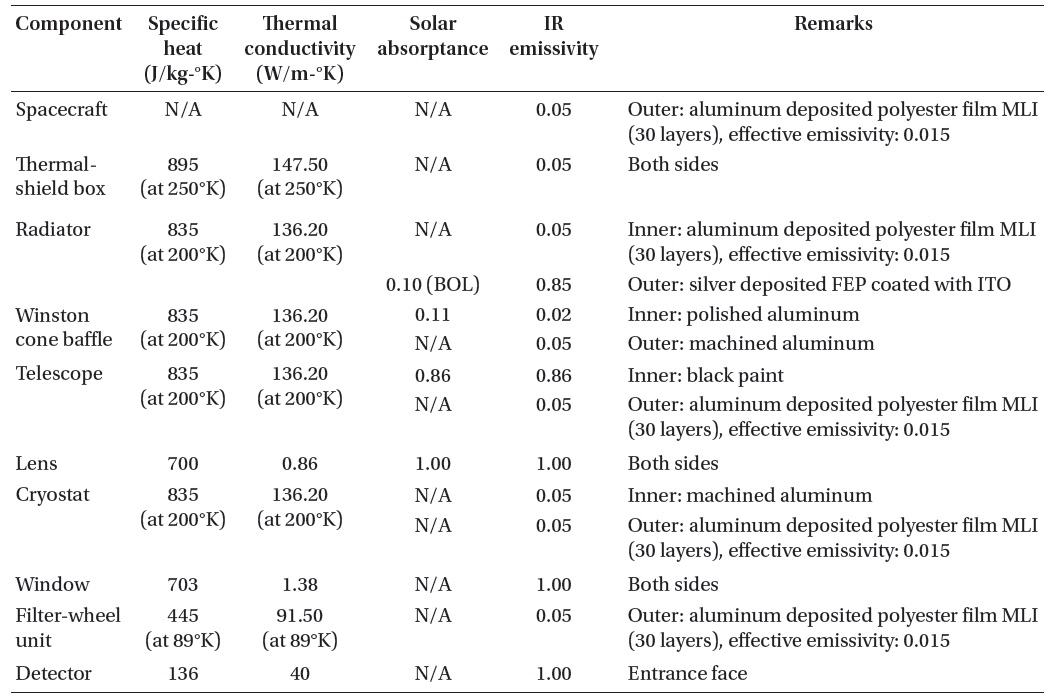
[Table 2.] Thermal and optical properties of MIRIS SOC.

Thermal and optical properties of MIRIS SOC.
have unique thermo-optical properties according to their purpose. For example, the outer side of the radiator was covered with silver-deposited FEP and the inner side of the telescope had a coat of black paint applied so that they would have high emissivity, which would consequently radiate away heat to deep space (see remarks in Table 2). According to the on-orbit thermal analysis results of the structural thermal model in the STSAT-3 critical design review report (Korea Aerospace Research Institute 2009), the temperature of the spacecraft fluctuates slightly around 20℃ in the worst case. To decrease the number of simulation cases and simplify the analysis, the temperature of the spacecraft was fixed (~290°K). For more realistic results, some of the thermal properties were used at certain operating temperatures (Table 2). Surfaces covered with MLI layers and closely in contact with other surfaces have little chance to absorb solar radiation. For these surfaces, N/A (not applicable) was applied.
To compute conduction heat transfer through the GFRP pipes, generated heat load and total conductance were used. These values are defined by Eqs. (1) and (2) respectively (Gilmore 2002)
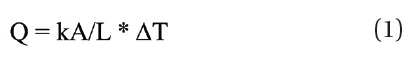
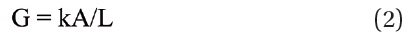
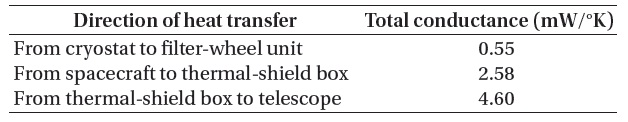
where Q is the heat load (W), G is the total conductance (W/°K), k is thermal conductivity (W/m-°K), A is the cross-sectional area of the GFRP pipes (m2), L is the length of the pipes (m), and ΔT is the temperature difference between the two model components (°K). Through the GFRP pipes of the SOC, conductive heat is transferred from one component to the other as shown in Fig. 5. This conductive heat is calculated using Eqs. (1) and (2), and the results are given in Tables 3 and 4. Table 3 is the generated heat load from the cooler to the rear side panel of the thermal-shield box and to the cryostat. Table 4 is the total conductance between
[Table 3.] Generated heat load.
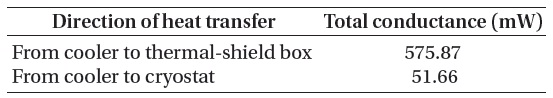
Generated heat load.

Total conductance.
[Table 5.] Orbital condition of MIRIS.
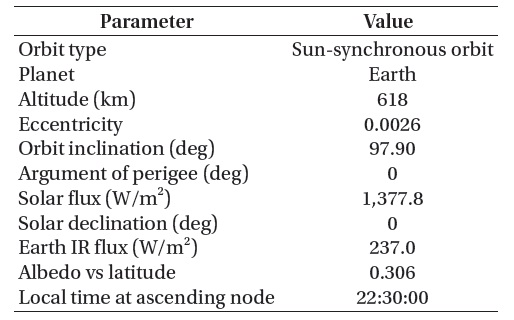
Orbital condition of MIRIS.
model components supported by the GFRP pipes.
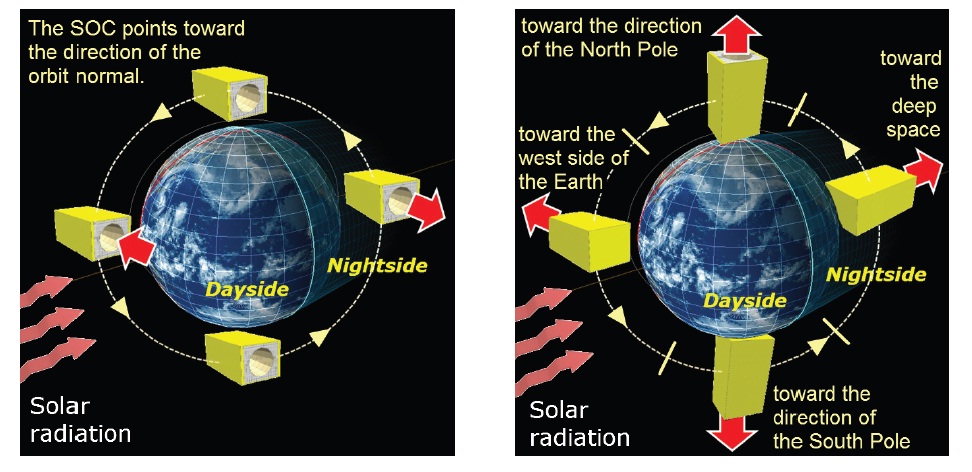
As shown in Table 5, specific orbital conditions were set. The solar flux at a solar declination of zero degrees, assuming spring or autumn equinoxes, and the fixed Earth IR are listed in the table. Thermal analysis was conducted for two cases of the satellite attitude: worst hot case and normal case (Fig. 6). For the worst hot case, the SOC points toward the surface of the Earth during the day and is directly open to the Earth IR and albedo. For the normal case, however, the SOC points in the direction of deep space and avoids heat radiations from the Sun and the Earth. Note that the worst hot case will not be used in the actual operation of the MIRIS, but was used only for comparison with the normal case.
3.2 Results of Thermal Analysis
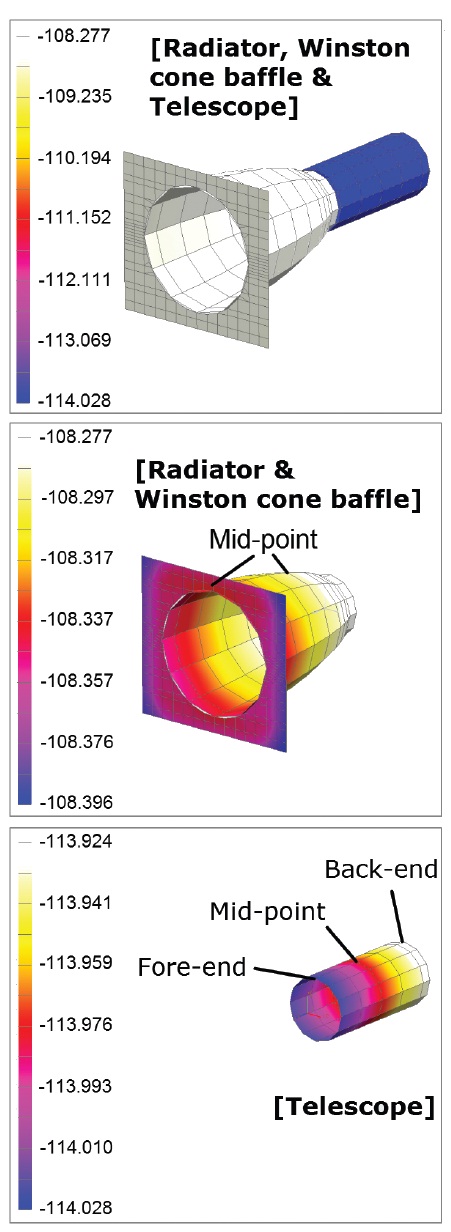
The thermal analysis for MIRIS SOC was conducted, and results were derived for the worst hot case and the normal case of the satellite’s attitude. Passive cooling temperatures
forthe three components of the SOC (radiator, Winston cone baffle and telescope), in the normal attitude case, are shown in Fig. 7. This result is obtained when the SOC’s temperature difference between two continuous orbits is less than 0.1°K. We defined this moment as steady state. Temperature and elapsed cooling time at steady state for several cases are listed in Tables 6 and 7, respectively. All temperatures of the telescope in Table 6 are less than 220°K, the upper limit below which the MIRIS can still fulfill its mission: less than 206°K for worst hot case and less than 170°K for normal case. From this, it seems likely that MIRIS will be mission capable even in the worst hot case. For
[Table 6.] Temperature of MIRIS SOC components at steady state for various conditions.
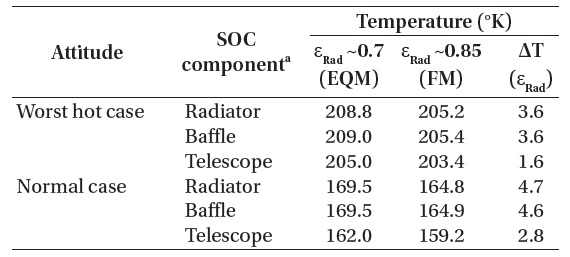
Temperature of MIRIS SOC components at steady state for various conditions.
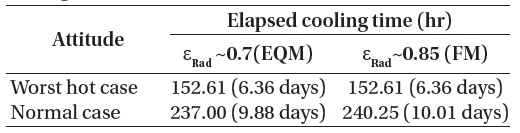
[Table 7.] Elapsed time until steady state during passive cooling for various conditions.

Elapsed time until steady state during passive cooling for various conditions.
comparison, results derived from the application of the emissivity (~0.7) of the EQM were added in Table 6. The temperature derived from the FM’s radiator shows as being lower than that applied EQM’s radiator, and the decrement (ΔT (εRad) in Table 6) ranges from 1.6 to 4.7°K. For all cases of the attitude, the decrement of the radiator was shown to be bigger than that of the telescope because the radiator was directly influenced by its emissivity.
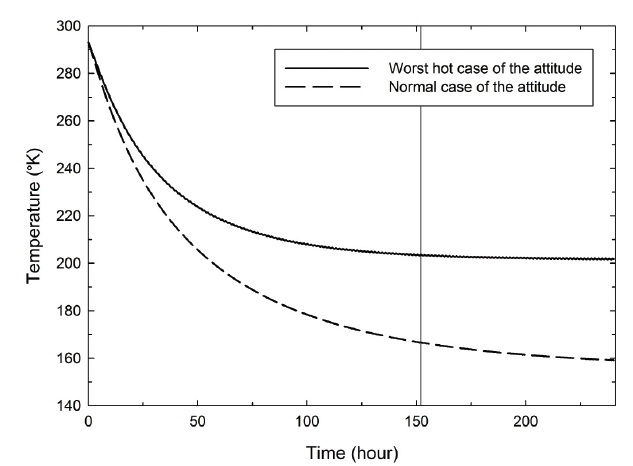
Fig. 8 illustrates temperatures of the telescope for 2 cases
of the attitude that have applied the FM radiator’s emissivity. These results were obtained until the temperature reached the steady state of the normal case. The vertical line in the figure indicates time elapsed until the temperature reached steady state during passive cooling for the worst hot case. From Fig. 8, it seems likely that the telescope can be cooled to 200°K within 2.4 days for the normal case. In a real operation, the elapsed cooling time can be slightly extended, because the Earth IR radiation can be entered through the SOC lenses during contact time with the ground station for communication. Nevertheless, this is quite short compared with the time elapsed until the steady state (Table 7), and may be valuable for time efficiency. However, to observe with a cooled SOC in a state of stability, it is necessary to wait until steady state (~240 hours for the normal case and for the FM radiator’s emissivity). Fig. 8 also shows that temperatures of the normal case are significantly lower than in the worst hot case. This means the attitude of normal case provides a significant advantage in passive cooling. The line orbit of the MIRIS at the dayside is slightly inclined toward the west (Fig. 6). Because of the inclination, the telescope of the worst hot case has more of a chance to be exposed to the solar and the Earth radiations. Therefore, the temperature of the telescope for the worst hot case becomes much higher.
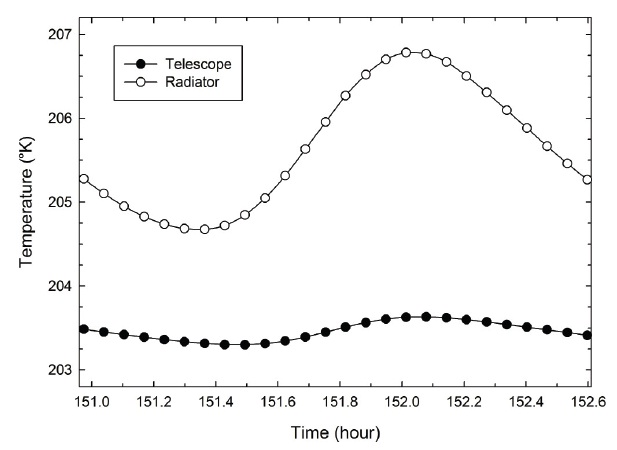
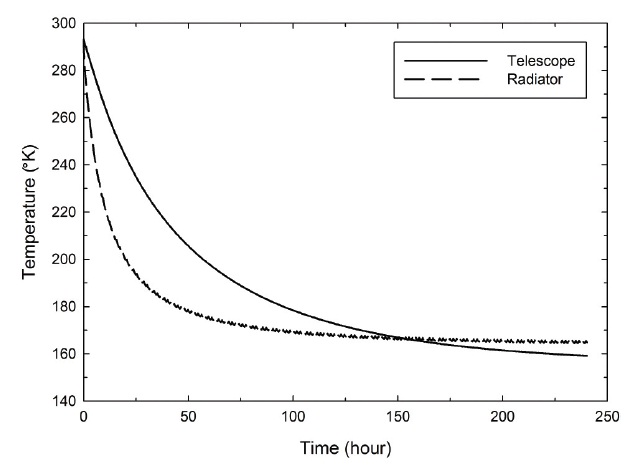
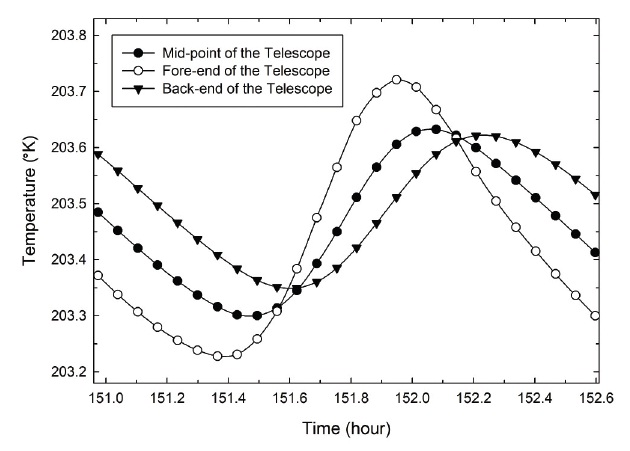
Fig. 9 shows temperatures of two components: mid-point of the telescope and of the radiator for the normal case and for the case of the FM radiator. In the beginning, the temperature of the radiator drops dramatically. It is thought that this is likely to be due to the thermal design: the outer surface of the radiator is designed to have high emissivity. However, as time goes on, the dropping rate begins to become slower than that of the telescope, and the temperature of the radiator becomes even higher than the telescope after 150 hours. This inversion occurs because the radiator is one of the outermost parts of the SOC and is continuously affected by larger amounts of solar and Earth radiations than the telescope is. Fig. 10 shows the temperature of the mid-point of the telescope and of the radiator at steady state, for the attitude of the worst hot case, applying the FM radiator. Temperatures of the two components fluctuate because the MIRIS experiences night and day in orbit. The temperature fluctuation of the telescope (~0.3°K), which is the temperature difference between the maximum and minimum values, is smaller than that of the radiator (~2.1°K) because the radiator directly receives thermal radiation during the daytime. Temperature of the telescope continue to decrease slightly at steady state, but the decrement is quite small (< 0.1°K per 1 orbit) and can be considered negligible. Fig. 11 presents temperatures of 3 points of the telescope at the steady state for the worst hot case and the radiator’s emissivity of 0.85. As shown in the figure, the fluctuation in temperature changes according to the position of the telescope: the fluctuation at the fore-end of the telescope is larger than that of the back-end. This positional variation arises because the back end of the telescope has less chance of being exposed to incoming thermal radiation. Since the positional variation in temperature is small (~0.2°K), the effect of the positional temperature variation on the optical system would be small at the steady state.
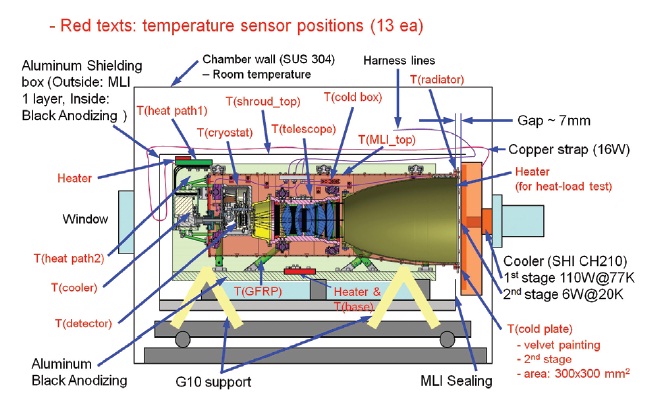
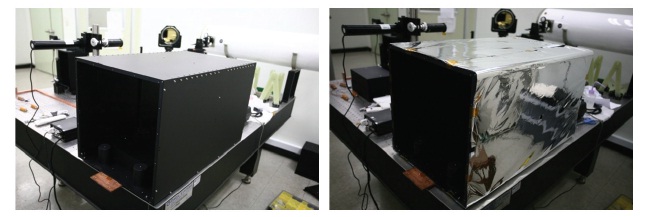
After the integration of MIRIS FM, the passive cooling test was conducted in a vacuum chamber in order to compare the test results with the results of the thermal analysis. As shown in Fig. 12, MIRIS FM passive cooling configuration was prepared. 13 temperature sensors, including DT-670 Silicon Diodes (CU package type), were used for temperature monitoring. We adopted GM Cryocooler and velvet-painted cold plate (copper) in order to simulate deep space at 3°K. The GM Cryocooler has two cooling stages: the 1st stage (110 W at 77°K) and the 2nd stage (6 W at 20°K) that is a cold tip (Fig. 12). A box-shaped copper plate was put on the 1st
stage and the velvet-painted cold plate, made of copper, was put on the 2nd stage. This velvet-painted cold plate has high emissivity (> 0.9) and was placed close to the SOC radiator so that the heat radiation from the radiator could dissipate directly through the cold plate. Nevertheless, a physical gap (~7 mm) between the radiator and the cold plate remained due to interference. We designed the shroud, an aluminum shielding box (flat black anodizing), to simulate the walls of the satellite. We also put a heater (100 W) on the base-plate of the shroud. This maintains the temperature of the shroud at room temperature (~290°K), the same as that of the inner walls of STSAT-3. To block radiation from the inner walls of the chamber to the SOC and increase the efficiency of the cooling system, we covered the shroud with one layer of the MLI (Fig. 13).
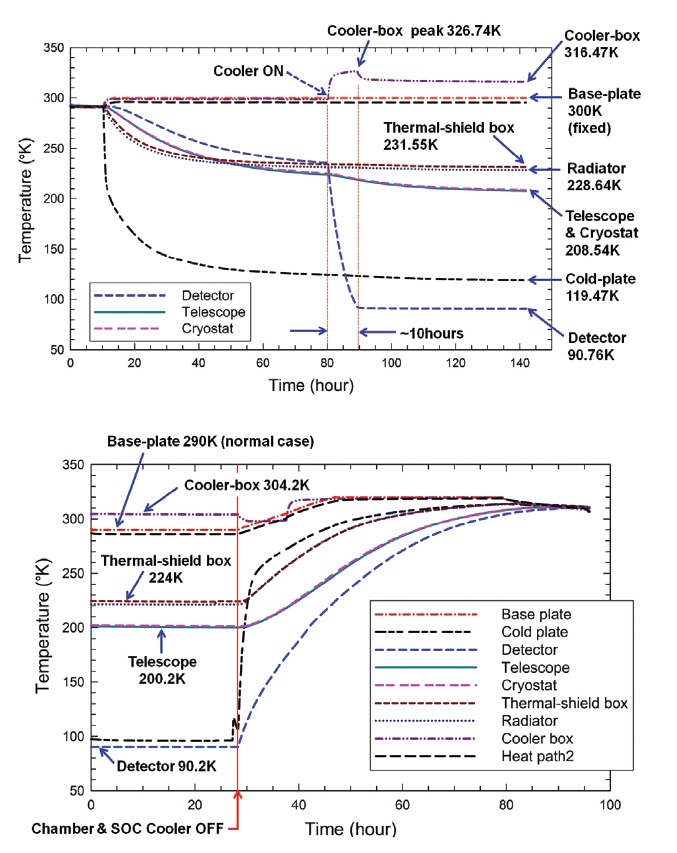
Fig. 14 shows the results of the FM passive cooling test. Although the test setup was not exactly the same as the simulation because the base-plate was not 290°K (but 300°K), the telescope was cooled to below ~208.5°K in ~130 hours. After changing the temperature of the base-plate to 290°K, the temperature of the telescope was successfully decreased to 200.2°K through passive cooling, and the detector was cooled to 90.2°K by the micro Stirling cooler.
The aim of the present study was to determine whether the telescope of the SOC FM could be cooled to 200°K through passive cooling. As shown in Fig. 8 and Table 7, it seems that the FM telescope can be cooled down to about 200°K within one week, even assuming the attitude of the worst hot case. For the case of normal attitude and the case using the FM radiator, which is the most realistic condition, the telescope reaches steady state after 10 days where the temperature is about 160°K. The result of the passive cooling test indicates that the telescope can be cooled down to 200.2°K. This value is quite similar to the result of this thermal analysis for the worst hot case of FM (Table 6). This shows that the test result is similar to the analysis result. However, there is a temperature difference of ~40°K between the test result and the analysis result for the normal case. It seems likely that this difference is due to the physical gap (~7 mm) between the radiator and the cold plate of the vacuum chamber. Thermal radiation from the inner walls of the chamber may seep through the gap and play the same role as the solar and the Earth radiations in the worst hot case. Therefore, it is expected to have better cooling performance in a passive cooling test if a better configuration is built in the future.
In summary, we have verified passive cooling for the MIRIS SOC. It is believed that the FM of the SOC telescope can be successfully cooled down to below 200°K through passive cooling, and therefore, the detector can also be cooled to 89°K by the cooler.