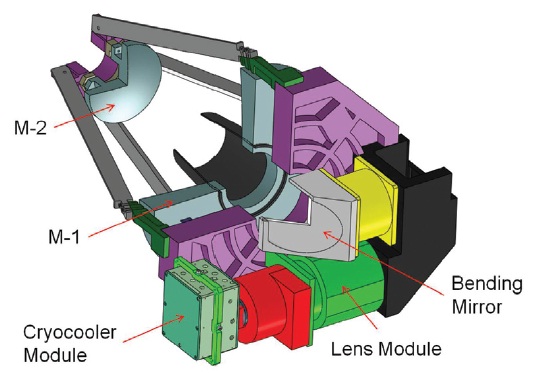
Recently, there is a demand for a 30 cm cryogenic space infrared telescope for space astronomy missions. Therefore, we have designed and analyzed a 30 cm cryogenic space infrared telescope in this paper. For the better noise performance, the telescope will be cooled down to 77 K to observe the space in the wavelength range of 0.5~2.1 um. The telescope consists of a 30 cm primary mirror (M-1), a secondary mirror (M-2), and the relay lens system.
Fig. 1 shows the conceptual design of a 30 cm cryogenic space infrared telescope. Since the performance of a mirror depends on the deformation of a mirror surface, even if a mirror with high surface accuracy is fabricated, if a support of the mirror goes wrong, its quality cannot be guaranteed. Therefore, when designing support structures or polishing mirrors, it is crucial that the optical performance analysis of the mirror.
Since the performance of a mirror depends on the
deformation of a mirror surface, even if a mirror with high surface accuracy is fabricated, if a support of the mirror goes wrong, its quality cannot be guaranteed. Therefore, when designing support structures or polishing mirrors, it is crucial that the optical performance analysis of the mirror (Yoder 1993, Heo & Kwak 2008, Cho et al. 2009, Lin et al.
[Table 1.] Design requirements of mirrors of 30 cm cryogenic space infrared telescope.
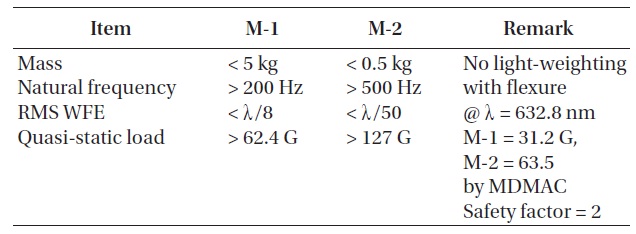
Design requirements of mirrors of 30 cm cryogenic space infrared telescope.
2010) is preceded. This paper focuses on calculating optical deformation map and root mean square (RMS) wavefront error (WFE) from the raw displacement of a mirror surface of a 30 cm cryogenic space infrared telescope in external loads.
As a Cassegrain prescription, the optical system of a 30 cm cryogenic space infrared telescope has a focal ratio of f/3.1. The material of optical structures and mirrors is all aluminum alloy (Al6061-T6), and the cosmic infrared background radiation is observed when the optical system and structures are cooled until 77 K. Performance requirements of mirrors and support structures are shown in Table 1. Actual WFE measurement of the mirror will be conducted in Japan. A M-1 will be measured optically using computer generated holograms, and sag of a M-2 will be measured in a mechanical method. WFE requirement of a M-1 is calculated fiducially from RMS measurement goal λ/4 in a wavelength of 632.8 nm of the helium-neon (He-Ne) gas laser. The observed wavelength range of a 30 cm cryogenic space infrared telescope is 0.5~2.1 μm, which includes visible light. Mainly observed wavelength is infrared, and it is planned to get a general image of visible light. Quasi-static load by random vibration from a rocket was calculated based on modal mass acceleration curve (MDMAC) (Trubert
1989). Software used in design and analysis is SolidWorks Simulation and Matlab, Fortran 90.
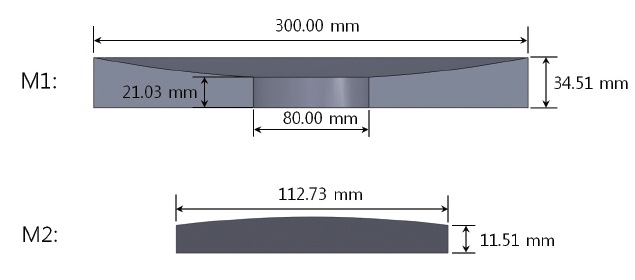
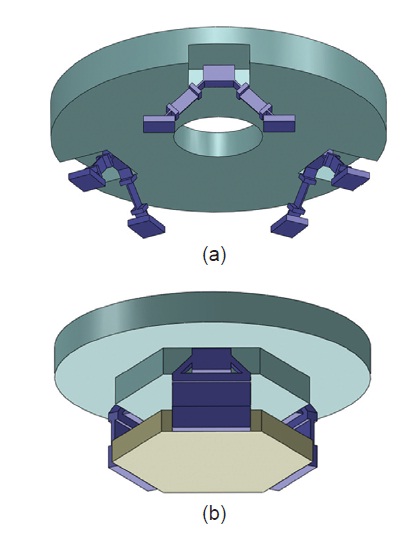
A M-1, which is a concave reflector, has a diameter of 300 mm and a mass of 4.8 kg, while a M-2, which is a convex reflector, has a diameter of 113 mm and a mass of 0.45 kg. Other dimensions are shown in Fig. 2. A M-1 and M-2 assy. are shown in Fig. 3 with flexures of three supporting method, to support a M-1 and M-2 of a 30 cm cryogenic space infrared telescope. What flexures do is, by supporting a mirror flexibly, minimizing the deformation of a mirror surface. It can be achieved if flexures are designed to make the deformation of a mirror occur in a high frequency, and a mirror assy. with flexures goes into a rigid body mode in low frequency at the natural frequency analysis. Since materials of a mirror and flexure are the same, the strength and stiffness of a flexure are determined by its structure configuration. Especially, the bipod thickness and angle of a flexure are the key factors. Properties of the materials used in the analysis are shown in Table 2.
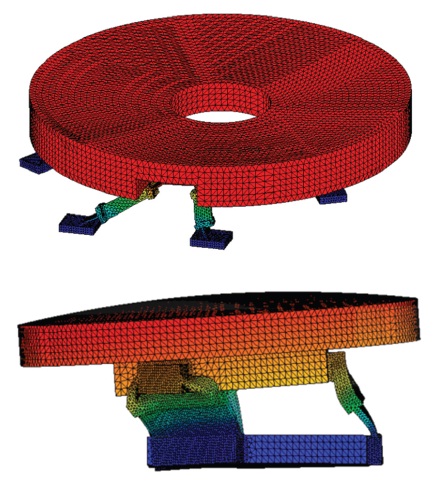
Natural frequency and mode shape are analyzed through finite element analysis (FEA). The 1st mode is found in 340 Hz for a M-1 assy., in boundary condition where the bottom of flexures are fixed, and in 1,023 Hz for a M-2 assy. Mode shapes are all rigid body motions as shown in Fig. 4.
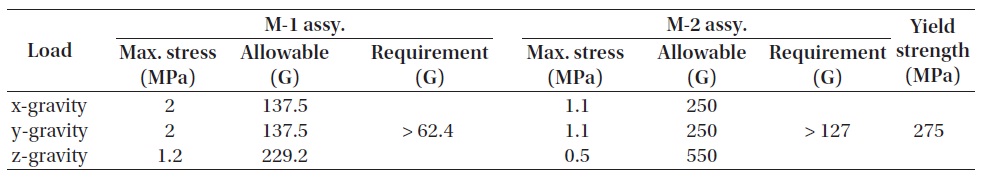
Quasi-static load was calculated from gravity analysis with boundary condition where the bottom of flexures is fixed. When using Cartesian coordinate system, optical axis is z axis, while transverse falls under the direction of x and y axis. Fig. 5 shows the stress distribution of a M-1 assy. for
[Table 2.] Material properties.
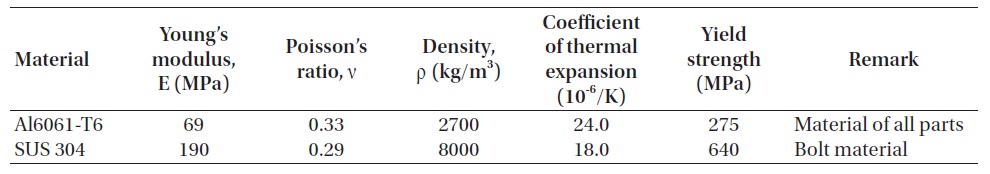
Material properties.
[Table 3.] Quasi-static load of a M-1 assy. and M-2 assy. for each gravity.

Quasi-static load of a M-1 assy. and M-2 assy. for each gravity.
z-direction of gravity, z-gravity, and the maximum stress was calculated to be 1.2 MPa. A M-1 assy. needs to withstand the acceleration of gravity 31.2 G × 2 = 62.4 G according to MDMAC and safety factor. The yield strength of aluminum is 275 MPa, which is calculated as that it can withstand 229.2 G. As a result of quasi-static load of a M-1 and M-2 assy. shown in Table 3, a M-1 and M-2 assy. meet the requirements.
4. PERFORMANCE ANALYSIS OF MIRRORS UNDER GRAVITY
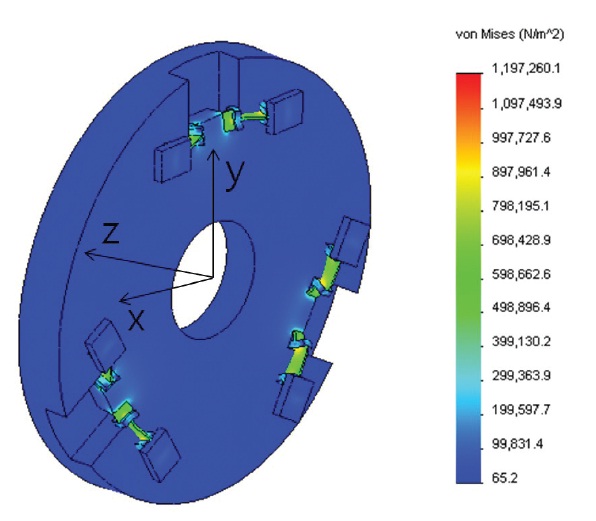
Performance of a mirror under gravity when a mirror is supported by a flexure support structure was analyzed. By performing FEA for each gravity direction, optical aberration can be analyzed by fitting it into Zerinke Polynomials (Noll 1976) after calculating the displacement normal to a
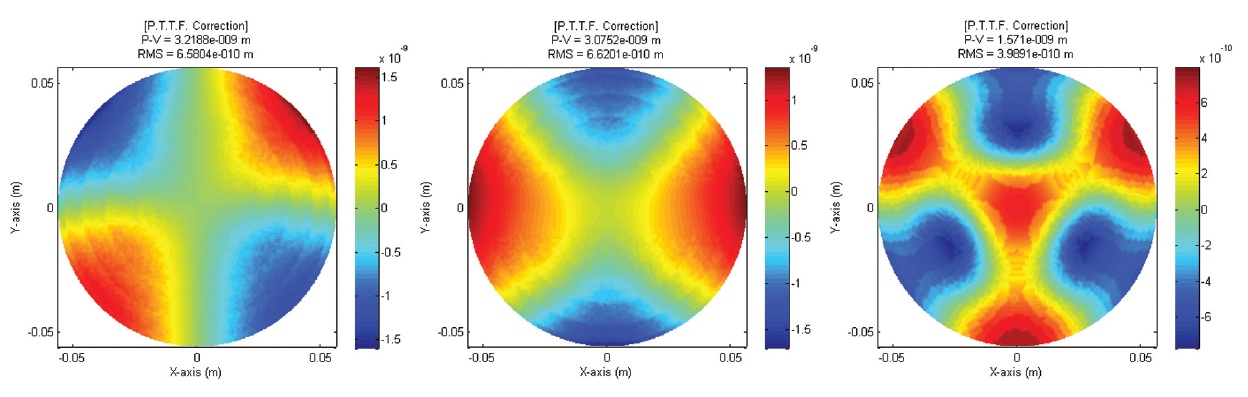
mirror surface from the raw displacement of each node of a mirror surface. Zernike Polynomials is generally used in performance analysis of a circular-shaped mirror because it is orthogonal on a unit circle, so that it can express mirror deformation as the sum of optical aberrations. Using 31 term Zernike Polynomials, optical deformation map of a M-1 surface for each gravity direction is shown in Fig. 6 as before and after correction of aberration of piston, tip-tilt, and defocus. It is confirmed that in the x, y- direction of gravity, tip-tilt aberrations are removed while defocus is removed in the z-direction of gravity. The deformation map of an aberration-corrected M-2 is shown in Fig. 7. RMS WFE is calculated by doubling the surface RMS of before and after the correction of aberration of a M-1 and M-2, and is shown in Table 4. A M-1 and M-2 meet the RMS WFE requirement for all gravity directions.
[Table 4.] RMS WFE of a M-1 and M-2 for each gravity.
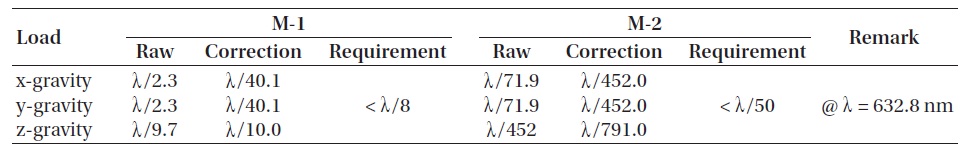
RMS WFE of a M-1 and M-2 for each gravity.
5. PERFORMANCE ANALYSIS OF PRIMARY MIRROR BY BOLT FASTENED
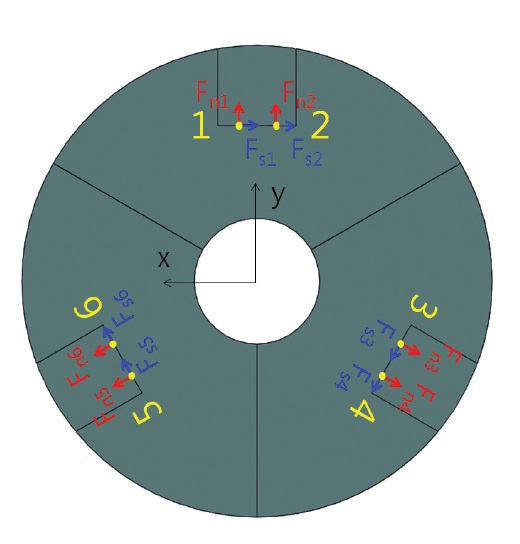
Because of the advantages of heat transfer and re-assembly when assembling a flexure support structure at a M-1, a bolt fastened method was considered. To decide the size of bolts to withstand random vibration, reaction force of quasi-static load for each direction in 62.4 G obtained from MDMAC and a safety factor was calculated in a boundary condition where 6 bolting points are fixed as shown in Fig. 8. Bolt pre-load is calculated as below
Pre-load = |Fn| + |Fs| / μ + |Fso| / μ
where Fn is normal force, Fs is a shear force on a xy surface, and Fso is a shear force in the direction of z-axis. μ is the coefficient of friction among fastened parts, and was known to be 0.34 for two aluminum alloy materials (6061-T6) (Mandelis et al. 2003). Bolt pre-load for the quasi-static load for each direction was calculated as in Table 5. Since
[Table 5.] Bolt pre-load calculated through finite element analysis.
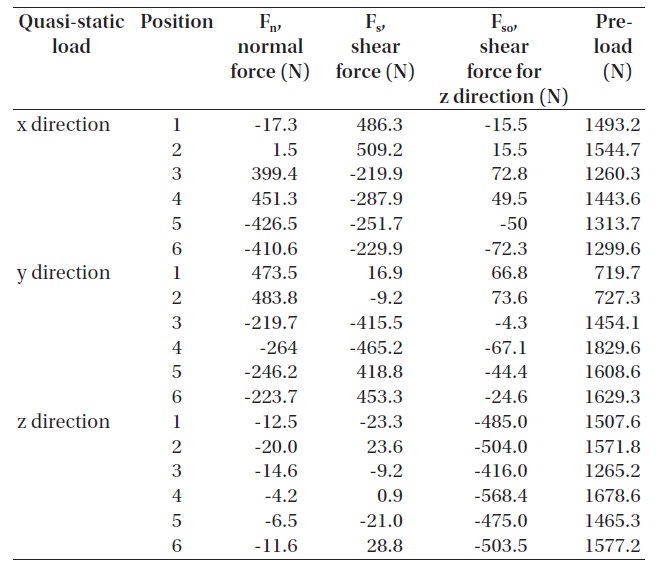
Bolt pre-load calculated through finite element analysis.
the maximum pre-load is 1,829.6 N, referring to technical information (Bossard 2012) provided by Bossard Group, a M3 bolt with the coefficient of friction of 0.14, a class 8.8 that can apply a huge preload of 2,436 N, which is a bigger preload than that actually calculated for margin design, was chosen.
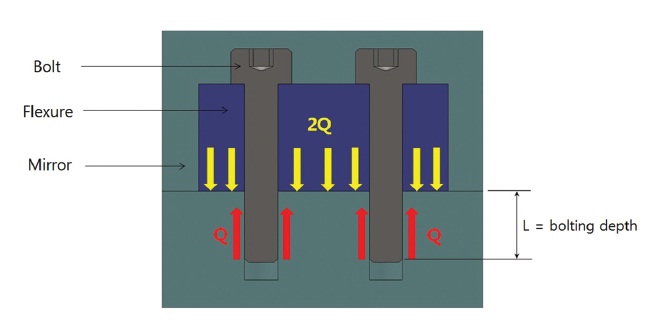
According to the technical information of Bossard Group, when 141 Ncm torque is applied to a class 8.8 M3 bolt, preload of 2,436 N is applied to a bolt hole. Deformation of a M-1 surface under this bolt preload was analyzed. Force diagram applied to a M-1 when torque is applied to 2 bolts was shown at Fig. 9. Q is preload, and L is bolting depth.
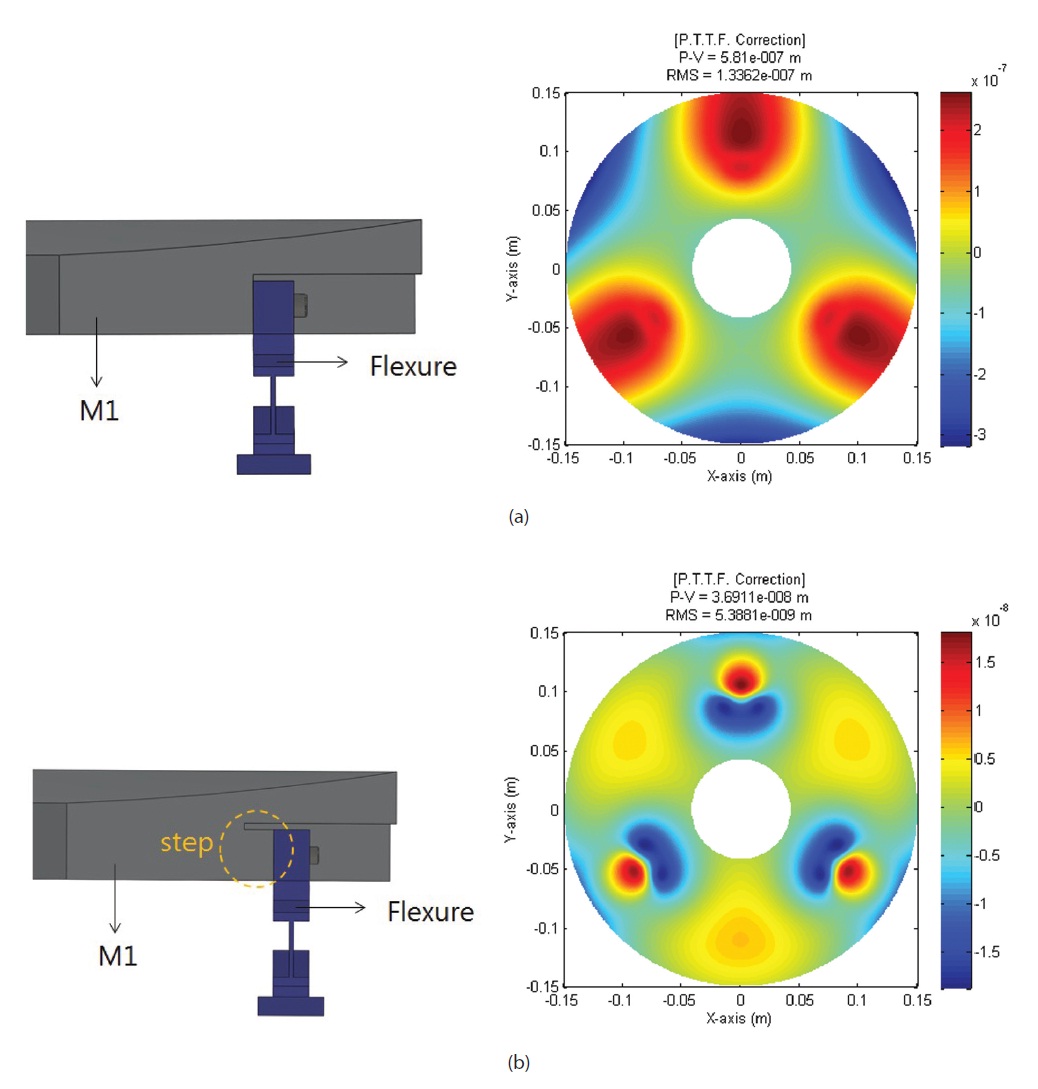
Bolting depth of a bolt being fastened to a M-1 is assumed to be 10 mm, and the result such as Fig. 10a was obtained by performing FEA in a kinematic boundary condition and a loading condition of force diagram. When flexures were assembled to a M-1 directly, a M-1 surface considerably deformed because of the torque and considerably exceeds the requirements. As a solution for this problem, by adding a step to a bolt fastened side as shown in Fig. 10b, deformation of a M-1 surface was innovatively decreased by cutting off the propagation path of stress to the mirror surface.
5.3 Effect of Thermal Stress When Cooled to 77 K
While the material of a M-1 is Al 6061-T6, since the material of a bolt is SUS 304, thermal stress occurs from a bolt hole due to the difference of coefficient of
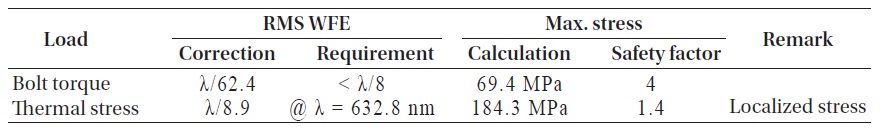
[Table 6.] RMS WFE and Max. stress of a M-1 for bolt torque and thermal stress.

RMS WFE and Max. stress of a M-1 for bolt torque and thermal stress.
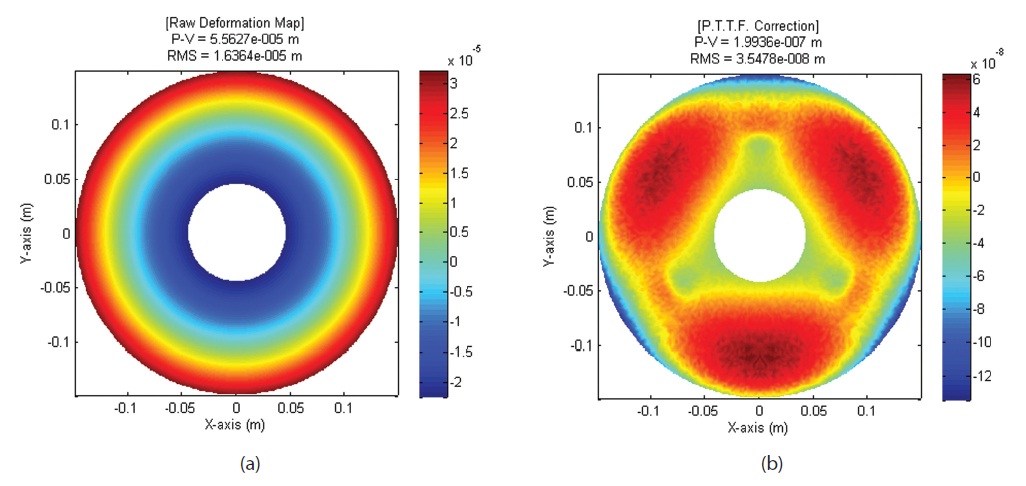
expansions of the bolt and a M-1 when the temperature cools to 77 K from room temperature 298 K. As a result of performing an analysis by applying ΔT = -221 K to a M-1 in a kinematic boundary condition, defocus aberration is shown dominantly as shown in Fig. 11a, which is because deformation dominantly occurs due to the difference of thickness according to the curvature of a M-1 surface when being cooled. The effect of thermal stress occurred from a bolt hole on a M-1 surface is confirmed on an optical deformation map in Fig. 11b, which corrected the defocus aberration. RMS WFE after defocus aberration correction is λ/8.9, which meets the requirement.
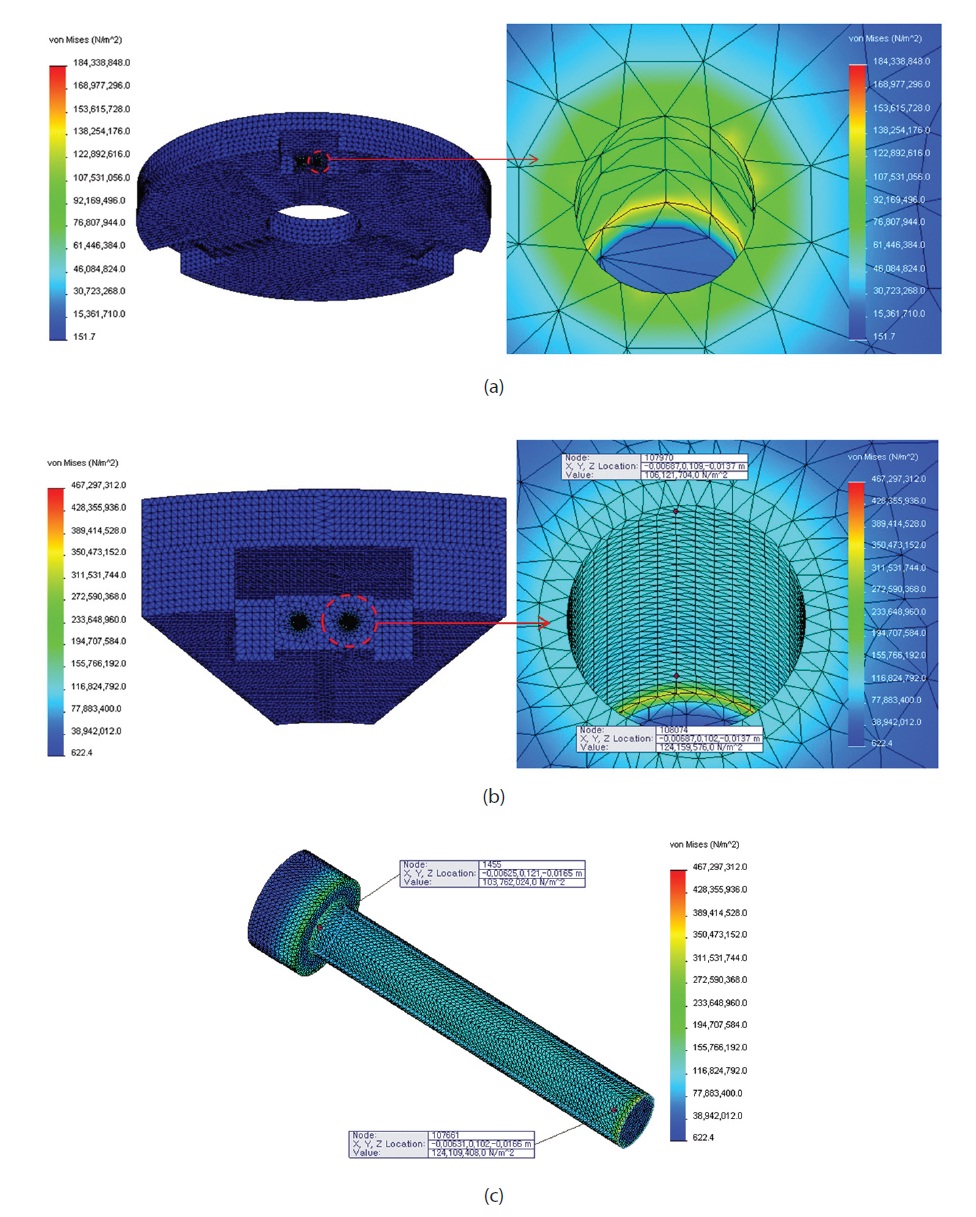
RMS WFE and maximum stress of a M-1 by bolt torque and thermal stress are arranged in Table 6. Due to the difference of coefficient of expansion of a bolt and M-1, maximum stress is 184.3 MPa as in Fig. 12a, which is calculated as exceeding the safety coefficient 2. Therefore, an accurate structural analysis using very tiny finite element model of a bolt was required. To decrease the memory and increase the computing speed, a segment mirror model was used and a result such as Fig. 12b. was obtained. According to the analysis result of a segment mirror model, maximum stress is calculated to be 467.3 MPa, which is around 2.5 times bigger, since a very tiny mesh was used instead of a full mirror model. Like stress distribution of Figs. 12b and c, it is verified that maximum stress occurs in a much localized spot. In regions under thermal loads, most stress distribution was measured as being in a range of 103 ~ 125 MPa, and a safety factor can be estimated as higher than 2.
Performance requirements of Mirrors of 30 cm cryogenic space infrared telescope are calculated considering the resonance, WFE measurement goal, and random vibration load, and to meet these requirements, the configuration of a flexure support structure and mirrors was determined. Through an opto-mechanical analysis, it is shown that a M-1 and M-2 assembled with flexures meet the requirement, RMS WFE < λ/8, for all gravity directions. It is considered that, in case of a M-1, there is no need for weight lightening unless solely to reduce the weight, since the required performance is achieved in the simplest form.
Assembly method of a M-1 and flexure using bolts was considered. Even though a M3 bolt, which can give bigger pre-load than actually calculated bolt pre-load for margin design, was chosen, it was numerically verified that the effect of bolt thermal stress on a M-1 when cooled until 77 K and bolt torque is within the range of performance requirements.