As the global market becomes more competitive, manufacturing industries face relentless pressure caused by a growing tendency of greater varieties of products, shorter manufacturing cycles and more sophisticated customer requirements. Efficient and effective supplier selection and order allocation decisions are, therefore, important decisions for a manufacturer to ensure stable material flows in a highly competitive supply chain, in particular, when customers are willing to accept products with less desirable product attributes (e.g., color, delivery date) for economic reasons. This paper attempts to solve optimally the challenging problem of supplier selection and order allocation, taking into consideration the customer flexibility for a manufacturer producing multi-products to satisfy the customers’ demands in a multi period planning horizon. A new mixed integer programming model is developed to describe the behavior of the supply chain. The objective is to maximize the manufacturer’s total profit subject to various operating constraints of the supply chain. Due to the complexity and non-deterministic polynomial-time (NP)-hard nature of the problem, an improved genetic approach is proposed to solve the problem optimally. This approach differs from a canonical genetic algorithm in three aspects: a new selection method to reduce the chance of premature convergence and two problemspecific repair heuristics to guarantee feasibility of the solutions. The results of applying the proposed approach to solve a set of randomly generated test problems clearly demonstrate its excellent performance. When compared with applying the canonical genetic algorithm to locate optimal solutions, the average improvement in the solution quality amounts to as high as ten percent.
It has been observed in marketing research that customers are often indifferent to certain product specifications and are willing to accept products with less desirable product attributes in exchange of price discounts. Intuitively, this extra degree of flexibility in meeting customers’ product specifications (customer flexibility) provides a way for manufacturers to improve profit by making better utilization of manufacturing and supply resources. It is, therefore, important for manufacturers to exploit the advantages of customer flexibility to the full in performing production planning, supplier selection and order allocation among the selected suppliers, in order to maximize profit.
Despite its significance, the challenging problem of developing suitable methodologies for assisting manufacturers to make optimal decisions concerning supplier selection and order allocation incorporating customer flexibility has received very little attention in the research community. Kim
In this paper, each product family consists of a range of products of the same nature (e.g., shirt, hat or bag). Each product (e.g., white collar shirt) in a product family (e.g., shirt) has a specified combination of product attributes (e.g., color, size), and is called a product variant. The product variants in a product family are governed by a generic bill-of-materials (GBOM) product structure (Jiao, 2000), and may share the common usage of raw materials and component modules. When customer flexibility exists, GBOM can be used to calculate the amount of raw materials, component modules and production resources required for satisfying customers’ demands for different product variants. To fully integrate customer flexibility into the supplier selection and order allocation problem, it must be effectively characterized and evaluated. This is a complex problem since customer flexibility is a relatively new concept which involves many uncertain and subjective factors. In this paper, a fuzzy multi-attribute utility approach is adopted to evaluate customer flexibility, which is characterized through the customer flexibility range and the customer flexibility response.
A mathematical model is developed in this paper to assist the manufacturer to solve the integrated supplier selection and order allocation problem optimally. The objective is to: 1) determine which product variants are produced and their corresponding production quantities; 2) select appropriate suppliers based on the four most frequently used criteria i.e., price, quality, on-time delivery (Weber and Current, 1993), and trust (Smeltzer, 1997); 3) assign the orders among the selected suppliers; and 4) maximize the manufacturer’s total profit. As the problem is non-deterministic polynomial-time (NP)-hard, an improved genetic approach is also developed in this paper to determine the optimal solution. Genetic algorithms are search and optimization algorithms that derive their computational mechanisms from natural selection and natural adaptation (Holland, 1975; Goldberg, 1989). The algorithms mimic the Darwinian evolutionary process by implementing the “survival of the fittest” strategy. Unlike many other optimization techniques, genetic algorithms do not require strong assumptions in the form of objective function and system constraints (Michalewicz, 1996). Indeed, the application of genetic algorithms as a decision aid has spread across a wide range of disciplines. Such applications include notable works in engineering (Hodge
The remainder of the paper is organized as follows. Section 2 presents the problem under investigation and introduces the method for evaluating customer flexibility. The detailed formulation of the mathematical model is also presented. Section 3 elaborates the development of the new genetic algorithm. In section 4, computational experiments are conducted using a set of randomly generated test problems to validate the efficiency of the developed genetic algorithm. Finally, conclusions are given in section 5.
2. PROBLEM STATEMENT AND MODEL FORMULATION
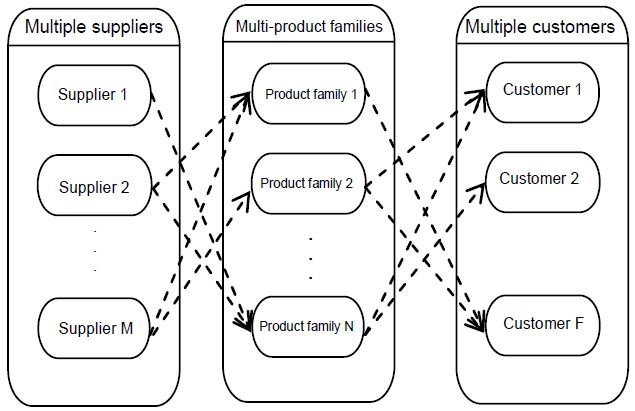
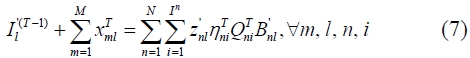
Figure 1 illustrates the supply chain network under consideration. A manufacturer aims to satisfy the various customer requirements by producing multiple families of products, with multiple product variants in each product family. These product families may share common and non-common raw materials and component modules. Since suppliers usually have limited raw materials and component modules capacities, it is important to determine the supply quotas to be allocated to each supplier to support the production of the product variants in the various product families.
2.2 Customer Flexibility Evaluation
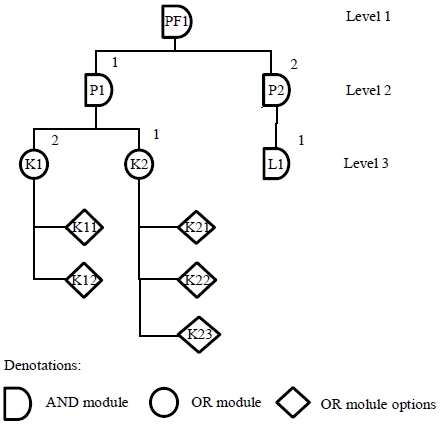
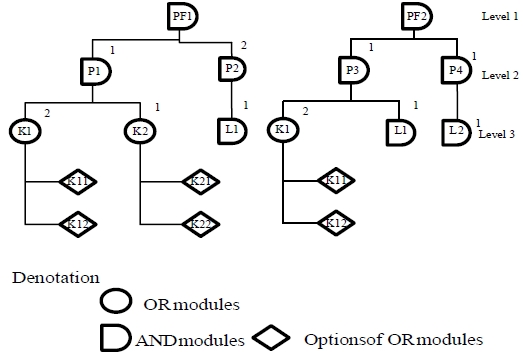
In this study, a multi-level GBOM modular product structure (Jiao, 2000) is used to calculate the amount of raw materials, component modules and production resources required to manufacture the products, in order to satisfy the various customers’ demands. Figure 2 shows an example of the product structure of a set of product variants belonging to a simple product family. A threelevel GBOM product structure is used. Two OR modules and one AND module is placed at level 3. The intermediate parts are located in level 2 and the final product is located in level 1. K11 and K21 represent the desired OR module options which constitute the desired product variant. There are up to six product variants in this family. The number six is the maximum number of different combinations of the OR module options.
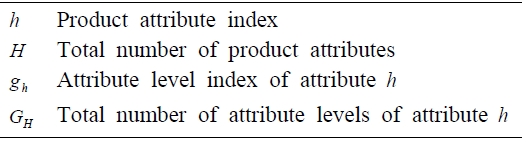
In addition, customer flexibility is characterized by both the range of the customer’s indifference to a product attribute (e.g., a specification), and his/her response to changes in this attribute. To facilitate the characterization of customer flexibility through range and response, the following notations are given:
2.2.1 Customer flexibility range
Customer flexibility centers on product attributes, with its customer flexibility range represented as:
2.2.2 Customer flexibility response
It is very difficult to represent customer flexibility response since a product specification involves multiple product attributes and requires the modeling of customer satisfaction. The problem could be solved by formulating customer preference functions for the product attributes based on utility theory. However, the utility based preference measure is ambiguous by nature. A fuzzy variable (Liu, 2002) is, therefore, used to denote the subjective assessment of the level of each product attribute. The credibility density function of this fuzzy variable is, then, utilized to denote customer preference functions which measure the utility value corresponding to a particular product attribute level.
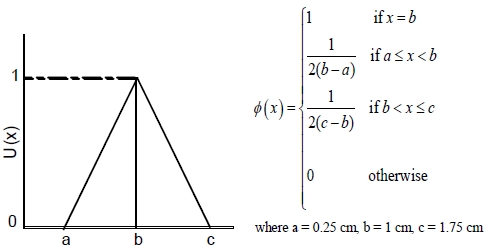
Figure 3 illustrates an example of a preference function denoted by a credibility density function of a triangle fuzzy variable characterizing different diameter values of a screw. It indicates that the desired diameter value is 1 cm, with its utility value equal to 1.0. The diameter values falling inside the range (0.25-1.75 cm) are acceptable but they have different utility values (less than 1.0).
2.2.3 Customer flexibility evaluation
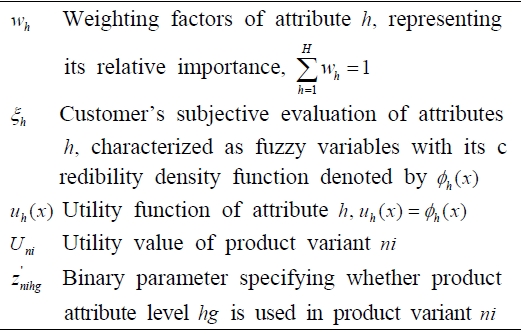
With the utility values measuring the various levels of each product attribute, product attributes can be evaluated and integrated. A general utility value called customer satisfaction can, therefore, be obtained for a particular product variant by aggregating the utility values of all involved product attributes into a single, overall utility measure. Since customer preferences are often subjective and imprecise by nature, this paper proposes a fuzzy multi-attribute utility approach to evaluate customer flexibility. To facilitate the presentation of this method, the following notations are used:
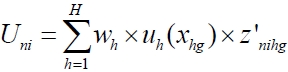
Since additive utility functions are widely used in marketing research, the aggregated utility value
A new mixed integer programming (MIP) model describing the characteristics of the supplier selection and order allocation problem is developed. The manufacturer aims to provide
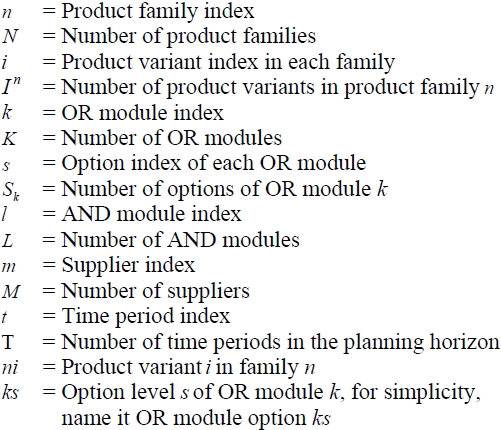
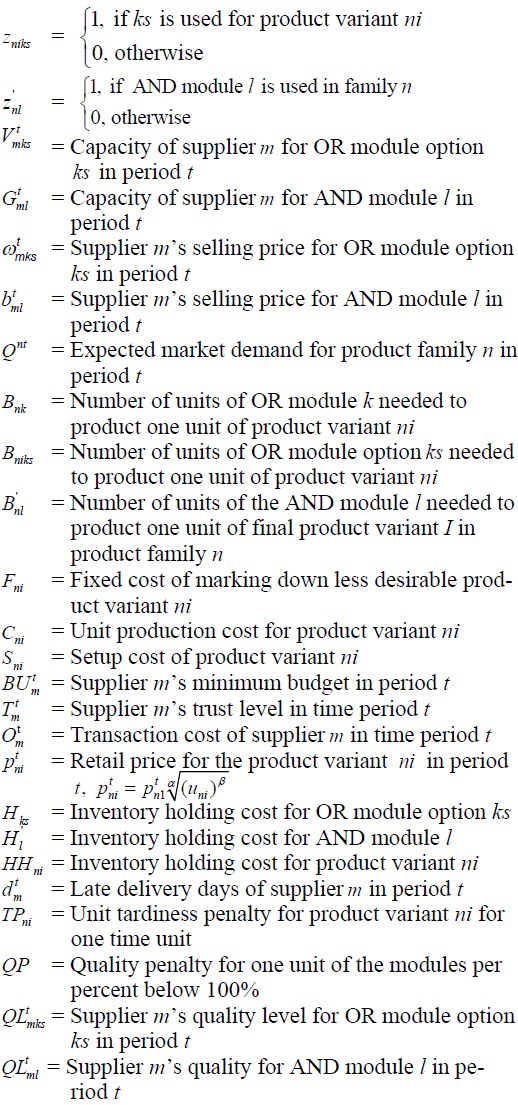
2.3.1 Notations
The notations used in the mathematical model are presented below:
2.3.2 Parameters
The parameters of the proposed model are listed below:
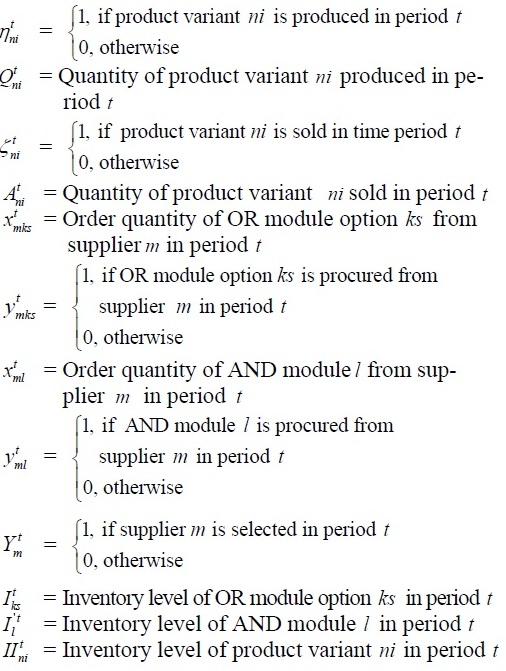
2.3.3 Decision variables
The decision variables of the proposed model are listed as follows:
2.3.4 Mathematical model
The mathematical model for the integrated supplier selection and order allocation problem is formulated as follows:
Objective:
Maximize total profit =
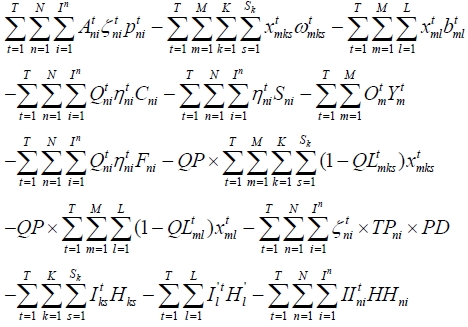
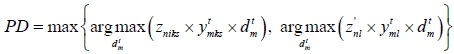
where
Subject to:


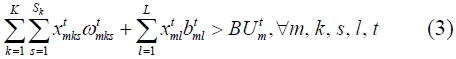
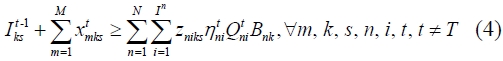
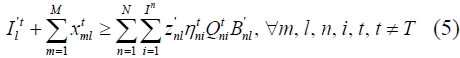
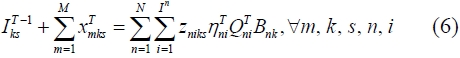
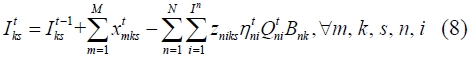
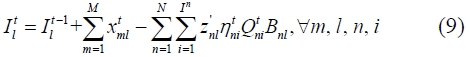

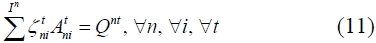


The objective is to maximize the manufacturer’s total profit which is equal to the total revenue generated by selling the product variants minus the total cost. The total cost is the sum of the cost for purchasing raw materials, the cost for production and production setup, the cost for transaction with suppliers, the cost for marking down less desirable product variants, the cost for quality penalty and tardiness penalty, and the cost for inventory holding for both raw materials and product variants. The constraints are comprised of suppliers’ capacity constraints and budget constraints, GBOM constraints, demand satisfaction constraints, and inventory balance constraints.
3. AN IMPROVED GENETIC ALGORITHM
The proposed supplier selection and order allocation problem is a very complex problem which is NPhard by nature. This necessitates the development of an efficient and effective optimization algorithm to locate optimal solutions. Hence, this paper develops an improved genetic algorithm equipped with two problem specific repair heuristics and a new selection method to solve the problem. The details of the genetic operators, the representation of the chromosomes and the repair heuristics are presented in the subsequent sections.
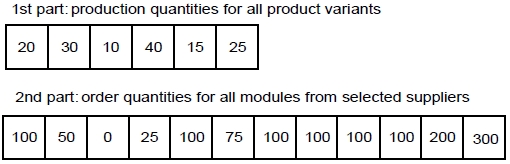
A two-part chromosome structure is used for the illustrative example which consists of two product families with GBOMs as shown in Figure 4. The first part determines the production quantities of the product variants in each family. The second part represents the order allocation of the modules among the selected suppliers under the production plan indicated in the first part.
Figure 5 illustrates an example of a feasible chromosome for representing a production plan for these two product families with 4 and 2 product variants, respectively, and the order allocation of the 4 modules among 3 suppliers.
Since it is not easy to randomly generate the first part of a feasible chromosome satisfying the demand requirements, the GBOM and supplier capacity constraints, two problem specific repair heuristics are developed to ensure the feasibility of the solutions represented by the chromosomes.
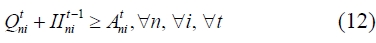
Heuristic I: meeting customer demands
Step 1: Calculate the sum of the production quantity of each product variant in each product family. If the demand is not satisfied, then use step 2, otherwise use step 3.
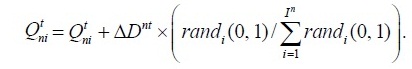
Step 2: Randomly generate In real numbers between 0 and 1 for each product family in each time period using randi(0, 1) and calculate their sum. Multiply the unmet demand of each product family denoted by
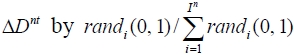
( i = 1, 2, ㆍㆍㆍ, In ), and then obtain the modified production quantity for product variant ni by
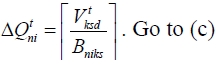
Step 3 : Find

and reduce the production quantity of the corresponding product variant by min

where

is the oversupply of the product demand. Repeat this process until
= 0.
Heuristic II: meeting GBOM and capacity constraints
The determination of the respective production quantities of the product variants is also governed by the availability of the various OR module options, and the relationships between these OR module options and the product variants as indicated in their respective GBOMs. A repair heuristic is, therefore, developed and applied to the randomly generated chromosomes in Heuristic I to ensure solution feasibility. Details of the heuristic are described as follows:
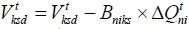
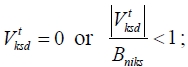
Step1 : Calculate the deficient capacity for OR module option ks in period t (denoted by

based on the production plan generated in Heuristic I using the equation
If

i.e., the amount of OR module option

, there is surplus capacity for this OR module option, and the production quantities of certain product variants can be increased.
Step 2 : Reduce the production quantities of the low-profit product variants
a) If
for all product variant ni that utilizes this OR module option, and reduce its production quantity by
b) If
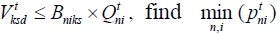
for all product variants ni that utilize this OR module option, then reduce the production quantity of this product variant to zero.
c) Calculate
and repeat (a) or (b) until all

However, the results obtained by using procedures (a), (b), and (c) may lead to violation of some customers’ demand constraints. The following procedure is, therefore, adopted to increase the production quantities of the high-profit product variants.
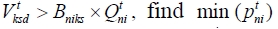
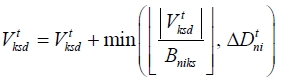
Step 3: Increase the production quantities of the highprofit product variants
a) List all the OR modules options according to 11, 12, …, 1S1 , 21, 22, … , 2S2 , … , K1 , K2 , … , KSk Starting from the first one, for any
find

and increase the production quantity of the corresponding product variant by min
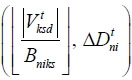
where

is the unmet demand of the product family.
b) Calculate
for all OR module options that can be used to produce the product variant ni in step 3(a), i.e.,
find the product variant with the second highest profit, repeat (a) and (b), until
otherwise, move to the next OR module option.
c) Repeat (a) and (b) until the demand is satisfied.
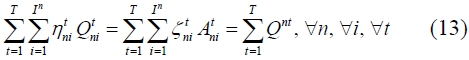
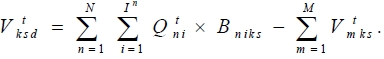
In the evaluation process, the fitness value is calculated, which is the objective function for maximizing the manufacturer’s profit. The first part of the chromosome is determined by using heuristics I and II to ensure solution feasibility. The second part is related to the allocation of orders among the suppliers for raw materials and module options which can be formulated as the following integer programming problem:
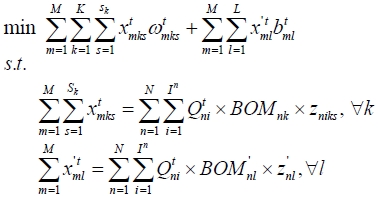
where

is determined in the first part of the chromosome.
Hence, it can be determined optimally by using the software package “LP_SOLVE.”
Genetic algorithms have been extensively used for solving complex problems. In a canonical genetic algorithm, the selection operator is the driving force that leads to chromosomes with higher fitness values and thus better chances to be selected. However, this selection method might also eliminate some “less fit” chromosomes which may carry some good characteristics and useful schema that could produce good offspring when mated with the right match. Motivated by this, a new selection method is developed to prevent the search process from converging prematurely to local optimal solutions.
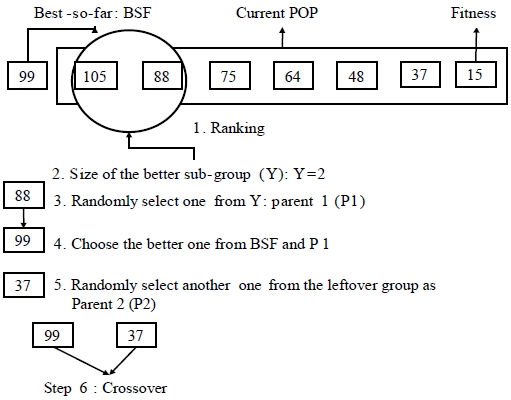
Figure 6 lists the steps of the proposed new selection method. To form the parents, the procedure selects randomly one chromosome from a subgroup of chromosomes with better fitness values, and it compares the selected chromosome with the best chromosome obtainned so far. The chromosome with a better fitness value is, then, selected as a member of the parents. The other member of the parents is randomly selected from the chromosomes outside the subgroup. This method does not only allow interaction with the better chromosomes, but also allows the less fit chromosomes that might carry good schema to have a chance to mate. In so doing, both exploration and exploitation of the solution space are encouraged. The exploitation rate is controlled by selecting an appropriate size for the subgroup. Larger size results in more exploitation and smaller size indicates more exploration. Hence, balance of exploration and exploitation can be realized.
After selection, the crossover stimulates the generation of a new pair of child chromosomes. To create a new child chromosome, this paper adopts a uniform crossover operator with a crossover mask which has the same length as the first part of the chromosome. Then LP_SOLVE is used to generate the second part of the chromosome optimally. To avoid premature convergence, a mutation operator is adopted and applied to the first part of the chromosome. For each product variant, a random number ranging between 0 and 1 is generated. The production quantity of product variant

if its random number is less than the specified mutation rate. Neither the crossover nor the mutation operation can guarantee solution feasibility. Hence, the proposed repairing heuristics (heuristic I and heuristic II) are applied to the chromosome after these two operators in each generation.
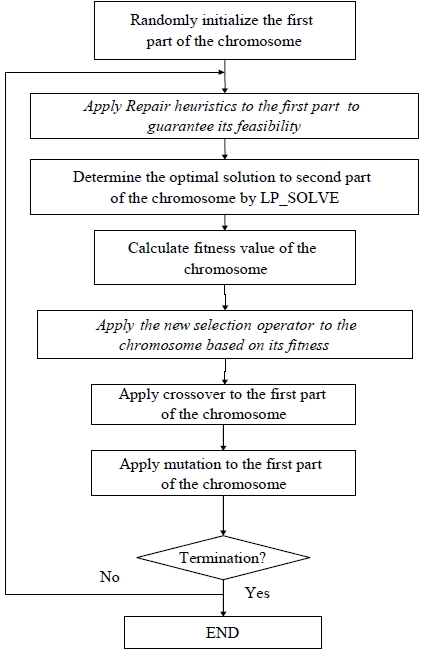
3.6 Flowchart of the Improved Genetic Algorithm
The procedures of the improved genetic algorithm are presented in Figure 7.
Extensive computational experiments were carried out to evaluate the effectiveness of the proposed genetic algorithm (GA).
4.1 Test Problems and Parameters
A set of 54 test problems was generated randomly based on real life characteristics. The number of product families considered ranges from 4 to 8, each has a unique product structure depicted in its GBOM. Multiple time periods ranging from 1 to 7, and multiple suppliers, ranging from 3 to 6 are considered. The number of OR modules and AND modules are generated randomly between 2 and 6. Each OR module has several options ranging from 1 to 6. The parameters of the proposed GA were determined experimentally using a small set of sample problems. The population size is 30 and the termination condition is 100 iterations. The crossover and mutation probabilities are fixed to 0.6 and 0.02, respectively. Visual C++ 6.0 programming language is used on a computer equipped with Inter Pentium 1.56 GHz CPU and 1024 MB RAM. The size of the subgroup,
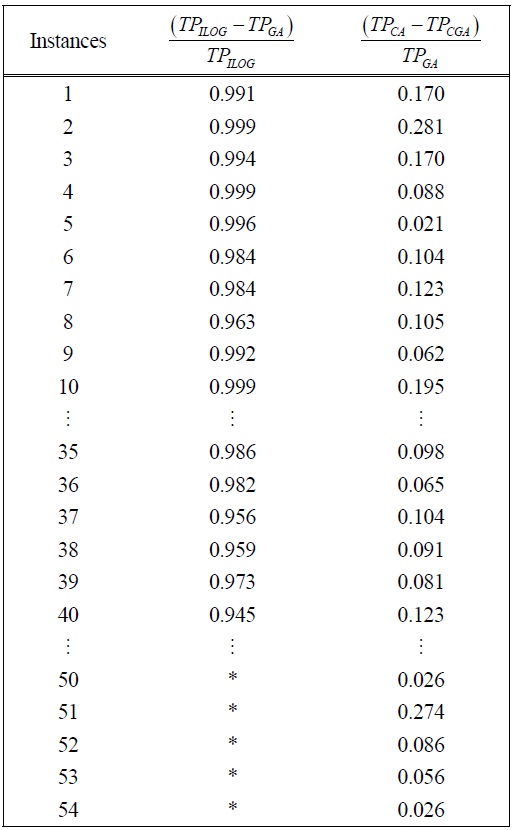
4.2 Comparisons with ILOG OPL and Canonical Genetic Algorithm
The proposed GA was applied to solve all 54 test problems generated in section 4.1. The results obtained are compared with those obtained by using ILOG OPL (IBM Co., New York, NY, USA), a commercial software for locating global optima for mixed integer programming problems, and by using canonical genetic algorithm (CGA). The size of the subgroup is fixed to 2 (
Nowadays, customers are often indifferent to certain product specifications and are willing to accept products with less desirable product attributes in exchange for price discounts. It is, therefore, essential for a manufacturer to exploit the advantages of customer flexibility to the full in order to maximize profit. This paper investigated an integrated supplier selection and order allocation problem for a supply chain manufacturing multi-products over a multi-period planning horizon when customer flexibility exists. A fuzzy multi-attribute utility approach was proposed to evaluate customer flexibility which is characterized through range and response. To facilitate mapping customer demand requirements into raw materials and component parts requirements, the structure of the products is described by
[Table 1.] Results of ILOG and the proposed genetic algorithm

Results of ILOG and the proposed genetic algorithm
GBOMs. A novel mathematical model in the form of a mixed integer programming model was developed to assist the manufacturer in selecting suppliers as well as allocating orders to the selected suppliers optimally. The objective is to satisfy the customers’ demand requirements and to maximize its profit subject to various operating constraints. Since the problem is very complex and is NP-hard in nature, an improved genetic algorithm was developed as an optimization tool to solve this challenging problem. Extensive numerical experiments were conducted on a set of randomly generated test problems based on real life characteristics. The results clearly indicated that the proposed genetic algorithm is superior to the canonical genetic algorithm in locating nearoptimal solution for small and large scale problems, and that it has similar performance when compared with ILOG OPL, a commercial software, in finding highquality solutions for small scale problems. When the scale of the problem is large, ILOG OPL cannot locate any solution even after running for a relatively long time.