In this paper, a procedure using a genetic algorithm (GA) and a heuristic local search (HLS) is proposed for solving facility rearrangement problem (FRP). FRP is a decision problem for stopping/running of facilities and integration of stopped facilities to running facilities to maximize the production capacity of running facilities under the cost constraint. FRP is formulated as an integer programming model for maximizing the total production capacity under the constraint of the total facility operating cost. In the cases of 90 percent of cost constraint and more than 20 facilities, the previous solving method was not effective. To find effective alternatives, this solving procedure using a GA and a HLS is developed. Stopping/running of facilities are searched by GA. The shifting the production operation of stopped facilities into running facilities is searched by HLS, and this local search is executed for one individual in this GA procedure. The effectiveness of the proposed procedure using a GA and HLS is demonstrated by numerical experiment.
With changes in the economic and social environment, the volume of production is decreased adapting to the decreasing of demands. If the decrease is a temporary phenomenon, it will be adapted to decrease the production volume by modifying production scheduling and/or human resource assignment. If the modification cannot satisfy the cost constraint, some facilities are stopped and costs for those facilities are reduced. In this study, this problem is represented as a facility rearrangement problem (FRP).
In the area of the facility layout research, dynamic facility layout problems (DFLPs) were formulated and many solving methods have been proposed (Urban, 1993; Conway and Venkataramanan, 1994). In this approach, the number of operating facilities is given, and the material flow values between facilities are changed in each period. Those approaches could not consider operating or stopping of facilities and shifting of operations at stopped facilities.
To consider these matters, the facility rearrangement problem model was built and evolutionary solving methods have been proposed by Suzuki
FRP can be divided into two sub-problems: the decision problem of stopped/running facilities and the integration problem of production operations in stopped facilities to running facilities. The integration problem can be dealt as a sub problem of the decision problem. In a previous study (Suzuki
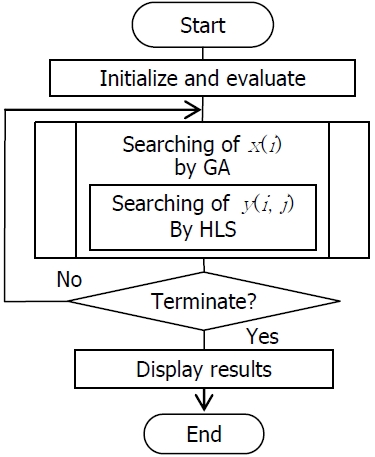
This paper proposes a solving procedure using a GA and a heuristic local search (HLS). Stopping/running of facilities is searched by GA. The shifting of production operation of stopped facilities into running facilities is searched by HLS, and this search is executed for one individual in this GA procedure. This procedure using GA and HLS can find more effective alternatives than the two-step GA (Suzuki and Yamamoto, 2010). The effectiveness of the proposed procedure using GA and HLS is demonstrated in a numerical experiment.
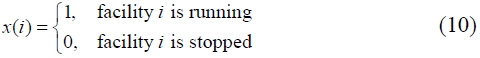
In this study, the following problem is considered. In this period, a product is being manufactured by using
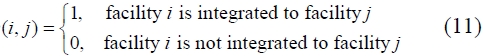
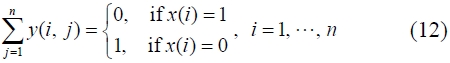
When a facility is stopped, the production operation in the facility is shifted into other running facility, and this shifting is called integration in this study. In the case of integration of facility i to facility
Under the assumption mentioned above, the conditions of running or stopping of facility should be decided to maximize the total production capacity.
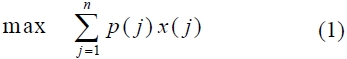
The objective function is an equation of total capacity of operating facilities and this should be maximized.
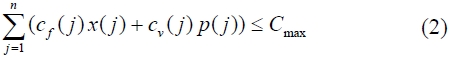
subject to
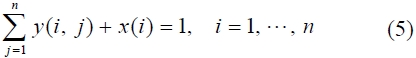


For i = 1, …, n , j = 1, …, n,
cf(j): fixed cost of facility j,
cv(j): variable cost of facility j,
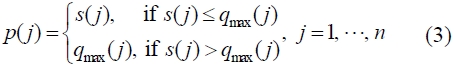
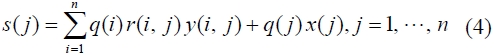
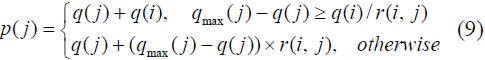
p(j): volume of production in facility j (after integration),
q(i): volume of production in facility i (before integration),
qmax(j) : maximum value of capacity of facility j,
r(i, j): decreasing ratio by integration from facility i to facility j.
For example, if facility
In this model, the condition of facility
If
The cost reducing ratio

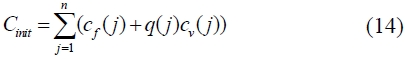
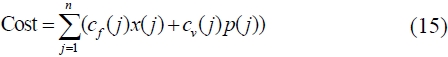
The coat of rearranged facilities is estimated by Eq. (15):
In the cases of
In section 2.2 of this paper, FRP can be represented as a 0-1 (binary) programming model. In this manner, simultaneous searching of
In this study, this problem is dealt as searching of
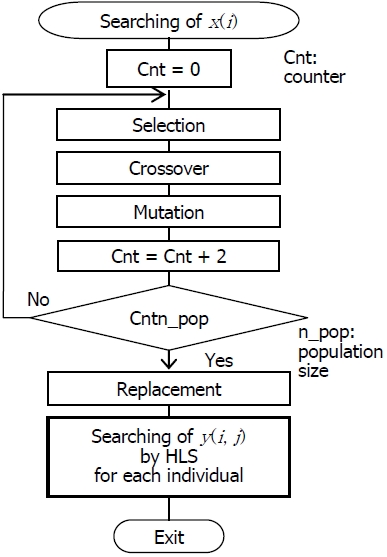
In the proposed procedure,
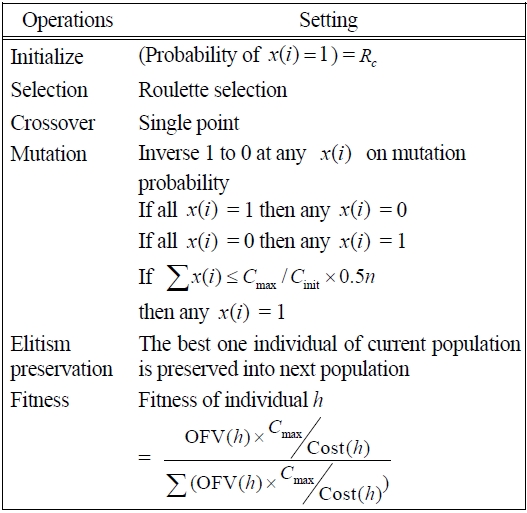
At the initialize step,
For searching of
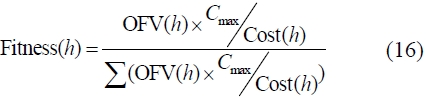
In the step of selection, two individuals are selected from current population with roulette selection based on the selection probability value of the individual. The fitness of Individual
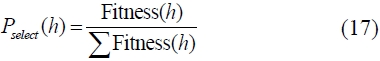
The selection probability of Individual
[Table 1.] Setting for genetic algorithm procedure

Setting for genetic algorithm procedure
In the step of crossover, a simple (single point) crossover is operated into two selected individuals as exchanging of two vectors of
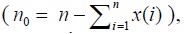
The mutation is performed as inversing 1 to 0 at any
then any
Selection, crossover and mutation are repeated until the number of the generated new individuals (as children) =
The current population is replaced by new individuals. If elitism preservation is operated, the best individual( s) is adopted as the top of population of the next generation. In this paper, the best one individual is kept at next as the elitism preservation. The individuals of new population are evaluated for objective function value (OFV), cost, fitness and selection probability. This procedure is repeated until termination condition.
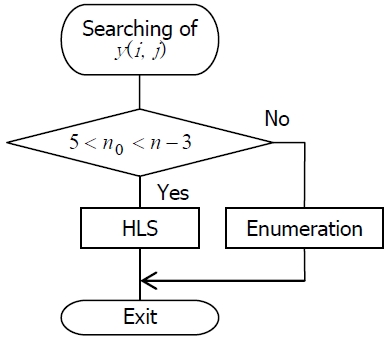
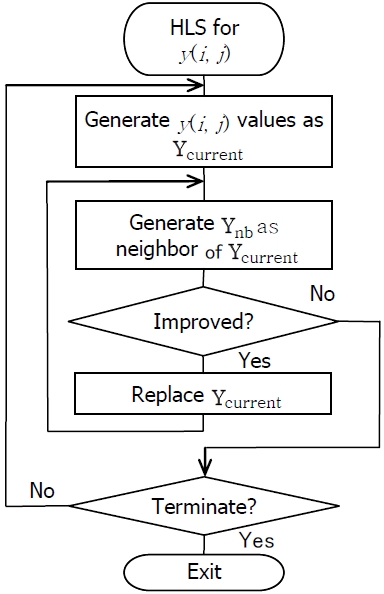
The HLS procedure is executed for searching of integration alternatives from the stopped facilities into any running facilities under restriction based on the values of
in other cases enumeration is executed as Figure 3.
In the first step of the HLS procedure (Figure 4), one alternative of integration,
(
These values means that facilities 2 and 5 are stopped and other facilities are running. It is assumed that the following one integration alternative is generated from this individual as a current alternative:
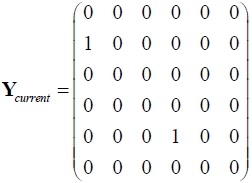
This Y
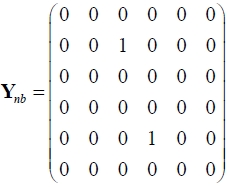
If this Y
For demonstration of the proposed algorithm, a numerical experiment is executed. Problem data sets are used in Suzuki and Yamamoto (2010).
As experiment, 42 data sets of example problem, that is 7 problems × 6 rates of cost decreasing max
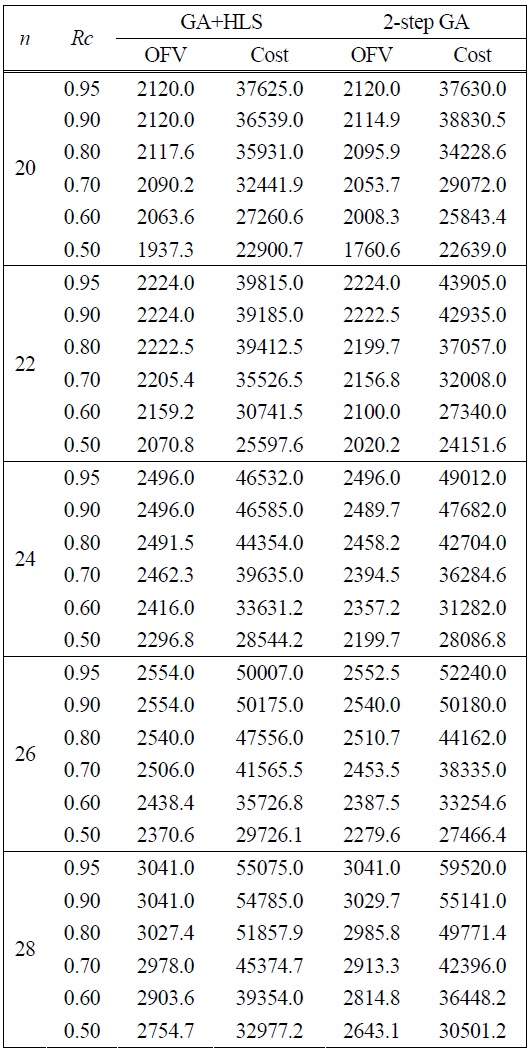
The numerical experiment was executed in the following computational environment: Pentium4 CPU 3.60 GHz, 2.00 GB RAM, Microsoft Windows XP Pro SP2, BCC++ 5.5. The result of experiment is listed in Table 2.
In all cases, OFVs and cost values by GA+HLS are excellent to values by 2-step GA. In the cases of
[Table 2.] Comparison of by GA HLS and 2-step GA (mean of OFVs and cost values)

Comparison of by GA HLS and 2-step GA (mean of OFVs and cost values)
This paper proposed a procedure using a genetic algorithm and a heuristic local search to solve the facilities rearrangement problem. The proposed procedure featured the generation method for initial population, a new estimation method of fitness, selection by roulette selection, simple crossover operation, and mutation by 0/1 inversing operation. For the search of integration of production operation in stopped facilities, the heuristic local search is used. The result of the numerical experiment demonstrated the effectiveness of this proposed procedure.
As a future study, use of the searching of