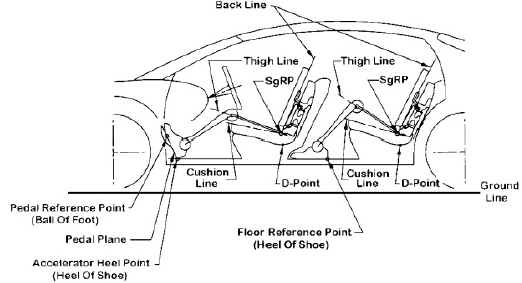


At the early stage of developing vehicle, overall dimensions such as overall length, -width, -height need to be decided. Adding to overall dimensions, hard-points of the vehicle such as driver’s sitting reference point (SgRP), steering wheel position, belt line, cowl position, and deck position need to be decided to maximize the vision, convenience, control, comfort, safety, luggage capacity and habitability (interior space) (Figures 1 and 2).
This step of vehicle development is called packaging. Each packaging dimension influences one or more levels of discomfort that are felt by driver. Controlling one packaging dimension to reduce one level of discomfort does not necessarily mean it controls the other levels of discomfort the same way. For some dimensions, two or more related levels of discomfort can go in the opposite direction.
Various studies have been conducted regarding the usability of the automobile. Studies on certain features of the automobile such as usability of in-vehicle information system (Harvey
Nevertheless, few studies have been conducted regarding overall packaging dimensions from the view point of usability for ordinary drivers in their daily life use of the vehicle. Therefore, the aim of this study is to analyze and count ordinary drivers’ activities performed in the vehicles, and to find out the appropriate range of each packaging dimension based on the drivers’ daily use of vehicle that minimizes the discomfort level of drivers.
Three steps were taken to achieve this goal. In the first step, daily-life scenario was suggested, which consists of 96 driver’s standard activities. Each activity was divided into eight packaging criteria groups. In addition, 32 automobile packaging parameters were connected to each activity. By surveying and analyzing the test participants’ daily lives, activities were rearranged and organized into a daily-life scenario. In the second step, a customer driving test was performed on the course which is designed on the basis of the scenario suggested at the first step. The test participants were directed to answer the discomfort level questionnaires while driving on the test course. In the third step, the test result was analyzed so that engineering guide lines for vehicle packaging parameters can be drawn. This paper shows how to define the guide lines for two packaging parameters, ‘vision- line angle forward and downward’ and ‘vision-line angle forward and upward.’
3. FIRST STEP: COMPOSING MID-SIZE SEDAN USER’S DAILY-LIFE SCENARIO
The scenario in this study means a series of activities the real mid-size sedan drivers will do in and out of their vehicles through their daily lives. As a preparation step for composing user’s daily-life scenario, actions that the drivers usually do inside or outside of their vehicles needed to be arranged. By documentary survey and brain storming, 96 activities that drivers usually perform inside or outside of their vehicles were selected. Table 1 shows the excerpts from the list of 96 driver’s standard activities.
[Table 1.] List of activities (abridged)
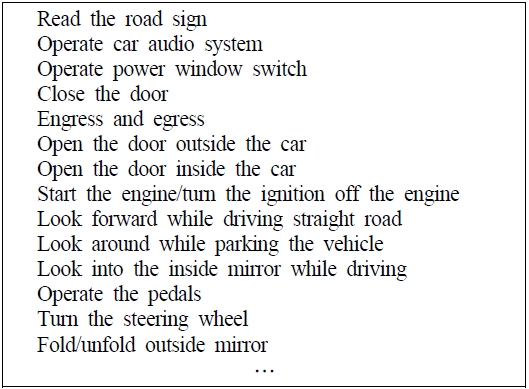
List of activities (abridged)
Each of the 96 driver’s standard activities is related to 8 packaging criteria groups (engress and egress, vision, convenience, control, comfort, safety, luggage, and habitability) and various automobile packaging dimensions. According to this relation, it was found that the relation between driver’s standard activities and packaging criteria groups and the relation between driver’s standard activities and various automobile packaging dimensions are not ‘one to one relation’ or ‘one to many relation.’ Rather they are complex interrelations. Also they have the following two characteristics: 1) Making one activity easier by changing automobile packaging dimension does not necessarily mean other activities easier, 2) Making drivers belong to certain-physically-conditioned group do certain activity easier does not necessarily mean other groups easier.
In many cases, making one activity easier by changing one of the various automobile packaging dimensions does not always help other activities easier. In some cases, they go in the opposite way. In addition, as drivers vary in their physical conditions, the range of an automobile packaging dimension will vary for them to find it the most comfortable to perform certain activity for each of them. So it is necessary to find the optimal range of automobile packaging dimensions which ensure the greatest comfort, under condition that that range will not seriously threaten drivers’ certain physical condition.
These two characteristic features of automobile packaging dimensions are what this study aims to deal with so that optimal ranges for automobile packaging dimensions can be suggested. Considering these characteristics, two measures have been taken; daily-life scenario was organized based on 96 drivers' standard activities that represent virtually all activities performed inside or outside of the vehicles by the drivers (Table 1).
In the next step, the customer driving test will be performed on the course which is designed on the basis of the scenario suggested at this step. To cover the demographic characteristic of automobile packaging dimensions, one hundred two test participants were elaborately selected to represent the entire Korean mid-size sedan owners.
4. SECOND STEP: CUSTOMER DRIVING TEST
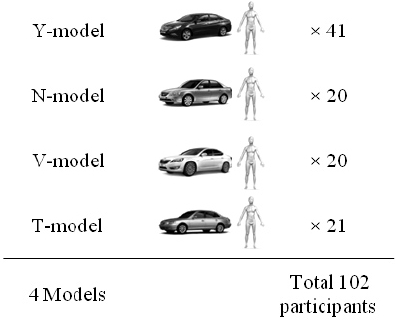
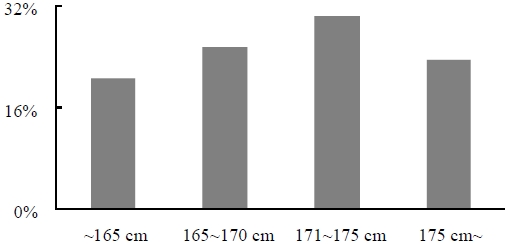
The participants for the customer driving test consisted of 102 actual owner-drivers of 4 different models of mid-size sedan. Those models will be called Y, N, V, and T-model, respectively: Y-model 41, N-model 20, Vmodel 20, and T-model 21; 82 out of 102 were male and 20 out of 102 were female (Figure 3). Height distribution of test participants was shown on Figure 4. They participated in the customer driving test by driving their own vehicles on the course designed based on daily-life scenario in section 3.
Test participants were instructed to write self diary about daily usage of their vehicle for one week. Then the activities were rearranged by rank according to the frequency which appeared on their diaries.
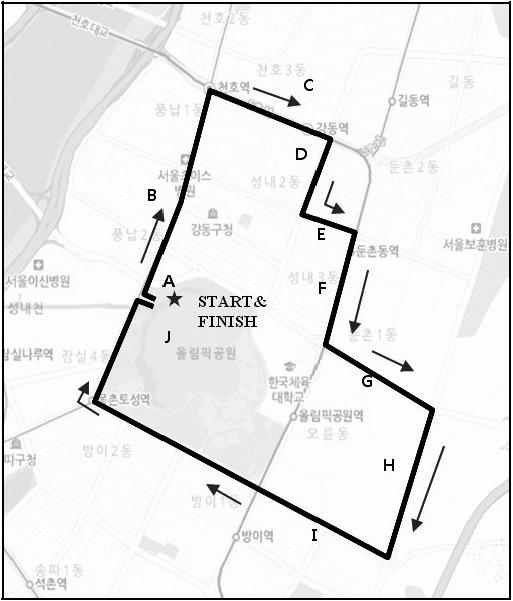
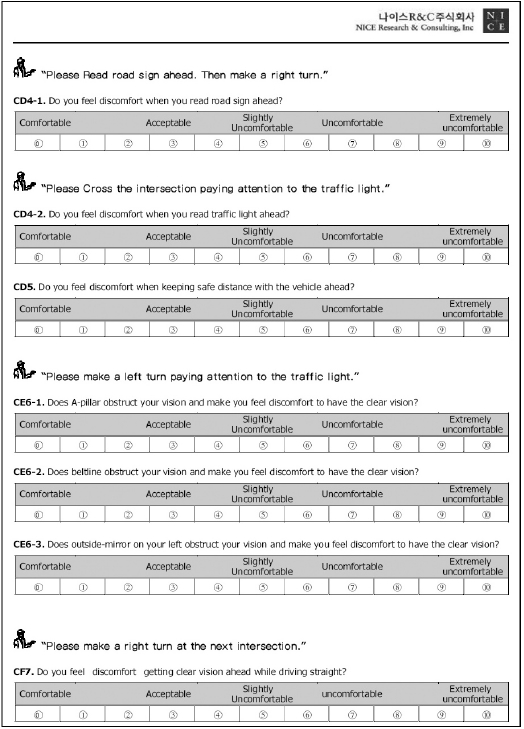
On pre-designed locations, each question was asked to the test participants. The answers were given in the form of ten-score discomfort level which represents how much difficulty or discomfort test participants feel when they are performing a certain activity. Figure 5 and Table 2 show the test course designed to represent the midsize sedan user’s daily-life scenario and activities that the test participants were instructed to perform on predesigned locations. Test participants were directed to use his or her own vehicle, instead of using the test vehicle, because discomfort level perceived by the long term owner of the vehicle was interest of this study.
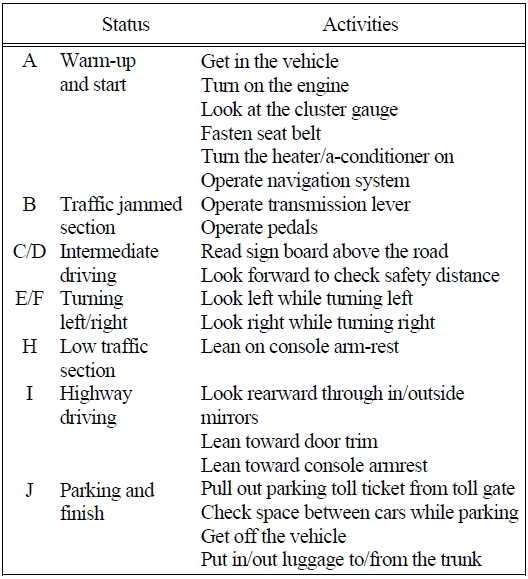
Test scenario
The test results were analyzed considering variances among the physical conditions of test participants.
5.1 Analysis of Vision Line Forward and Upward
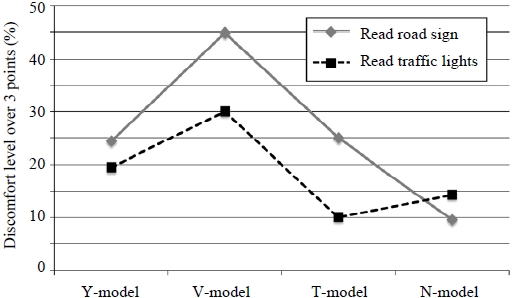
Percentage of the test participants whose answers were larger than point-3 were compared on Figure 7. Point- 3 from 10-point-scale (‘acceptable’ level in the questionnaire on Figure 6) was considered as the proper threshold for defining comfortable or uncomfortable range for any packaging dimension for two reasons. First, when the proportions whose answer was larger or lower than point-3 were compared, significant distinctions among different test vehicle users could be found. Secondly, when test participants’ answers were above point-3, they expressed difficulty in the interview.
Table 3 shows the average vision line angle at each discomfort level doing two different activities: ‘read road sign’ and ‘read traffic lights.’
[Table 3.] Average vision line angle at each discomfort level
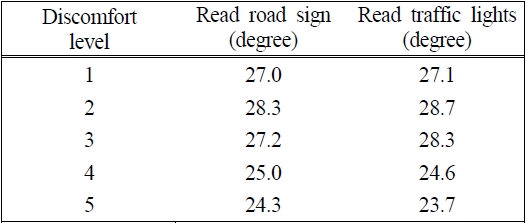
Average vision line angle at each discomfort level
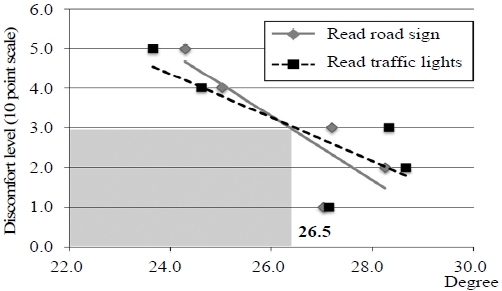
The test result of packaging dimension, ‘vision line forward and upper’, was interpolated ‘vision line angle’ for the argument and ‘discomfort level’ for the dependent variable. Two activities, ‘reading road-sign’ and ‘reading traffic lights’, were related to this dimension. Figure 8 shows the interpolated results of both.
At the threshold for packaging criterion point-3, the angle of ‘vision line forward and upper’ for ‘reading traffic light’ is 26.4 degree, and the angle of ‘vision line forward and upper’ for ‘reading traffic light’ is 26.5 degree.
Thus in the case of ‘vision line forward and upper’, ‘read traffic lights’ is the activity which defines the packaging dimension criterion. If the vision line angle is kept over 26.5, users will feel the discomfort level of 3 or less whether they read road sign or traffic lights.
5.2 Analysis of Vision Line Forward and Downward
Activities related to packaging dimension ‘vision line forward and downward’ are ‘look forward to check safety distance’ and ‘look around while parking the vehicle.’ The discomfort level while performing these two activities will be analyzed to define appropriate range for ‘vision line forward and downward.’
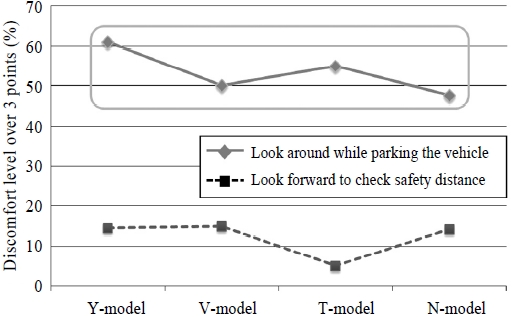
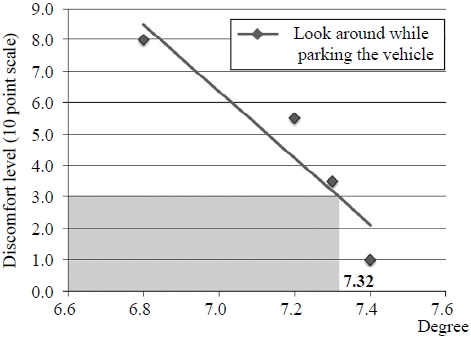
Interpolation was performed the same way as in ‘analysis 1.’ Figure 9 shows that drivers (test participants) feel far more discomfort when they ‘look around while parking the vehicles’ than when they are ‘looking forward to check safety distance while driving’. So ‘look around while parking the vehicle’ can be assumed as decisive activity to define the appropriate range of ‘vision line forward and downward.’
Table 4 shows average angle of ‘vision line forward and upward’ at certain discomfort level felt by participants, while performing activity ‘read traffic lights.’
[Table 4.] Average vision line angle at each discomfort level
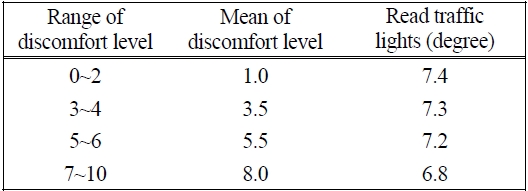
Average vision line angle at each discomfort level
Figures 9 and 10 show the graph and interpolated result. If this result was analyzed as the same way the vision line forward and downward was done, we can find out that the appropriate range for the vision line angle forward and downward will be 7.32 degree and more.
Activities related to packaging dimension ‘vision line forward and downward’ are ‘look forward to check safety distance’ and ‘look around.’
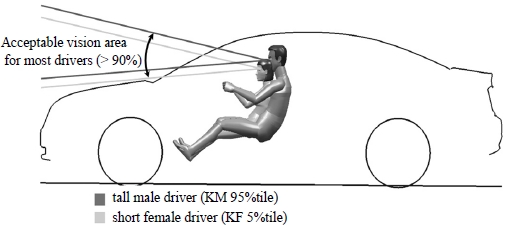
The analysis result of vision line forward (both upward and downward) can be implemented on the vehicle styling as follows. As shown in Figure 11, draw vision lines forward (upward and downward) from the point of a short female driver’s eye. Again draw vision lines from the tall male driver’s eye point. The angles are 26.5 degree for upward and 7.32 degree for downward, respectively. If there is no obstruction between upward line and downward line, we can assume that the driver feels that the provided vision area is acceptable. When the acceptable vision area is to be furnished for Korean drivers who are taller than Korean female 5%tile and shorter than 95%tile Korean male (more than 90% of Korean drivers) in the forward vision, there should be no vision obstruction between ‘vision line forward and downward’ for KF 5%tile and ‘vision line forward and upward’ for KM 95%tile.
To implement these vision criteria to the vehicle, two conditions need to be satisfied in the designing process.
Condition 1: Shape of hood: shape of hood underlies below ‘vision line forward and downward’ for KF 5%tile so that hood panel does not hinder forward and downward vision.
Condition 2: Roof front end position: the position is above ‘vision line forward and upward’ for KM 95%tile so that roof or headlining of the vehicle does not hinder the forward and upward vision.
If the design of a vehicle satisfies these two conditions, most Korean drivers (over 90%) will feel the vision area of that vehicle ‘acceptable.’
This study aims to define the packaging criterion for engineering vehicle packaging. In order to achieve the purpose, 102 Korean mid-size sedan owner-drivers were selected and directed to test drive on the predesigned course which simulates mid-size sedan owner’s daily-usage scenario. At pre-designed locations, they were asked to perform the driver’s standard activities and report their discomfort level. By analyzing their answers, the optimal ranges for packaging dimensions were defined to be used as a packaging criterion.
This study has meanings in two ways. Firstly, it is based on the analysis of discomfort level experienced by the ordinary drivers, not by the test engineers of automotive manufactures, to the scale that the result of test has statistical significance. Secondly, this study focuses on daily life use of the vehicle. Driving test was performed not in the test bed or computer controlled simulator but on the real driving environment.
The test scenario, where this study was based on, was woven with 96 drivers’ standard activities that include most of the activities ordinary drivers would perform while driving. Therefore the packaging criterion induced in this study can be viewed as an appropriate guide-line for developing the packaging of vehicle which can minimize the discomfort level of ordinary drivers for their daily life use of the vehicle. As new models of automotive vehicle are introduced to the market every few years, they will be analyzed and the results will be used to improve and perfect the packaging criteria and the method of defining them.

