The paper proposes a non-parametric methodology, data envelopment analysis, for measuring efficiency and productivity in service delivery systems with capacity constraints. The methodology provides allocation approaches for studying behaviors of firm and customers in service delivery strategy. The experimental study is carried out to investigate allocation behaviors and conduct an objective tradeoff between efficiency approach and productivity approach. The experimental result indicates that the efficiency approach allocates resource via maximizing customer efficiency rather than firm productivity as in the productivity approach. Moreover, the experiment reveals that there exists an objective tradeoff between the efficiency approach and the productivity approach. These findings provide strategic options for allocation policy in service delivery systems.
Consumer behavior theory has recognized customers’ role in the production and delivery of a service. Chase (1978) recognized the interaction between the customer and the firm, whereas Globerson and Maggard (1991) discussed the importance of integrating the production role of customers into the design of service delivery systems. Sampson and Froehle (2006) stated the presence of significant customer inputs in service processes. Since the customer is regarded as the co-producer (Parks
The earlier researchers have proposed non-parametric frontier techniques for measuring efficiency and productivity of decision marking units (DMUs). Data envelopment analysis (DEA) was initiated in 1978 when Charnes, Cooper and Rhodes (CCR) demonstrated how to change a fractional linear measure of efficiency into a linear programming format. Based on the original CCR model, various theoretical extensions have been developed. Banker
The concept of customer efficiency was first introduced by Xue and Harker (2002), and the DEA method is used to measure customer efficiency in E-shopping. In another research, Xue
For that reason, this paper develops output-oriented CCR models under the efficiency approach and the productivity approach applying the non-parametric methodology. The experimental study on a hypothetical service system is carried out to assess allocation behaviors of firm and customers in service delivery strategy. In addition, the experiment uses the multi-objective particle swarm optimization (MOPSO) algorithm from Objective Library for Evolutionary Techniques (ET-Lib; Nguyen
DEA is a mathematical programming based on nonparametric technique that is designed to compare and evaluate the relative efficiency of a number of DMUs. Since DEA method requires no prior assumption on the specification of the best practice frontier, it is a better way to organize and analyze data since it allows efficiency to change over time. The advantage of the DEA model is that it advises how the unit evaluated should mend its behavior to reach efficiency. However, the main disadvantage of DEA method is that the frontier is sensitive to extreme observations and measurement errors.
The DEA model is designed to compare and evaluate the relative efficiency of a number of DMUs. Consider
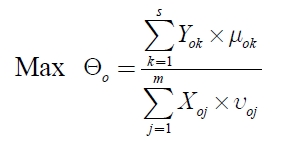
Fractional programming CCR model:
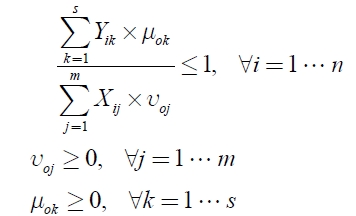
Subject to
Linear programming CCR model:
Subject to
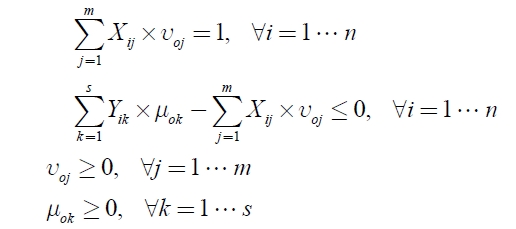
The above primal (multiplier) models are so-called input-oriented CCR models. The objective function presents the ratio of weighted sum of multiple outputs to weighted sum of multiple inputs. The constraint states that if the weights of a DMU are used for other DMUs, their efficiencies should not exceed 100%, in which
Input-oriented CCR model:
Min Θo
Subject to
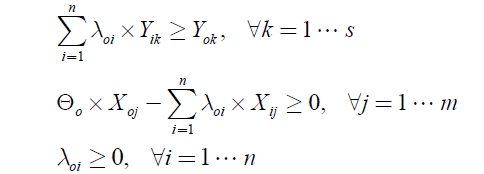
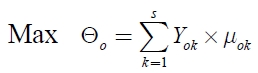
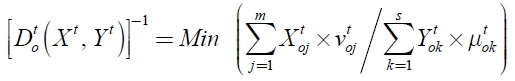
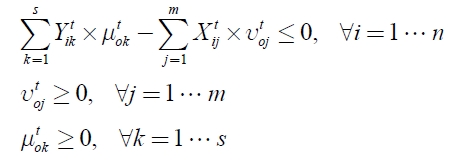
Output-oriented CCR model:
Max Θo
Subject to
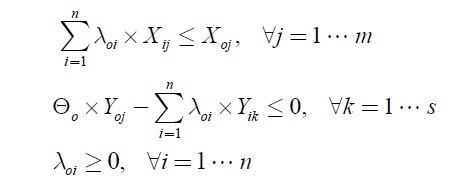
Both CCR models above yield the optimal solution Θ*, which is the efficiency score (so-called technical efficiency or CCR-efficiency) for the particular DMU
2.2 Efficiency and Productivity
In essence, efficiency and productivity are measured upon relationships between input and output. According to Haksever
Malmquist TFP index was first introduced by Caves
of inputs (
of outputs (
Fare


The subscript

is used to denote the output-oriented distance function. Note that
if and only if (
if and only if (


The distance function (4) measure the minimal proportional change in output required to make (
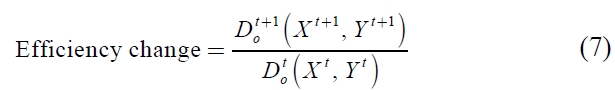
Malmquist TFP index captures two important sources of productivity changes, gains through efficiency change and technical change as follows:
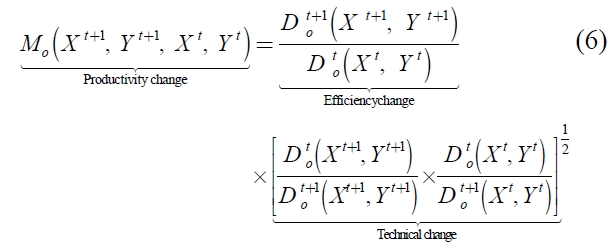
where the ratio outside the square brackets measures the change in the output-oriented measure of technical efficiency between periods
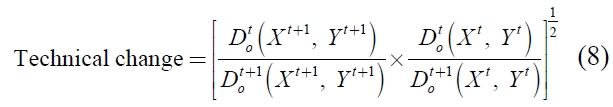
Following Fare
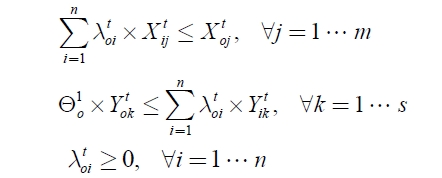
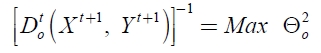
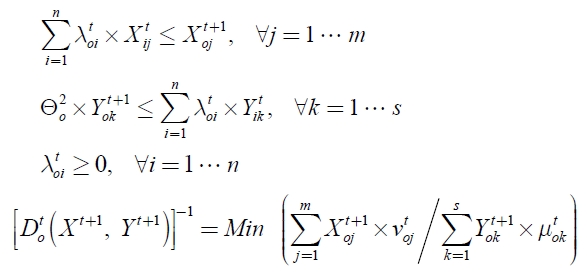
The dual (envelopment) model:

Subject to
The primal (multiplier) model:
Subject to
Where,
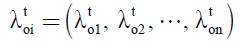
is a vector of weights. The primal model is used to estimate distance function of
For the mixed-period cases of
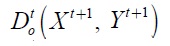
and
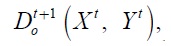
the distance function of
is computed by the following programming models.
Subject to
Subject to
Computing
and
are exactly the same as the above primal models, where
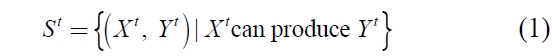
The allocation models are developed upon combining the primal CCR model (Charnes
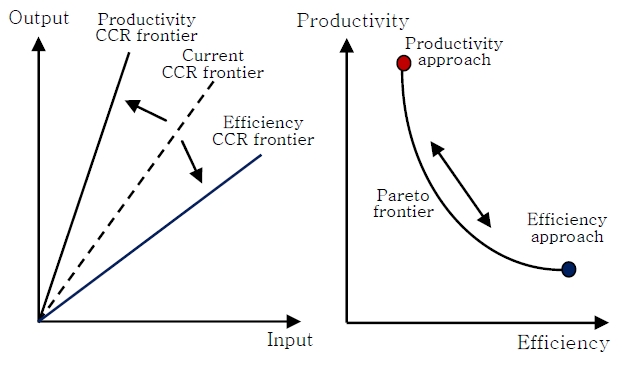
As mentioned earlier, changes in productivity involve both efficiency change and technical change. The distinction between technical change and efficiency change can be made by conceiving the customer as operating in an exogenously determined environment, called the technology, which is the set of all feasible combinations of input and output quantities at a given period (Balk, 2001). A customer which allocates resources on the boundary of this set is called technically efficient. Technical change then means that the set of feasible combinations expands or contracts as illustrated in Figure 1, while efficiency change means that the customer moves closer to or further away from the boundary.
3.1 Efficiency Allocation Model
The efficiency approach allocates customer resource (inputs and outputs) within given capacity so as to maximize efficiency change. In order to conduct a new allocation, constraints of capacity (total inputs-
Efficiency allocation model:
Subject to
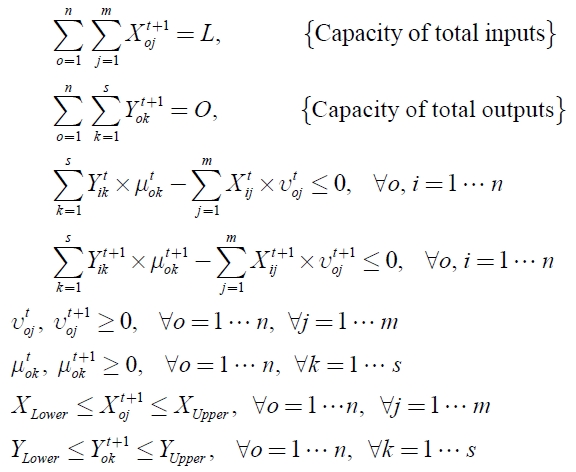
Where,
and
are current and new efficiency scores of customer
inputs

and outputs

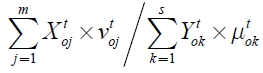
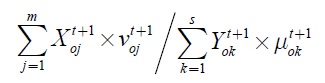
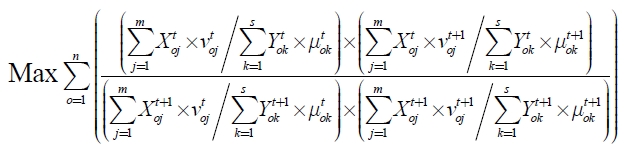
are variables (in range of lower bound and upper bound). The objective function is to maximize efficiency change. This function is formulated from Eq. (7) that represents the ratio of efficiency scores between periods of
3.2 Productivity Allocation Model
The Malmquist TFP index involves both efficiency change and technical change. The output-oriented CCR model is also employed to measure productivity change under the productivity approach as follows:
Productivity allocation model:
Subject to
Where, the objective function is to maximize the productivity change. This function is formulated from Eq. (6) that involves both the efficiency change and the productivity change.
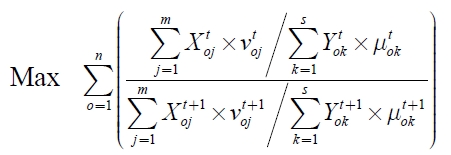
3.3 Multi-objective Allocation Model
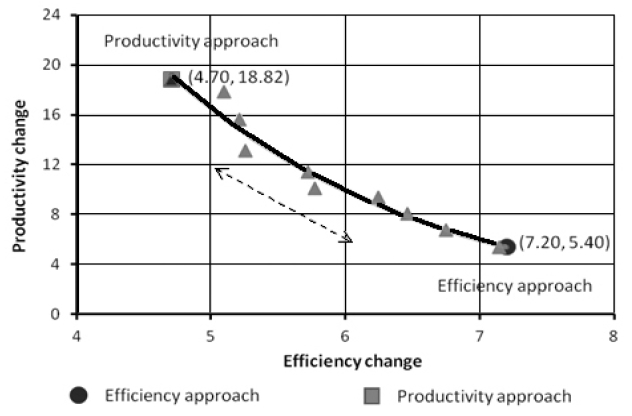
The question is whether a tradeoff exists between the efficiency approach and the productivity approach as in Figure 1. The existing tradeoff provides strategic insight on allocation policy in service delivery systems. Thus, the multi-objective allocation model is developed to conduct an objective tradeoff between the efficiency approach and the productivity approach.
Multi-objective allocation model:
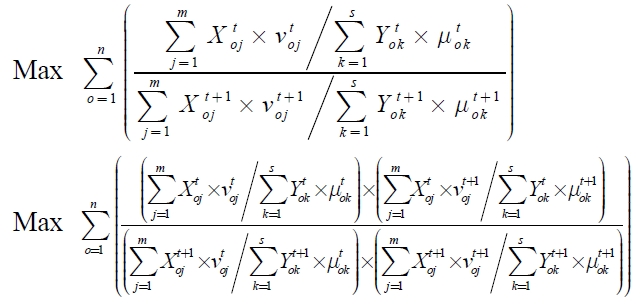
Subject to
The hypothetical service system under experiment has a single channel (
[Table 1.] The data of the system with the current allocation
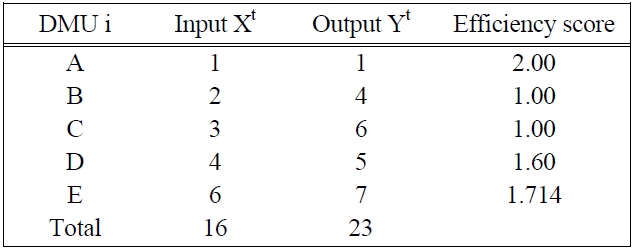
The data of the system with the current allocation
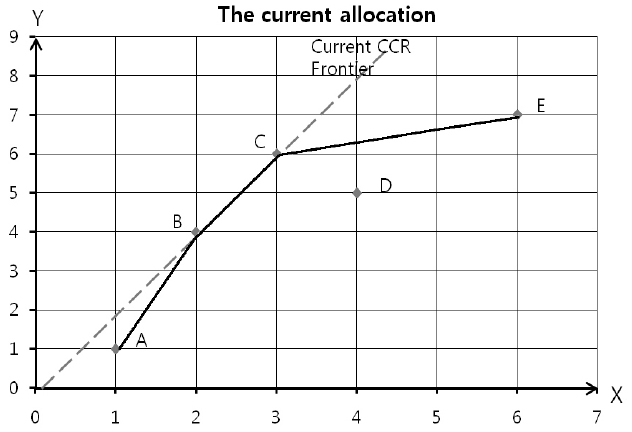
The output-oriented CCR model is used to measure scores of customer efficiency. Figure 2 illustrates a graph for the current allocation.
The objective of the experiment is to investigate allocation behaviors under the efficiency approach and the productivity approach, and conduct the objective tradeoff between the efficiency approach and the productivity approach. The experiment is designed for two main cases of the same capacity (total input of 16, and total output of 23) and the capacity change (total input of 18, and total output of 25). The experiment uses output-oriented CRR models to measure the efficiency change and the productivity change.
In order to identify objective tradeoffs (Pareto fronts) between the efficiency approach and the productivity approach, the experiment uses MOPSO algorithm from ET-Lib objective library for evolutionary techniques (Nguyen
Key parameters of MOPSO algorithm used in experiment are as follows:
Population size (number of particles) is 50 particles.
Personal/global/local/neighbor acceleration constants (cp/cg/cl/cn) are 1/1/1/1.
Number of iteration is 500.
The maximal/minimal inertia weights (wmax/wmin) are 0.9/0.4.
Movement strategy that is used to identify a set of non-dominated solutions (Pareto fronts) is “explore solution space with mixed population of particles” that takes advantages of different search strategies in the algorithm toward a high quality Pareto fronts (Nguyen and Kachitvichyanukul, 2010).
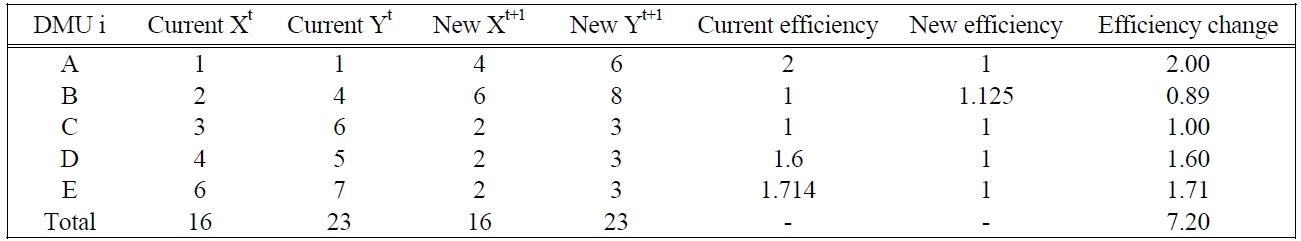
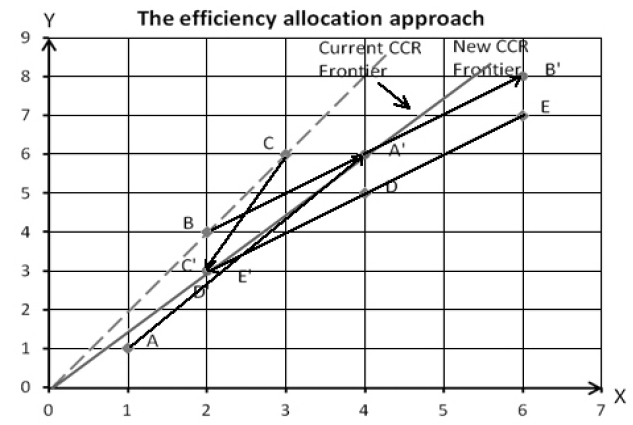
Table 2 presents the current and new allocations under the efficiency approach with the same capacity. The experiment result indicates that most of the customers (DMUs) allocate their resource (
Even the new allocation improves almost customer efficiency scores with the sum of efficiency change of 7.20, but technological progress is reduced as in Figure 3. Slope of CCR frontiers illustrates the technological progress for the system with single input and single output. The technical change from the current allocation to the new allocation is 0.75.
Table 3 presents the new allocation under the efficiency approach with the capacity change. The results are similar to the resource allocation with the same capacity. Most customer efficiency scores are increased, but technological progress is decreased. Customers B and C are efficient in the current allocation, but they are inefficient in the new allocation. The technical change of 0.75 may cause inefficiency (but not often) of customers B and C. It means that if there are no conditions in customer behavior (definition of lower bound and upper bound), then customers allocate their resource via improving the efficiency change rather than the technical change.
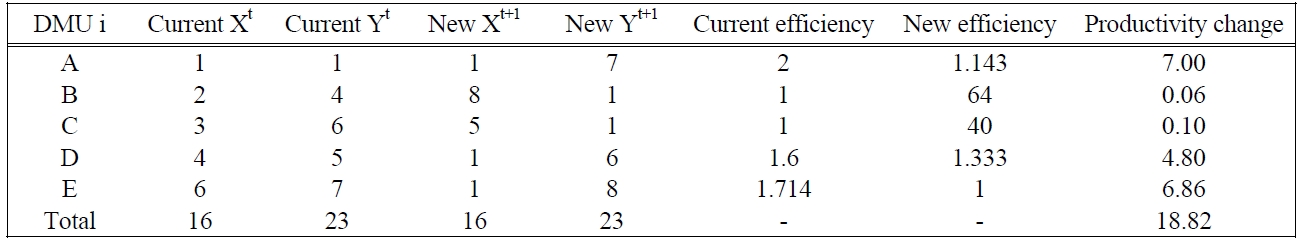
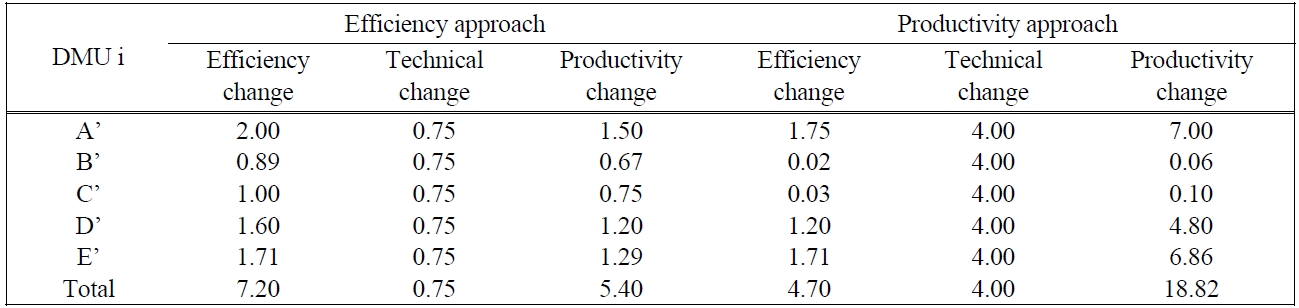
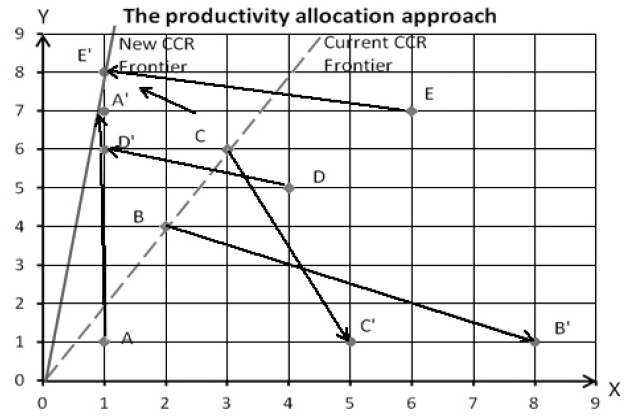
Table 4 presents the productivity approach for resource allocation with the same capacity. Since the objective function is to maximize productivity change, customer resource is allocated so as to maximize the productivity change if possible. The experiment indicates that the productivity approach improves technical change (4.00) rather than efficiency change (4.70) as in Table 6. In fact, the efficiency score of customers may be decreased in the new resource allocation. Only customers A, D, and E are more efficient with efficiency change of 1.75, 1.20, and 1.71, respectively, the remaining customers are worse in both efficiency score and efficiency change. It notes that customers B and C are efficient in the current allocation, but they are inefficient in the new allocation.
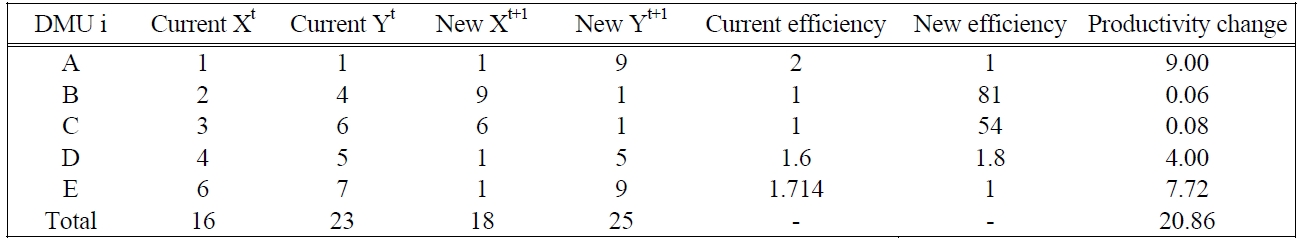
Figure 4 shows the productivity allocation approach with the same capacity. The increasing slope of new CCR frontier reveals that the technological progress (technical change) is improved. By observing the current allocation and the new allocation, it seems that allocation of customers B and C are improperly (fall in inefficient region). The efficient region is defined by lower and upper bounds where new allocation of X and Y are non-dominant or better than the current allocation.
Table 5 presents the new allocation with total input of 18 and total output of 25. The productivity change is 20.86 estimated by product of efficiency change (4.63) and technical change (4.50). Table 6 gives the comparison of two approaches in terms of efficiency change, technical change and productivity change. The efficiency approach allocates resource via maximizing efficiency change (7.20), while productivity approach allocates customer resource on the best way of productivity change (18.82). These changes provide firm about customer behavior as well as policy feedback. Further, it also determines useful boundaries for improving indi-
[Table 2.] Efficiency approach for resource allocation with the same capacity

Efficiency approach for resource allocation with the same capacity
[Table 3.] Efficiency approach for resource allocation with the capacity change
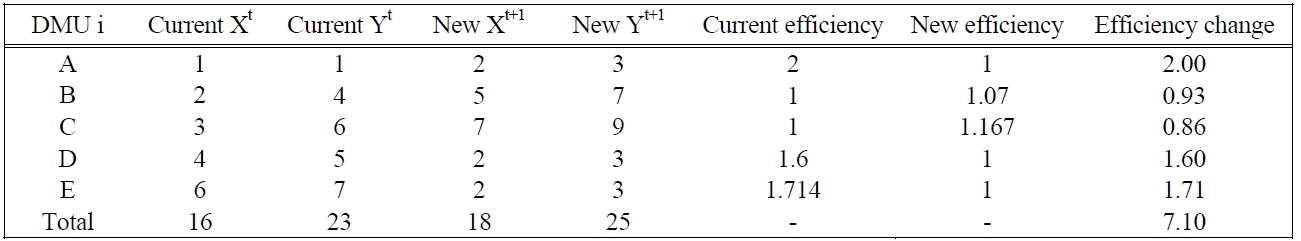
Efficiency approach for resource allocation with the capacity change
[Table 4.] Productivity approach for resource allocation with the same capacity

Productivity approach for resource allocation with the same capacity
[Table 5.] Productivity approach for resource allocation with the capacity change

Productivity approach for resource allocation with the capacity change
[Table 6.] Comparison of two approaches in the same capacity (16, 23)

Comparison of two approaches in the same capacity (16, 23)
vidual customer efficiency and firm productivity performance as a whole.
Figure 5 illustrates non-dominated feasible solutions that represent the objective tradeoff between the efficiency approach and the productivity approach, in which the efficiency approach and the productivity approach are two extreme solutions. Since there is an existing tradeoff between the efficiency approach and the productivity approach, it provides managerial indicators on allocation policy in service delivery systems.
The paper extends the DEA method with capacity constraints to measure efficiency and productivity as a planning tool. The output-oriented CCR models are developed for studying their behaviors in resource allocation under the efficiency approach and the productivity approach. The experimental result indicates that the efficiency approach intends to allocate resource by improving customer efficiency rather than firm productivity as in the productivity approach. Moreover, these allocation approaches are also extreme strategic allocation options, and there exists a tradeoff between customer efficiency and firm productivity. The study result contributes strategic insight on allocation policy in service delivery systems. The paper also gives some suggestions for future researches. First, the paper employs CCR models (constant returns to scale) instead of BCC models (variable returns to scale). Second, the hypothetical service system with single input and single output is proposed for the experimental study. Thus, future research should conduct scale efficiency and mixed effect in allocation models. Finally, it also recommends that variable boundaries should be defined to extend the reality of the allocation problem.