To gain competitive advantage in a fast changing environment, the higher education institution (HEI) must continuously adjust the strategies to that environment. One important strategy is how to determine appropriate practical actions based on what students really need and want. Despite the abundance of research on service quality management, there is no universal consensus on how best to determine appropriate practical actions in HEIs. The aim of this paper is to develop an integrated model to be used to accurately acquire the most critical service attributes and determine appropriate actions that promote student satisfaction. Drawing on relevant literature, an integrated model is proposed which is based on students’ perspective by integrating the fuzzy SERVQUAL, refined Kano, and Blue Ocean model. Subsequently, an empirical case study in the higher education sector is described that illustrates the value of the model in determining the most critical attributes and how to improve them.
In the age of growing service industries, providing excellent service quality is increasingly more important. Service quality and customer satisfaction have gradually been recognized as key factors used to gain a competitive advantage. While a multitude of factors may contribute to the decision process, the underlying factor that differentiates itself and taps into the direct experience of the consumer is service quality (Cronin and Taylor, 1992). The provision of excellent services is central to the competitive strategies of most industries, because providing high quality service is an important strategy for business survival and growth (Zeithaml
There are many challenges facing every educational institution as a service provider. As such, higher education would be considered a part of the service industry in providing quality learning experiences to students. With the proliferation of study options available to students, it is no wonder that the higher education institutions (HEIs) are under pressure to provide high quality service to students so as to capture the market share (Gapp and Fisher, 2006). Students will have the opportunity to base their continued enrollment with higher educational institutions on how well the education programs and services meet their expectations. Hence, service quality becomes the means for many institutions to retain the number of students and to capture the educational market (Yeo, 2008; Brochado, 2009).
The role of service quality in higher education has received increasing attention. Universities have seen the provision of higher education that becomes a product and have been driven by competition to examine the quality of their services, to redefine their product and to measure customer satisfaction in ways that are familiar to service marketing specialists (Kotler and Fox, 1985). Higher education is also being driven towards commercial competition imposed by economic forces resulting from the development of global education markets (Joseph
In competitive markets, satisfaction with services may make the difference (Zeithaml
The subject of determining critical attributes and appropriate service strategies is emphasized by several studies. More recently, several researchers have explored the subjects by varying perspectives and using different methodologies. The SERVQUAL has been used to determine critical attributes of various services, and the improvement actions are derived based on a gap score of expectation and perception (Parasuraman
The method based on fuzzy numbers makes linguistic terms more objective, and it is different from general research using statistical methods in service quality research. To investigate the population, the respondent’s opinions or the complexity of a subjective event more accurately, it is suggested that we had better use the fuzzy logic (Benitez
Furthermore, Kano’s method is a powerful way to classify categories of quality attributes as customer requirements and is widely used by industries and researchers (Kano
Most strategy formulation techniques and practices focus on eliciting requirements from existing, known customers. However, these techniques and practices aren’t sufficient for surviving in current highly competitive markets. The blue ocean strategy (BOS) is used to create a new marketplace value and so make competition irrelevant (Kim and Mauborgne, 2005). A “blue ocean” is a potential market where competition does not yet exist. In contrast, a “red ocean” is a bloody market where companies compete intensely for a share of a limited market space. BOS seeks to remedy this by not only decoding the pattern and principles behind the successful creation of blue oceans, but also by providing the analytical frameworks and tools to act on this insight.
Starting with an integrative framework, the paper outlines the results of a study conducted on higher education to determine the critical service attributes and their appropriate practical actions. For determining the critical service attributes accurately, it is necessary to develop the fuzzy SERVQUAL questionnaires. Here, we induce general solutions to find that the intersections are between two triangular fuzzy numbers, so the discrepancy rate between satisfaction degree (perception and expectation) and importance degree can be evaluated and integrated with a refined Kano model. Finally, four actions framework of the BOS model is applied to determine appropriate improvement actions based on the categories of attributes identified in the refined Kano model.
This section aims to identify the theoretical composition that is considered as the objective of this study. Before the development of the integrated model, we first explain the critical methods, which are the essentials of the integrated model.
The SERVQUAL method developed by Parasuraman

When service quality is mentioned, the dimensions (reliability, responsiveness, competence, access, courtesy, communication, credibility, security, understanding, and knowing the customer as well as tangibles) proposed by Parasuraman
1. Tangibles: appearance of physical facilities, equipment, personnel, and communication materials
2. Reliability: ability to perform the promised service dependably and accurately
3. Responsiveness: willingness to help customers and provide prompt service
4. Assurance: knowledge and courtesy of service providers and their ability to convey trust and confidence
5. Empathy: care and individualized attention to its customers provided by the firm
The fuzzy approach theory was the first break-through by an automation professor Zadeh (1965) of the University of California in Berkeley. He used mathematical methodology to present the uncertainty in real life. For instance, in linguistic terms, such as satisfied, fair, and dissatisfied, are usually regarded as natural representations of the customers’ preferences or assessment, and more or less represent some degree of uncertainty and vagueness in human thought. This problem will be answered by the use of fuzzy approach in capturing the decision makers’ preference structure. The fuzzy approach aids in reducing the ambiguity of concepts that are associated with human beings’ subjective judgments (Benitez
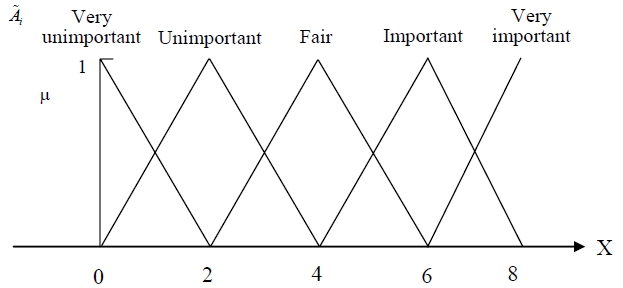
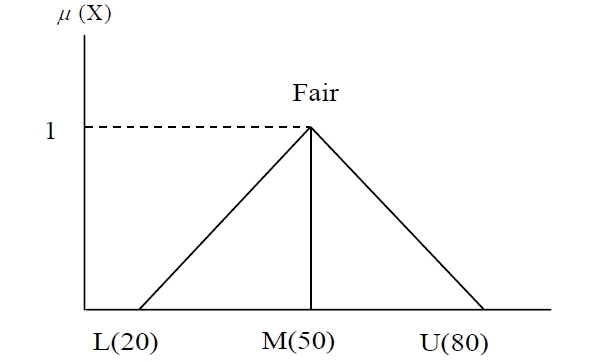
A linguistic variable is a variable with linguistic words or sentences in a natural language. The performance can be treated as a linguistic variable defined in the closed interval (Zadeh, 1965). For example, the expression “a service quality importance degree” represents a linguistic variable in the context of this study. It means the importance of a service quality that students experience during their studies at the university. The possible values for this variable could be: “very unimportant”, “unimportant”, “fair”, “important”, and “very important.” For instance, in the value such as “fair”, the membership functions of the expression values can be indicated by triangular fuzzy numbers μA(X) = (lower value; medium value; upper value) within the scale range of [0-100], the evaluators can subjectively assume their personal range of the linguistic variable μA(fair) = (20; 50; 80), which are shown in Figure 1. Compared with the traditional approach, the importance degree for the service attribute used n-points of the Likert scale and applied triangular fuzzy numbers to utilize linguistic variables (Benitez
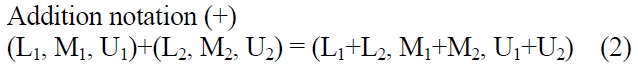
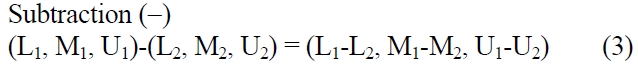
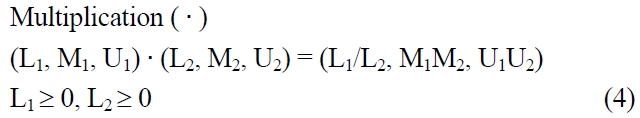
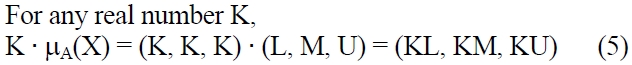
According to Zadeh (1965), there were some algebraic operations of the triangular fuzzy number.
2.3 Kano and Refined Kano Model
In the quality management area, many methods are available for investigating and assessing the service quality performance of the service providers. The Kano model has been mostly applied within the quality management area. Kano
1. Attractive: attributes that give satisfaction if present, but that result in no dissatisfaction if absent;
2. One-dimensional: attributes characterized by a linear relationship between the customers’ perception of satisfaction and the degree of fulfillment of the attributes;
3. Must-be: attributes whose absence will result in customer dissatisfaction, but whose presence does not significantly contribute to the customer satisfaction;
4. Indifferent: attributes that result in neither satisfaction nor dissatisfaction, regardless of being fulfilled or not;
5. Reverse: attributes that result in dissatisfaction when fulfilled and in satisfaction when not fulfilled.
The Kano model has many applications. It has the advantages in classifying customer needs (Yang, 1993, 2005). However, trade-offs are sometimes necessary. If some service attributes cannot be met simultaneously for
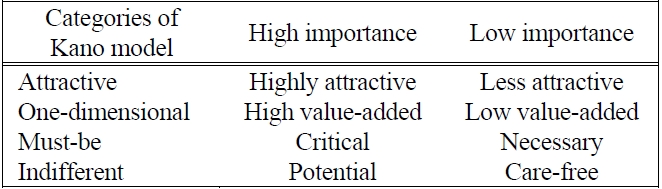
technical or financial reasons, the service providers should consider other criteria that have the greatest influence on customer satisfaction. To solve this problem, Yang (2005) proposed a refined Kano model by considering the degree of importance of the attributes as a perceived quality by customers. The degrees of importance were classified into two categories. If the degree of importance of an attribute was greater than the mean of the importance degree for all service quality attributes, that attribute has ‘high’ importance degree. It has ‘low’ importance degree if below the mean.
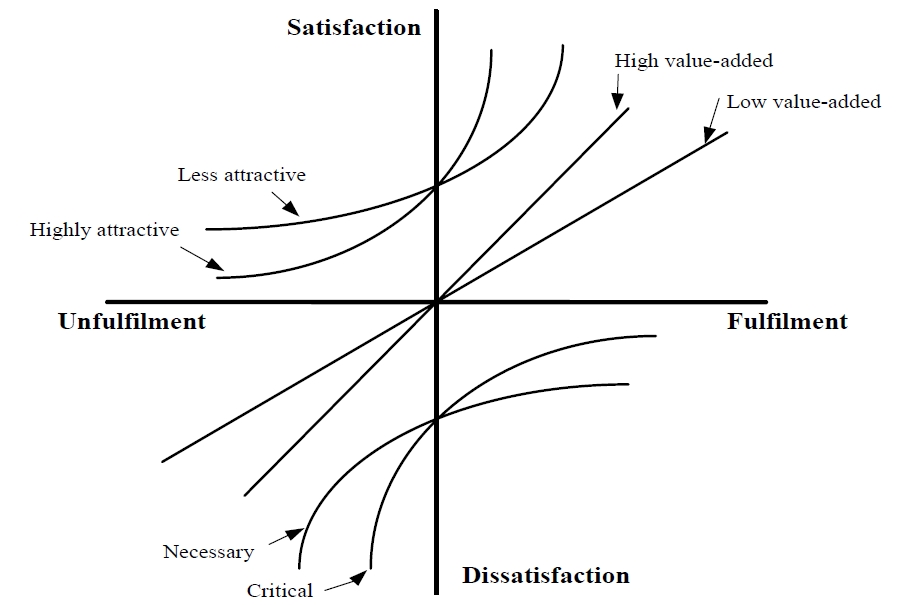
By adding the degree of importance, this refined model can help service providers in precisely evaluating the influences of various service quality attributes. The model effectively subdivided each of Kano’s first four main categories-thus making a total of eight categories from the original four. In addition, the existence of a ninth category, Kano’s category of ‘reverse’ attributes should also be noted. The redefinition of the categories of quality attributes according to the refined model allows service providers to make quality decisions with more precision (Yang, 2005). Table 1 lists the redefined categories of quality attributes obtained by refining the Kano model. Yang (2005) represented these quality attributes as illustrated in Figure 2.
[Table 1.] Categories of quality attributes in refined Kano model

Categories of quality attributes in refined Kano model
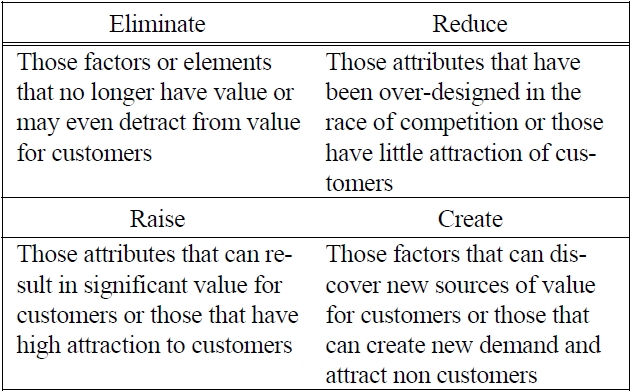
Kim and Mauborgne (2005) have proposed the “blue ocean” approach, which emphasizes avoiding competition while creating value innovation that drives down costs and simultaneously driving up value for buyers. What BOS seeks to do is to make the creation and capturing of blue oceans as systematic and actionable as competing in the red waters of known market space. Kim and Mauborgne (2005) believed that customers make purchase decisions based on the offering's attributes, such as quality, availability, and price. They advise that managers discover blue oceans by experimenting with and developing innovative bundles of attributes which break the accepted cost-differentiation trade-off (Sheehan and Vaidyanathan, 2009). Kim and Mauborgne (2005) put forward “the eliminate-reduce-raise-create (ERRC) grid” to help managers conceive and design new bundles of attributes. The ERRC practical actions reconstruct customer value perceptions by answering four aspects of the grid (Table 2).
The four aspects of the grid can be briefly summarized as follows (Yang and Yang, 2011):
1. Eliminate: to reduce costs, any factors or elements that no longer have value for customers (or might even detract from value for customers) can be eliminated;
2. Reduce: any attributes of products or services that have been over-designed in an attempt to match and beat the competition, or attributes that have little attraction to customers, and which are therefore increasing their cost structure for no gain, should be reduced;
3. Raise: attributes that can result in significant value for customers, or those that have high attraction to customers, should be assessed with a view to raising their fulfillment;
4. Create: factors that can produce entirely new sources of value for customers, or factors that can create new demand and attract non-customers, should be created.
The ERRC grid
3. THE DEVELOPMENT OF AN INTEGRATED MODEL
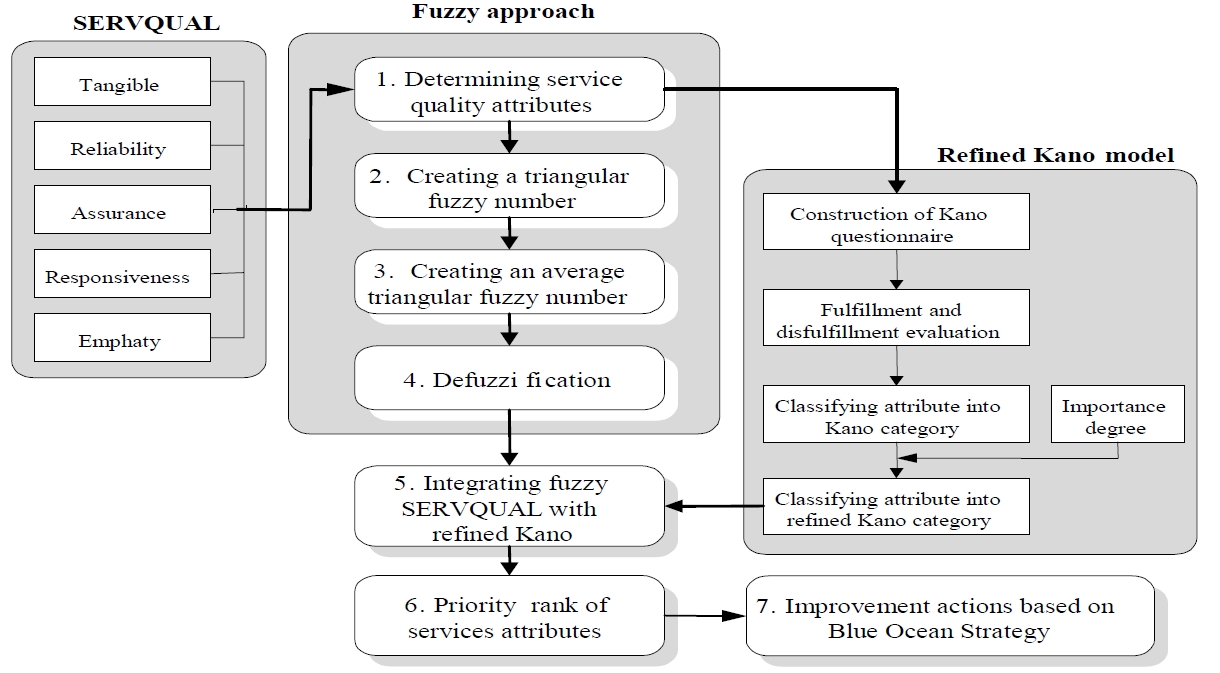
In this part, we will propose an integrated model of determining the critical attributes and their appropriate actions. To address these challenges, an integrated model framework is created to provide a traceable flow-down from the identification of service attributes to the appropriate practical actions. A basic taxonomy of this methodology is created based on the fuzzy approach steps. Subsequently, the SERVQUAL, refined Kano and blue ocean model are integrated into a hierarchical model to allow the validity of the result. A structure with seven basic steps will be proposed for determining the priority of the critical service attributes and their appropriate actions. Figure 3 provides the integrated model in conducting this study.
4.1 Sampling and Data Collection
The survey for the higher education area covered the quality of various services offered for students as the primary customers. In this research, one of Indonesia’s well-established private universities in Jakarta will be used for further discussion in order to illustrate the implementation of the integrated model. This empirical study analyzed the critical students’ expectations of service quality at a higher education institution. Questionnaires were designed according to the SERVQUAL model of measuring service expectation (Parasuraman
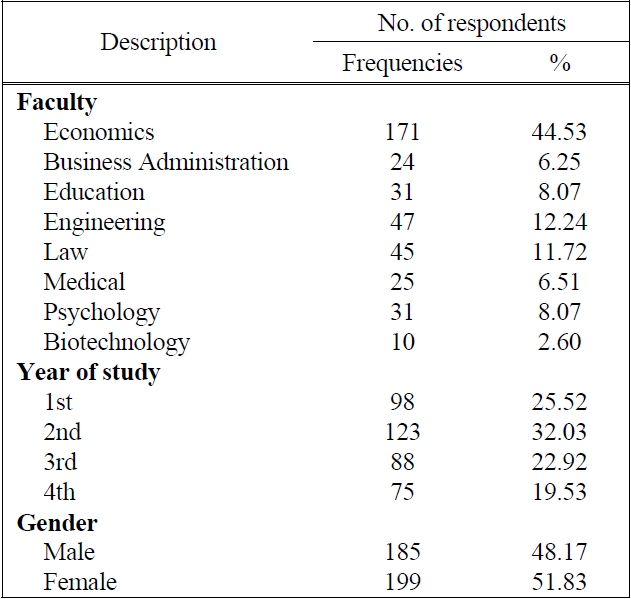
[Table 3.] Student respondent profile (n = 384)

Student respondent profile (n = 384)
A pilot study of a sample size of 50 was conducted at a university environment to ensure the user-friendliness of the designed questionnaires. All the students responding to the questionnaires commented on its readability and ease of understanding. As a result, no amendment in terms of rewording of items was made. Service quality surveys were conducted in the academic year 2008/2009 with all-year undergraduate students. Students were given verbal and written instructions, and completed the questionnaires. Of the 400 students surveyed for this study, 384 returned usable questionnaires giving a response rate of 96%. This was considered an adequate sample size, since other scale developers in the marketing area had used a sample size of 200 to analyze group data (Parasuraman
There was a sample of 384 undergraduate students of a private university, comprised of 48.17% male and 51.83% female respondents (Table 3). Within the sample, 25.52% of the students were in their first year, 32.03% in their second year, 22.92% in their third year, and 19.53% in their final year. Most of the students (44.53%) were undergraduate students of the Economics Faculty.
To deeply understand the integrated model, this research provides some systematic steps of the integration model of fuzzy SERVQUAL and the refined Kano model. This section will illustrate and analyze each individual step in what follows:
4.2.1 Determining service quality attributes
First, a total of 30 students were randomly interviewed. The students were asked to think of learning experiences in the university (positive and negative critical incidents) and to indicate the relevant attributes of the higher education institution to increase the student satisfaction owing to the service expected and received. At the same time, the nominal group technique was used to conduct a panel discussion. The participants of the discussion included university stakeholders such as students, lecturers, administration staffs, parents, and university’s leader representatives. The interview and discussion material were derived from five SERVQUAL dimensions of the Parasuraman
[Table 4.] Five SERVQUAL dimensions and 29 service attributes
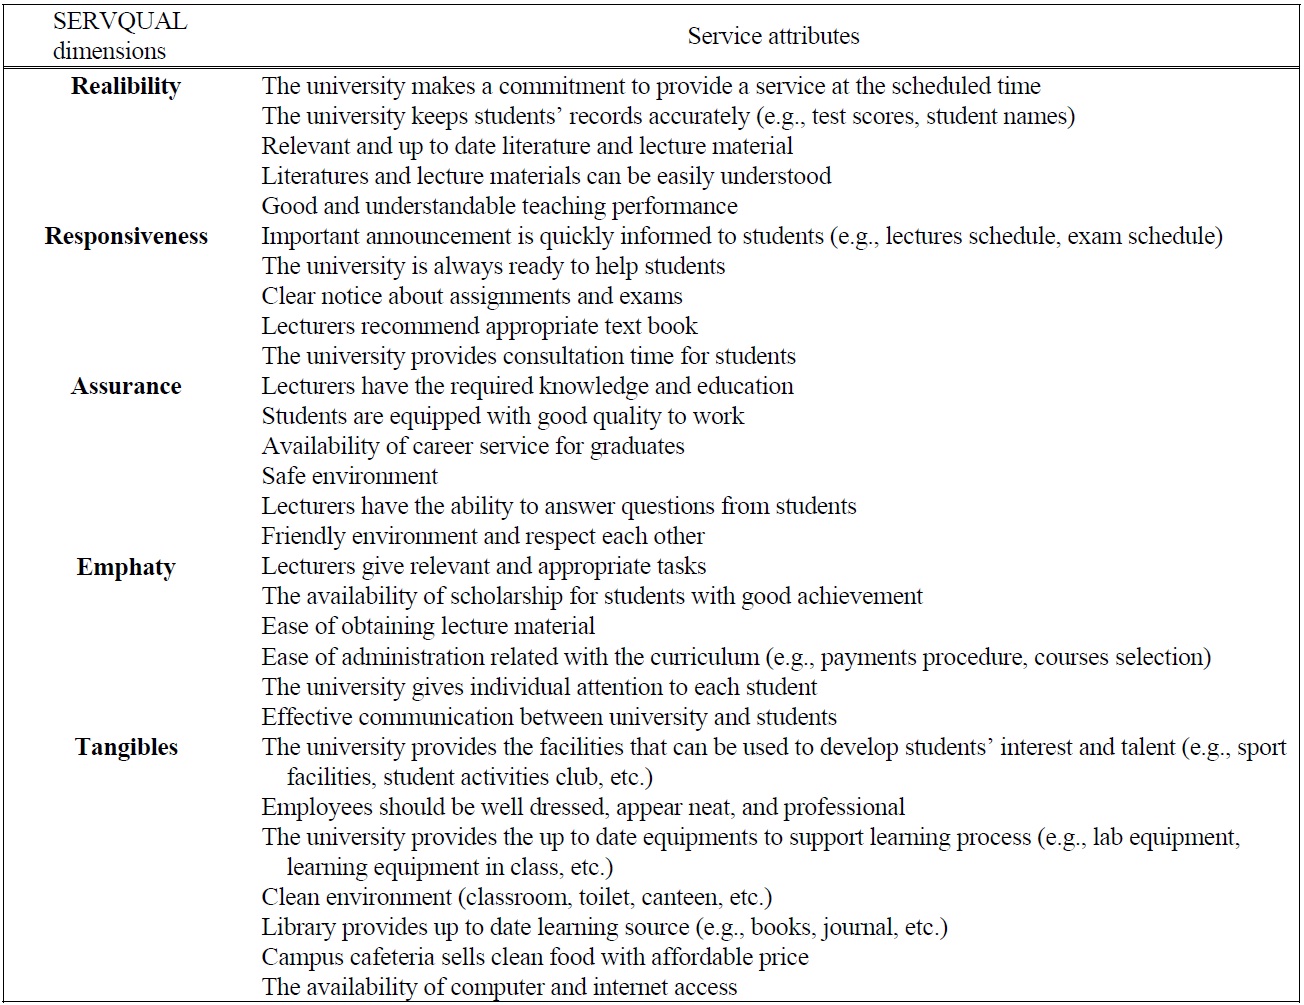
Five SERVQUAL dimensions and 29 service attributes
4.2.2 Creating a triangular fuzzy number for student’s importance, perception, and expectation term
The questionnaire of service quality evaluation is mainly composed of 29 questions for evaluating the HEI’s performance corresponding to each attribute. Generally, surveys examining importance degree, student perceptions and expectation of service quality have used questionnaires in which respondents indicate their feelings with reference to selected linguistic terms. But human judgments of events may vary significantly according to the subjective perceptions or personality of individuals. This study used a triangular fuzzy number to represent the linguistic term of importance degree, student’s perception and expectation or service quality.
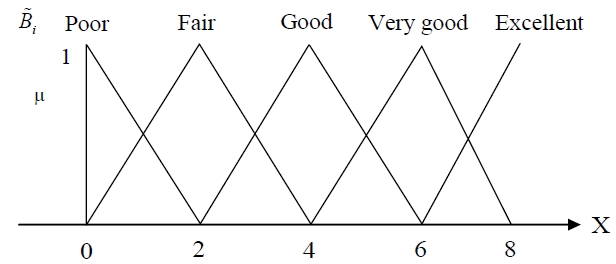
Moreover, we used the membership function associated with each linguistic expression term, according to the representative triangular fuzzy numbers. We asked students to specify the experimented quality of the service of each service attribute with linguistic expression. The linguistic terms from which students chose to indicate their perception and expectation towards service are: poor, fair, good, very good, excellent and very unimportant, unimportant, fair, important, very important for indicating importance degree. In the survey questionnaire of this study, students were asked to complete the question about the range of each linguistic term based on their own subjective decision. For example, one respondent gave triplets (0, 0, 2), (0, 2, 4), (2, 4, 6), (4, 6, 8), and (6, 8, 8) meaning very unimportant/poor, unimportant/fair, fair/good, important/ very good, and very important/excellent, respectively (Figures 4 and 5). These scores are later aggregated to calculate the average importance, perception, and expectation as a new triangular fuzzy number for each attribute.
[Tabel 5.] Service attributes of higher education institution

Service attributes of higher education institution
4.2.3 Creating an average triangular fuzzy number from n triangular fuzzy numbers
Linguistic terms, importance degree and satisfaction degree (perception and expectation) are often vague. To provide more objective student assessment for a higher education institution, after we created a triangular fuzzy number for the importance degree, perception, and expectation as triangular fuzzy numbers individually, we apply Eq. (6) for importance term and Eq. (7) for perception and expectation terms in order to aggregate student opinions.
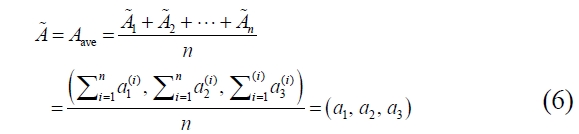
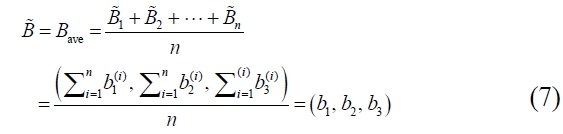
Aave in Eq. (6) and Bave in Eq. (7) denote the average fuzzy number of n triangular numbers.
Table 6 lists the average fuzzy numbers of importance, perception, expectation measure for a survey done in a private university in Jakarta, Indonesia.
4.2.4 Defuzzification
After obtaining the importance, perception, and expectation measure in terms of fuzzy numbers, we need to
[Table 6.] Average triangular fuzzy numbers of importance, perception, and expectation measure
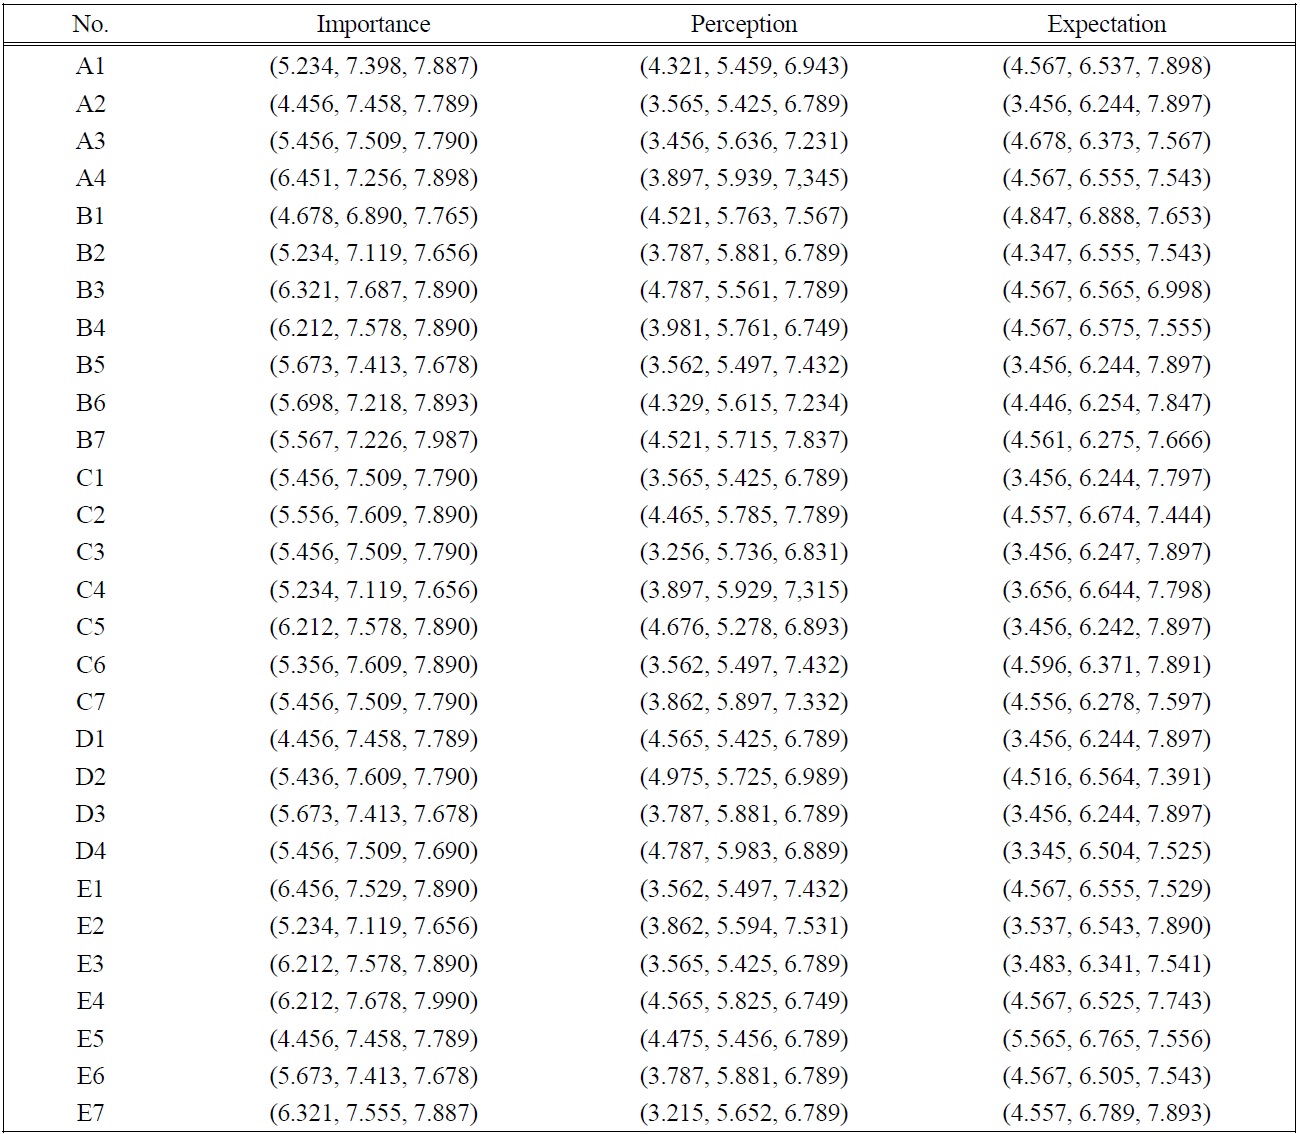
Average triangular fuzzy numbers of importance, perception, and expectation measure
defuzzify the fuzzy numbers into crisp numbers. We used a common method to defuzzify the fuzzy numbers. Table 7 shows the defuzzied importance, perception, and expectation values of each service attribute for the surveys.
4.2.5 Integrating fuzzy SERVQUAL result with refined Kano model
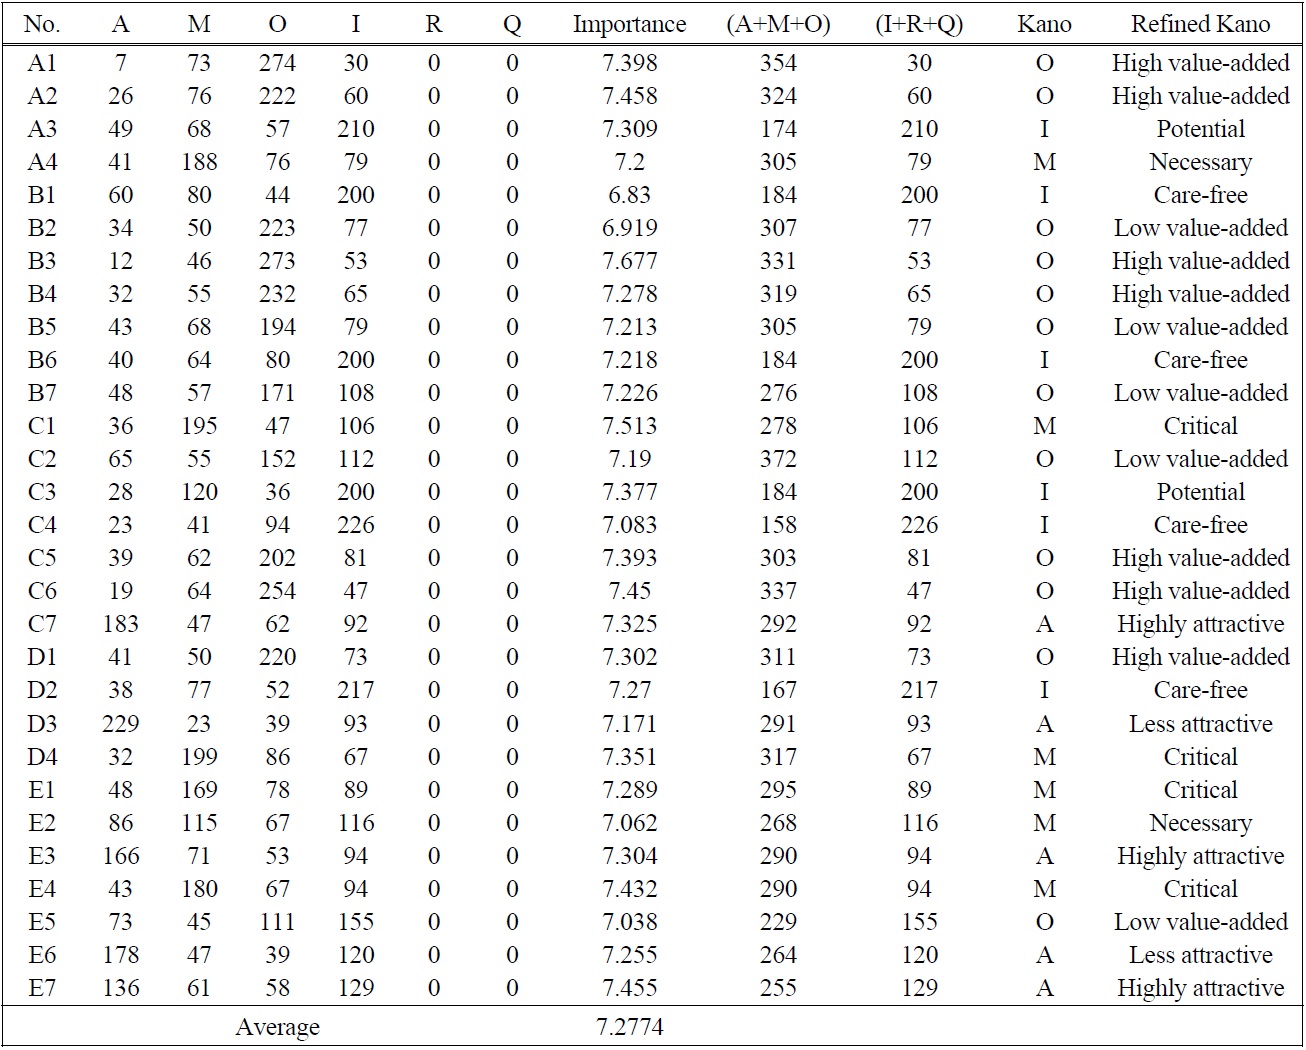
The attributes are evaluated using the three steps of evaluation from the Kano model. After having combined the answers to fulfillment-disfulfillment questions and importance degree, the results of the service attributes are listed in the table of results which shows the overall distribution of the Kano categories and the refined Kano categories (Table 8).
4.2.6 Determining the rank order of critical services attributes
The next step is to determine the rank order of the critical attributes and interpret the result. By combining the
[Table 7.] Overall importance, perception, and expectation measures
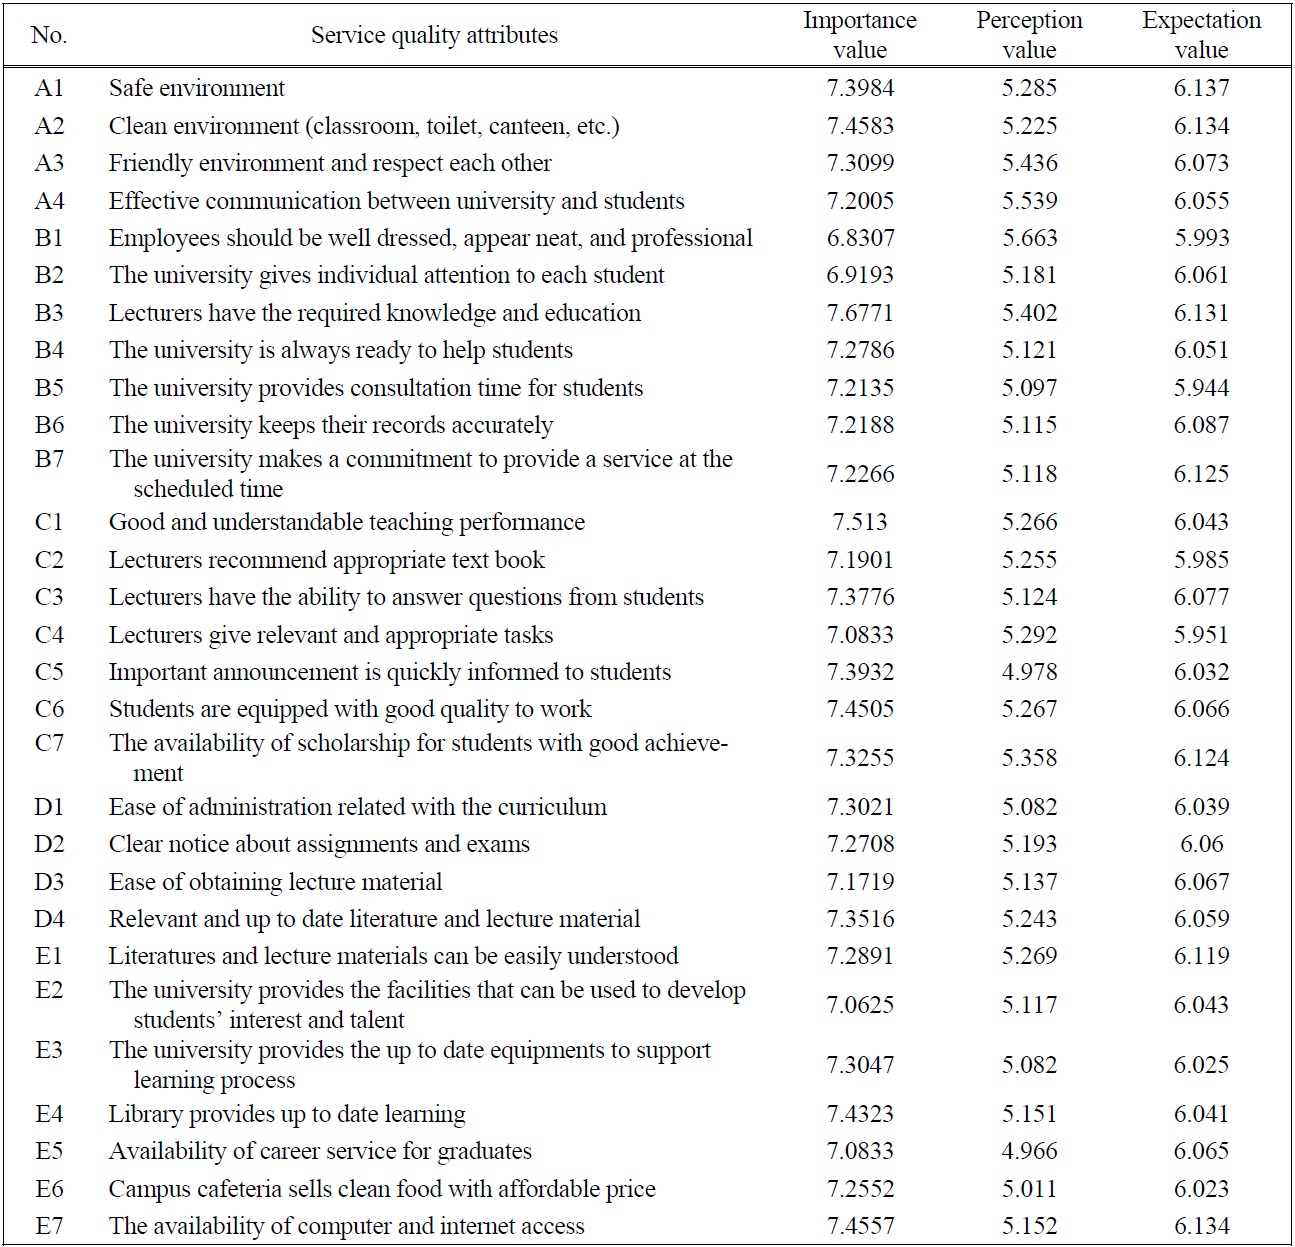
Overall importance, perception, and expectation measures
category from Table 8 and gap score from perception and expectation value, the rank order of the critical level of service attributes can be determined as shown in Table 9.
4.2.7 Determining appropriate improvement actions based on blue ocean strategy
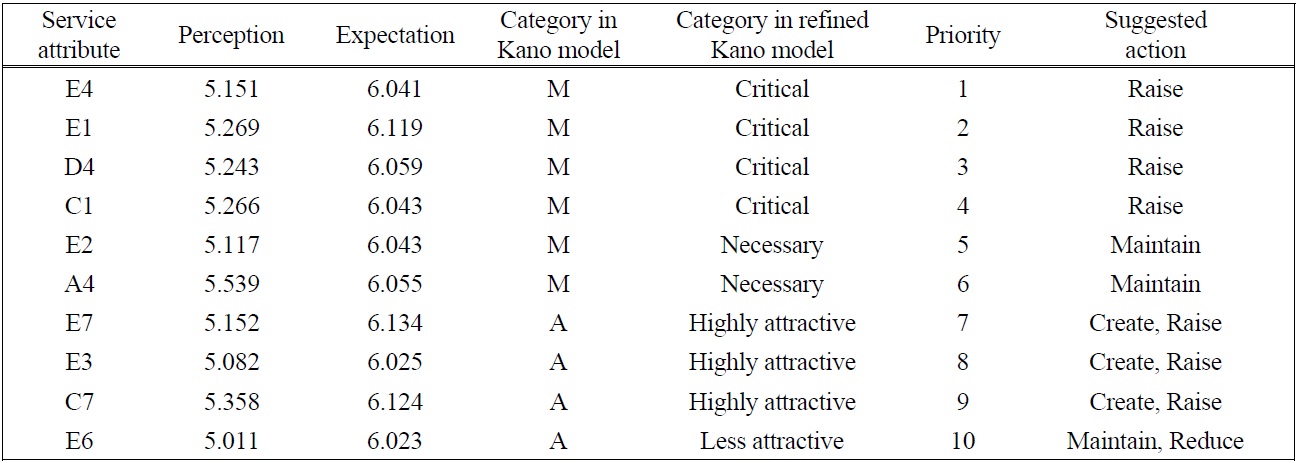
The last step is to choose the 10 most critical service attributes based on the priority rank and to determine their appropriate practical actions using the four-action framework of BOS (Table 10).
Service quality in education has evolved and taken varying forms all over the world in terms of customer satisfaction and issues of assessment. The focus of this study is essentially on understanding the students’ requirements with the ultimate objective of delighting the students as primary customers. A study was conducted on student’s perspectives as primary customers of the educational system. The satisfaction of students would always be a precondition to customer orientation and satisfaction of the primary customer. Thus, this paper restricts itself to the findings obtained from the students as primary customer of the educational system. The ultimate objective was to identify such design service characteristics that would meet their requirements as customers and lead to satisfaction. Through integration of the fuzzy SERVQUAL, refined Kano, and blue ocean strategy, the critical service
[Table 8.] The overall distribution of the Kano and refined Kano categories

The overall distribution of the Kano and refined Kano categories
attributes and the improvement actions that would meet the requirements of the students were affirmed qualitatively and quantitatively. Against this backdrop, it becomes imperative that a theoretical and conceptual framework is laid out and an integrated model proposed.
For the purpose of this study, 5 higher education aspects and 29 attributes are developed by reviewing previous studies as well as collecting expert opinions. These service quality criteria could lead to satisfaction and dissatisfaction. Through questionnaires, each student can be asked to give the following data: 1) a triangular fuzzy number corresponding to each of the linguistic values (e.g., poor, fair, good, very good, and excellent), 2) a category of each quality attribute as improvement priority. The category classification for each attribute is represented by the refined Kano model.
This study suggests that the strategies to satisfying the students’ needs of a private university in Jakarta, Indonesia can be determined. The strategies can be made based on the students’ preferences. One of the important strategies in the university’s success is how to prioritize the appropriate actions. From the perspective of students, the service quality improvement priority is determined based on the SERVQUAL gap score and the refined Kano model result. The appropriate action for each attribute is determined based on the blue ocean strategy.
In accordance with the result, the university has to develop the core competence required to raise the fulfillment level of the ‘critical’ attributes-for example, up-to-date learning of the library (E4), literatures and lecture materials that can be easily understood (E1), relevant and up to date literature and lecture material (D4), and good and understandable teaching performance (C1). Moreover, to delight the students’ needs, the university also should create ‘high attractive’ attributes in the availability of the computer and internet access (E7), the up-to-date equipments to the support learning processes (E3), and the availability of scholarship for students with good achievement (C7). In addition, the following attributes should be noted:
[Table 9.] The rank order of critical level of service attributes
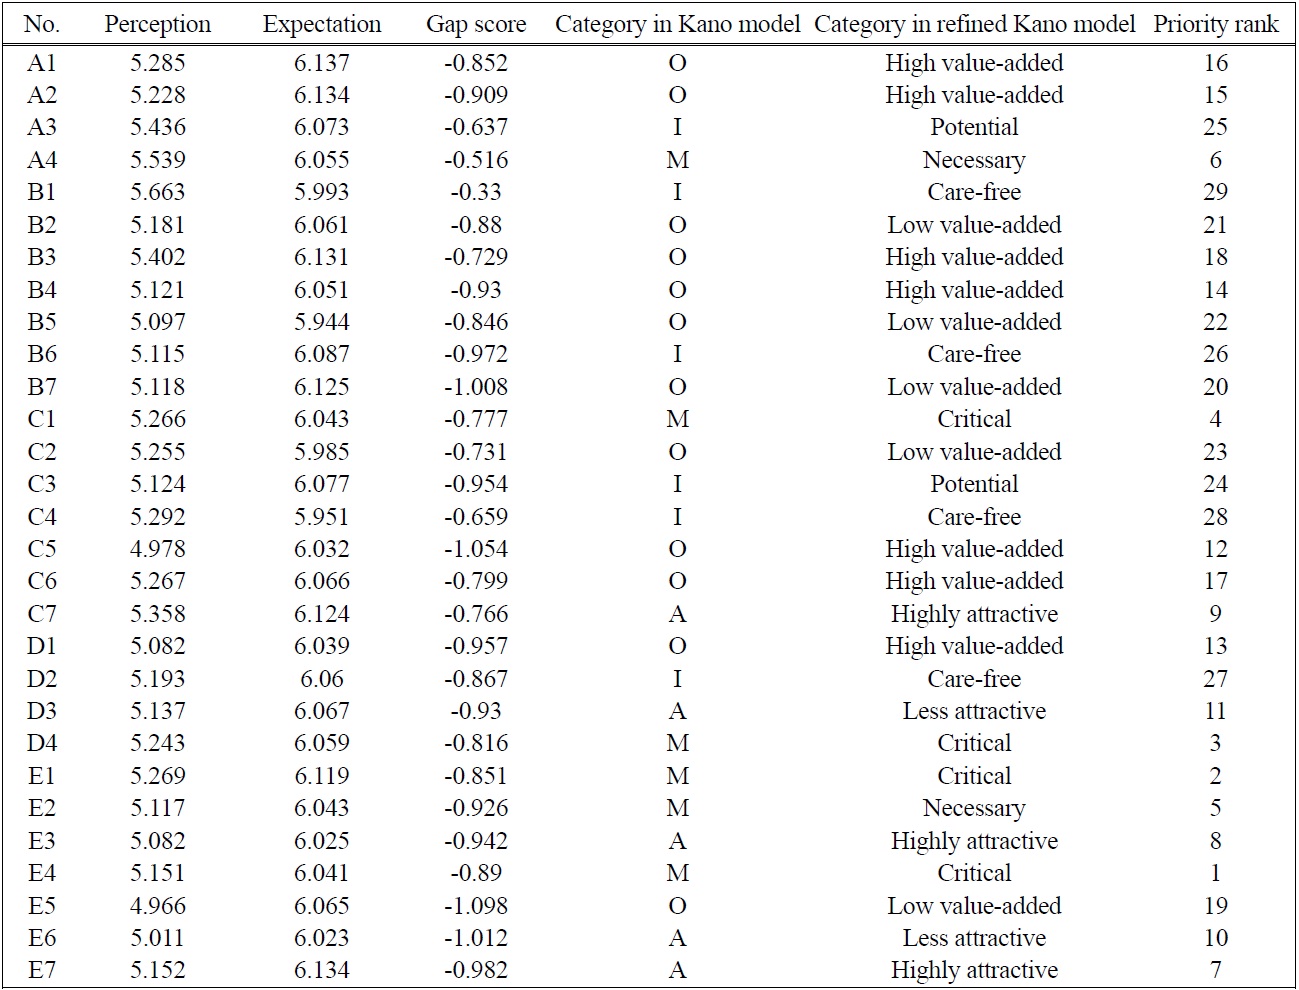
The rank order of critical level of service attributes
[Table 10.] The 10 most critical service attributes and their appropriate actions
The 10 most critical service attributes and their appropriate actions
1. The university should maintain the facilities that can be used to develop students’ interest and talent (E2) (as a ‘necessary’ attribute);
2. The university should maintain an effective communication between the university and the students (A4) (as a ‘necessary’ attribute);
3. The campus cafeteria sells clean food with affordable price (E6) as a ‘less attractive’ attribute. The university should maintain or reduce the price to delight the students.
Service quality is vital and it has been realized that higher education institutions need to focus on customer centric philosophies. The concept of service quality goes beyond the technical aspects of providing the service; it includes human perception of what the services should be and how the services are to be conveyed. Several mechanisms have been adopted to assess and regularly review the quality of all aspects of education’s services and suggest frameworks for service quality in education. Student satisfaction is a major driver towards adoption of a customer orientation by any organization and the higher education institution is no exception. Commensurate to this, an attempt has been made to focus on the needs of the students as primary customers and propose a framework that would help fulfill their requirements leading to satisfaction and thereby, critical service attributes and appropriate actions through student perspectives.
In order to strengthen competitiveness, a higher education institution should pay more attention to improve the most critical priority of service attributes. Thus, this paper employs an integrated model of fuzzy SERVQUAL and the refined Kano model to represent uncertain performances of the overall evaluation of the service attributes. This paper also sets out to critically improve the quality of offered critical services. In order to determine the appropriate improvements, a four actions framework of the blue ocean model is applied. The integrated model in this study reflects the student perspectives of service quality relevant to higher education.
The encountered restrictions limited the study to undergraduate programs only, thus providing no comprehensive or objective evaluations of the university’s service quality overall. While this model is limited to one university and therefore not generalisable, this paper still contributes to the higher education quality management. The model generated through its application suggests that there is evidence of good practices in service quality management within the higher education sector. The evaluation does provide a university with some indicative information about its performance on its service operations. With its simplicity in concept and computation, this integrated model is of practical use for the university decision maker in identifying the priority of service attributes and determining their appropriate actions involving subjective assessments of service attributes.
The authors recommend that future research into the area of student service quality evaluation framework include other additional quantitative analysis to verify and ascertain the validity of the findings. It is argued that there is also a potential for the model developed within this paper to be applied across a broader sample of higher education institutions, both state and private universities and also within Indonesia and internationally.