Great changes in recent years in environments that surround production sites have created a need for associated changes in the production-site information system. Environmental changes require industries to design and develop information systems that center on production lines (Kanazawa, 1989). However, despite advances in
information technology (IT), the design and development of systems that keep pace with the changes has been problematic. One of the reasons is the division of roles between users who oversee actual site operations and system engineers (SEs) who design and develop information systems. The users at the production site can easily understand the actual operations, but have less understanding of the related information systems. Conversely, SEs are experts at information systems, but may have a limited understanding of the operations performed at the site. What is needed, therefore, are SEs who are able to understand and analyze the operations for which the information system is being designed and developed.
There is, however, a limited talent pool of persons with the core knowledge to handle both roles. There are corporate training programs that involve short-term onsite experience, especially for new employees, but such programs are rarely directly tied to information system design and development. Education at a university that supplies personnel to corporations is also a source of the mismatch with the information education required in an information-based society (Tozawa, 2009). Examination of curricula at universities today shows that the emphasis in IT education in the department of science and engineering is placed on skills such as programming and information system architecture. In the social sciences curriculum for students studying in the department of business administration, on the other hand, the emphasis tends to be on practical knowledge required for business management. If companies are to develop a training program for personnel with basic skills, therefore, there is a need for a program that teaches personnel to understand the particulars of an operation, and apply that knowledge to an information system.
Previous researches have largely focused on either the acquisition and training of actual operational skills (Karwan
This research, therefore, develops a fundamental skills training program that enables learners to understand the process of extraction of the system requirements from actual operations and understand both the physical and information flow in actual operations. A previous research (Shida
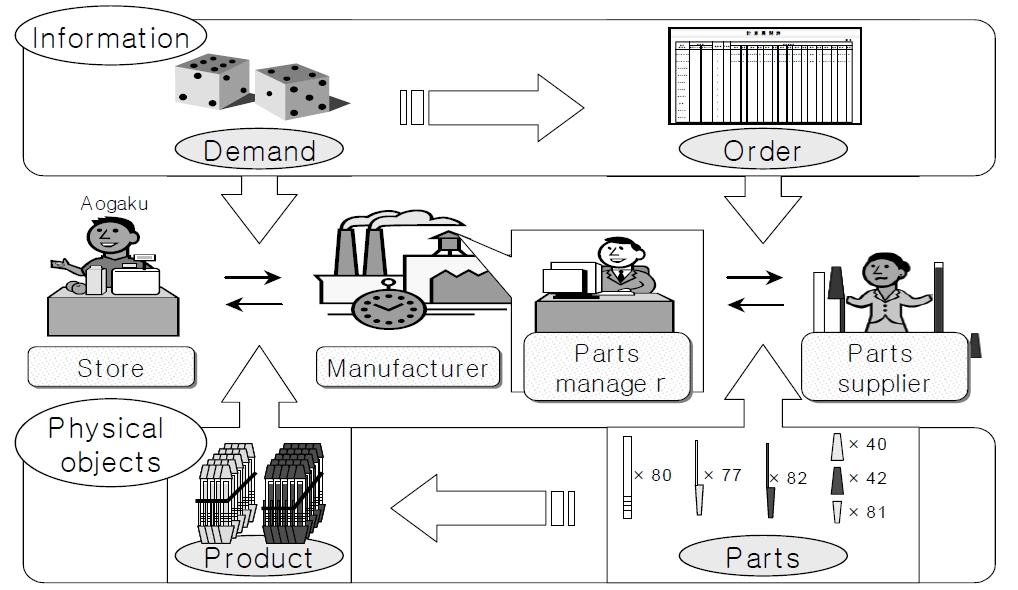
In the exercise, learners select a manufacturer from which to procure the parts required for two different types of ballpoint pens, assemble the pens, and sell the products. Ballpoint pens were chosen as the target product because preparing enough pens for the exercise is convenient and not so costly, and also because they can be assembled and disassembled with ease. The MRP exercise was designed as shown in Figure 1, using the indicated ballpoint pen manufacturer, and its associated retail stores and parts suppliers. The following is an outline of the exercise and its rules. The learner is a manufacturer with a client named “Aogaku Store” that has a recurring order for two types of ballpoint pens. The learner should order the parts for the pens from the parts supplier, and assemble the pens in-house.
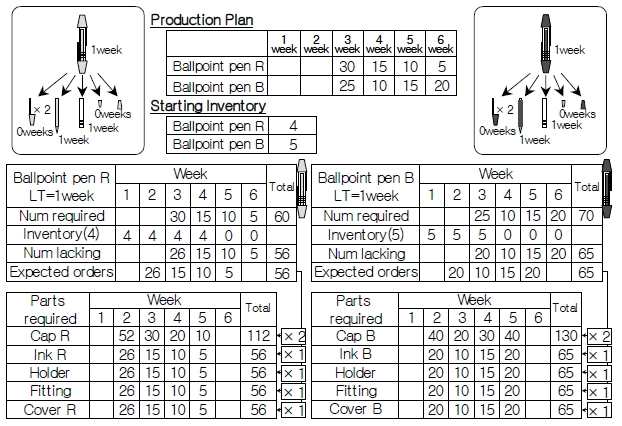
The two types of pens are assembled using five parts. Two of those parts are common to both pens. It takes either zero or one week for parts to arrive at the manufacture after the parts are ordered to the parts supplier. It takes one week for parts to be assembled into pens after their arrival at the factory. The planning period is six weeks, and the daily demand for the six-week period is established using two dice. The parts division manager at the manufacturer should use an MRP calculation sheet (Figure 2) to determine how many of each part must be ordered, and when they should be ordered, on the basis of the established demand, the component parts of the ordered products, and the current product and parts inventories.
3. CREATION OF THE TRAINING PROGRAM
3.1 Creation of the Lecture Materials
In a previous research (Shida
Procedure 1: Determination of the lecture content and enumeration of learning objectives
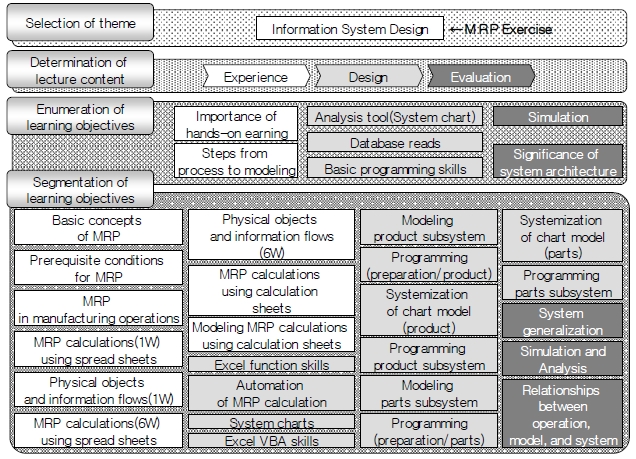
In this procedure, the lecture content was established and the learning objectives were enumerated. The previous research has divided this procedure into four steps; 1) selection of theme, 2) determination of lecture content, 3) enumeration of learning objectives, and 4) segmentation of learning objectives (Figure 3).
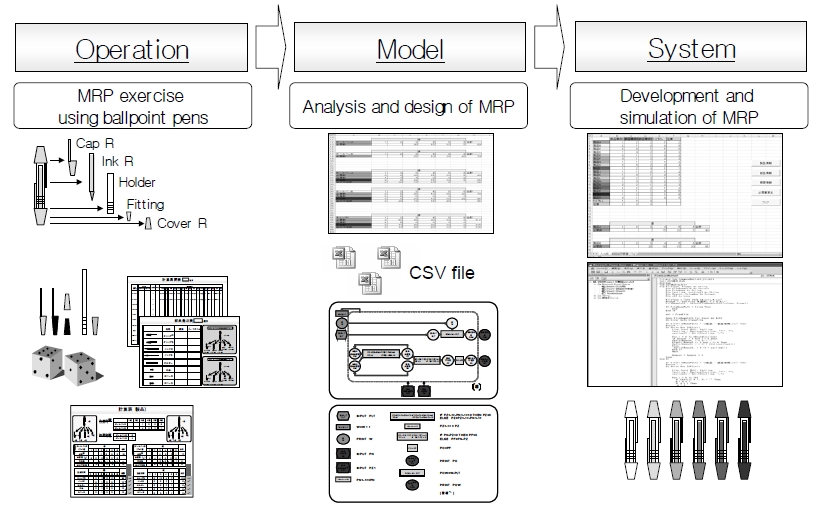
For the training program in this research, “information system design” was selected as the educational theme. At a production site, there are two flows; the flow of physical objects and the flow of information. The first requirement is to understand the flow of physical objects. Attempts to analyze the information flow before understanding the physical objects flow will result in misunderstandings. What is, therefore, needed is a procedure by which 1) the physical objects flow is understood and the information flow is analyzed as
“Operation”, 2) relationships between the physical objects and information flows are established as “Model”, and 3) the system is created as “System” (Figure 4). Taking into account the previous research mentioned above, three components for the lectures were determined; 1) experience, 2) design, and 3) evaluation. Next, the learning objectives were segmented so that graduated training may be performed which covers those objectives determined as important for learners to acquire. For example, for the component of “Experience”, segments were enumerated such as “Basic concepts of MRP”, “Preconditions for MRP operations”, and “MRP in manufacturing operations.”
Procedure 2: Ranking of segmented educational objectives
Following the procedure used in the previous research, the segmented learning objectives were ranked according to Procedure 1. Considering the order in which the segmented learning objectives will be taught, the segments were enumerated along the time axis.
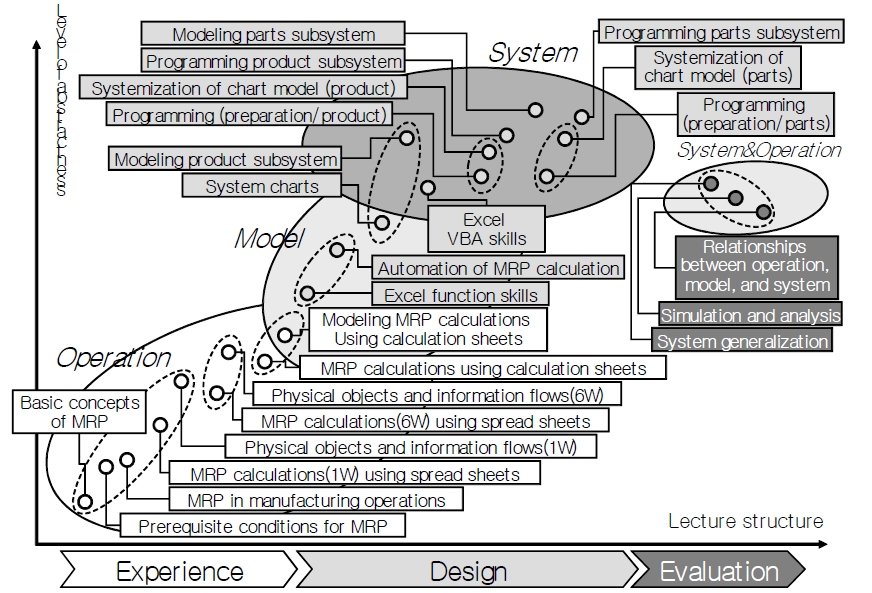
Next, to increase learner comprehension effectively, it is necessary to carry out the training in a sequence that progressively addresses the level of abstraction of the learning objective segments. Figure 5 shows the proposed method of ordering segmented learning objectives on a two-dimensional plane according to a time axis that shows the lecture structure and a second axis that indicates the level of topic abstraction. Solid line circles show each segmented learning objective. In order to make the ranking of the segmented learning objectives more clear, the areas labeled “Operation”, “Model”, and “System” were added.
Procedure 3: Division of lectures
In this procedure, the segmented learning objectives were allocated to 13 lectures. The segmented learning objectives do not take the length of a lecture into consideration, so it was decided that a procedure for determining the content of each lecture was needed. Therefore, the relationship diagram created in Procedure 2 was used to distribute the segmented learning objectives among the lectures.
In this research, the lecture schedule was set as 13 lectures of 90 minutes each. When dividing the lectures, it is important for learners to be conscious of the connections between lectures. Therefore, the divisions within the same lecture content were carefully made as much as possible. Furthermore, learning objectives within each lecture were arranged so that levels of abstraction would be presented in an ascending order. Dot lines represent segmented learning objectives which were divided among the lectures in Figure 5.
Procedure 4: Creation of overall content graph
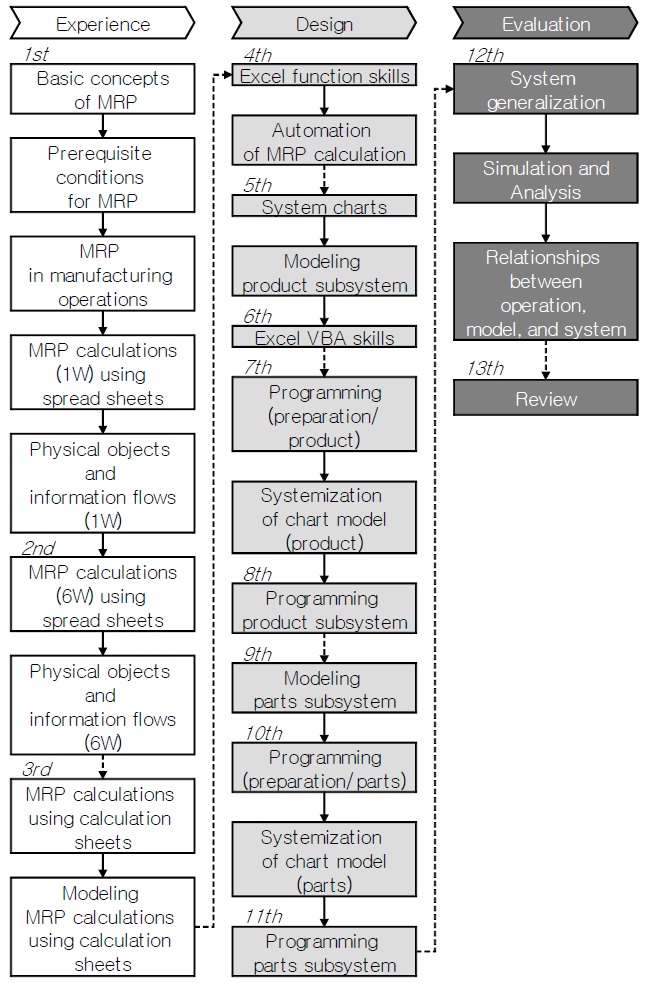
In this procedure, an overall content graph (Figure 6) was created by using arrows to represent the relationships between the segmented learning objectives among the lectures divided in Procedure 3. Next, the overall content graph was used to confirm the connections between the segmented learning objectives and to create the lecture content. In this manner a structure was completed with connections between the segmented learning objectives of almost every lecture. This is considered an appropriate lecture structure, because the shifts between segmented learning objectives that are not related to each other in content are occurring between lectures.
Procedure 5: Creation of lecture materials
Microsoft PowerPoint was used to create 505 slides to be used during the 13 lectures, which introduces topics in increasing order of abstraction. The materials include experiential learning in which manual calculations are performed using an actual ballpoint pen. Diagrams were also created for visualization, and the review materials of previous lectures were added to establish connections between lectures.
Procedure 6: Creation of quizzes
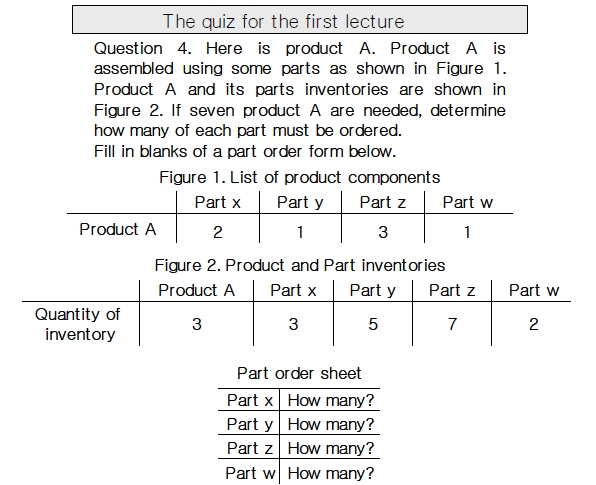
Considering that activities that cause learners to be conscious of the main points of each lecture would compensate for the increasing level of abstraction between the segmented learning objectives, quizzes were created to be given before each lecture. Figure 7 shows an example quiz.
The contents of the quizzes can be divided into “Operation”, “Model”, “System”, and “Operation and System.” 8 quizzes related to Operation, 5 quizzes related to Model, 11 quizzes related to System, and 5 quizzes related to Operation and System were created. Lectures were designed for undergraduate students majoring in management systems engineering. Because they have not so much programming knowledge, many lectures and quizzes related to System were created. The type of the quizzes can also be divided into learned knowledge check and adaptability check; 5 quizzes are related to knowledge and 24 quizzes are related to adaptability. They consist of 4 multiple-choice quizzes, 12 fill-in-the-blank quizzes, 5 calculations, 3 written quizzes, and 5 true-false quizzes. An example of the quiz is shown in Figure 7; the content is related to Operation, the type is adaptability, and the form is calculation.
Procedure 7: Creation of an overall organizational chart of lecture materials
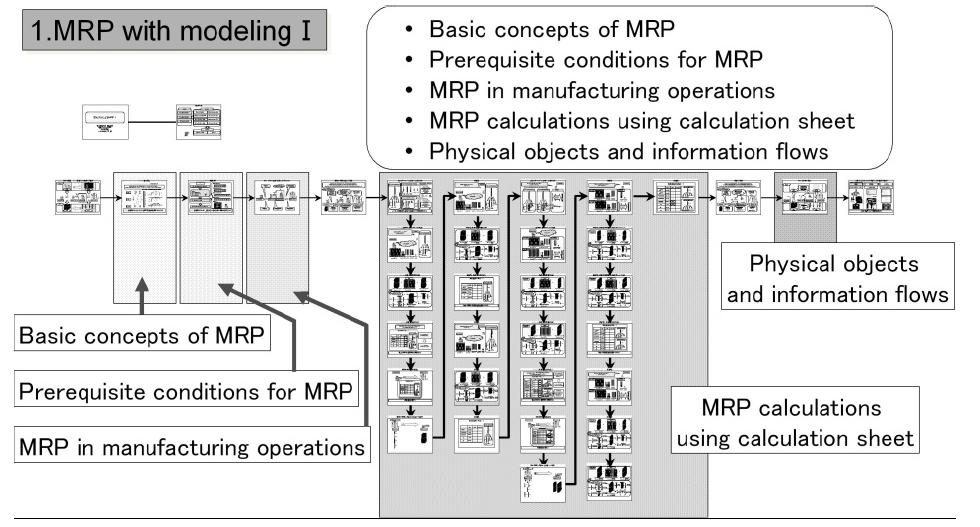
An overall organizational chart was created that included the exercises developed in Procedure 5, and arrows were used to show the relationship between the materials for each lecture. Figure 8 shows an example of the chart, created for 1st lecture. Color identification is used for each segmented learning objective, and content for segmented learning objectives can be added after the slides for each lecture, allowing visualization to confirm the appropriateness of the amount of materials associated with each segmented learning objective. Groups of slides related to the same segmented learning objective are indicated using thin arrows. Slides between which there is a particularly strong connection are indicated with a thicker arrow. Slides between which there is a weak connection are shown with a dotted line arrow.
Next, the connections between each slide were confirmed, using the overall organizational chart of lecture materials. When slides that required modifications were
discovered, the lecture materials were corrected. This was repeated until no further need for modifications was discovered.
As shown in Figure 6, lectures are divided into experience, design, and evaluation sections. There are 13 lectures. In the 3 lectures for the experience section, actual MRP was practiced as an exercise in learning through doing. In the 8 lectures for the design section, a system chart (described below) is used during the system development to model and visualize the system. In the 2 lectures for the evaluation section, simulations are performed using the developed systems to understand its actual implementation. Each section type is explained in detail below.
3.2.1 Experience section
In the experience section, learners perform actual MRP exercises. Operating in teams, they use two dice, red and black ballpoint pens, a MRP calculation sheet (Figure 2), and an order form to perform a six-week MRP exercise from order placement to product assembly. They next perform MRP exercise calculation using the calculation sheet.
3.2.2 Design section
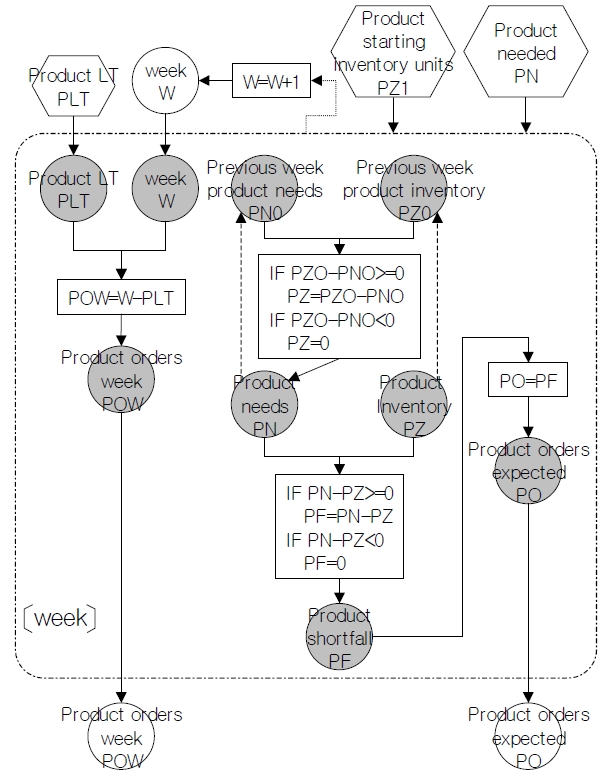
In the design section, learners model and systematize the exercise they performed in the experience section. First, they use Excel functions to automate the MRP calculation sheet used in the experience section. The automated calculation sheet is represented as a system chart (Kanazawa, 1980) that is a method that uses simple symbols and notations to represent the system as a graph (Figure 9). The system chart is used to model and to analyze the MRP exercise. After that, the system chart is used to design the MRP exercise system and code it in Excel-VBA, using a system for conversion into programmatic form.
3.2.3 Evaluation section
In the evaluation section, the MRP exercise system devised during the design section is evaluated. Furthermore, a system is developed, which allows changes in product type or component parts along with parameters such as the lead time or the initial inventory level.
Learners come to understand how the various parameters are related to coding through simulation. Furthermore, by using a system that can handle multiple product types, learners deepen their understanding of the significance of its system architecture. They also come to understand the relationships between operation, model, and system as well as their importance.
A pre-lecture quiz (hereafter, pre-quiz) is given at the start of each lecture, which compensates for increasing the level of abstraction between the segmented learning objectives of the last lecture and those of the current one. Learners can be conscious of the main topics of the lecture beforehand, and can understand the lecture content effectively. A lecture is delivered after the pre-quiz. Each lecture divided in Procedure 3 is then presented, along with the slides developed in Procedure 5. Following the lecture, a post-lecture quiz (hereafter, post-quiz) and a questionnaire are given. The results of these activities can confirm the necessity of supplementary tuition.
In this research, educational effectiveness was also verified by using the measured results through the quizzes and questionnaire.
4. INVESTIGATION OF THE EDUCATIONAL EFFECTIVENESS OF THE DEVELOPED TRAINING PROGRAM
4.1 Preparations for Verification of the Training Program
The training program’s educational effectiveness was evaluated on the basis of the level of learner understanding and the ease of understanding the lecture content.
Pre- and post-quizzes are used to measure the level of learner understanding. A pre-lecture quiz is used for the aforementioned goals, and a similar post-lecture quiz is used for comparison as a way to measure the relative level of learner understanding. Quiz content is developed according to the segmented learning objectives for each lecture. Post-lecture quizzes are designed to be of difficulty level similar to the pre-lecture quizzes.
A questionnaire is used to measure the ease of understanding of the lecture content. Understanding of the content of each lecture is measured on a five-point scale, with level of understanding rated as “very well (understood)”, “well”, “some-what”, “not well”, or “not at all.” For example, the questionnaire for the 1st lecture measures the understanding of the topics “basic concepts of MRP”, “MRP calculation sheet”, and “information flow.”
4.2 Implementation of the Training Program
In order to investigate the educational effectiveness of the MRP exercise-based training program developed through this research, lectures were delivered to 86 third-year students at a university's department of management systems engineering, who have not so much knowledge of MRP and information system. Each of the 13 lectures was delivered. A pre-quiz (4-5 minutes) was delivered at the start of each lecture. The lecture was then presented, along with the developed slides (70 minutes). Following the lecture, a post-quiz was given (4-5 minutes). Finally, the questionnaire was delivered (5 minutes).
4.3 Measurement of Educational Effectiveness
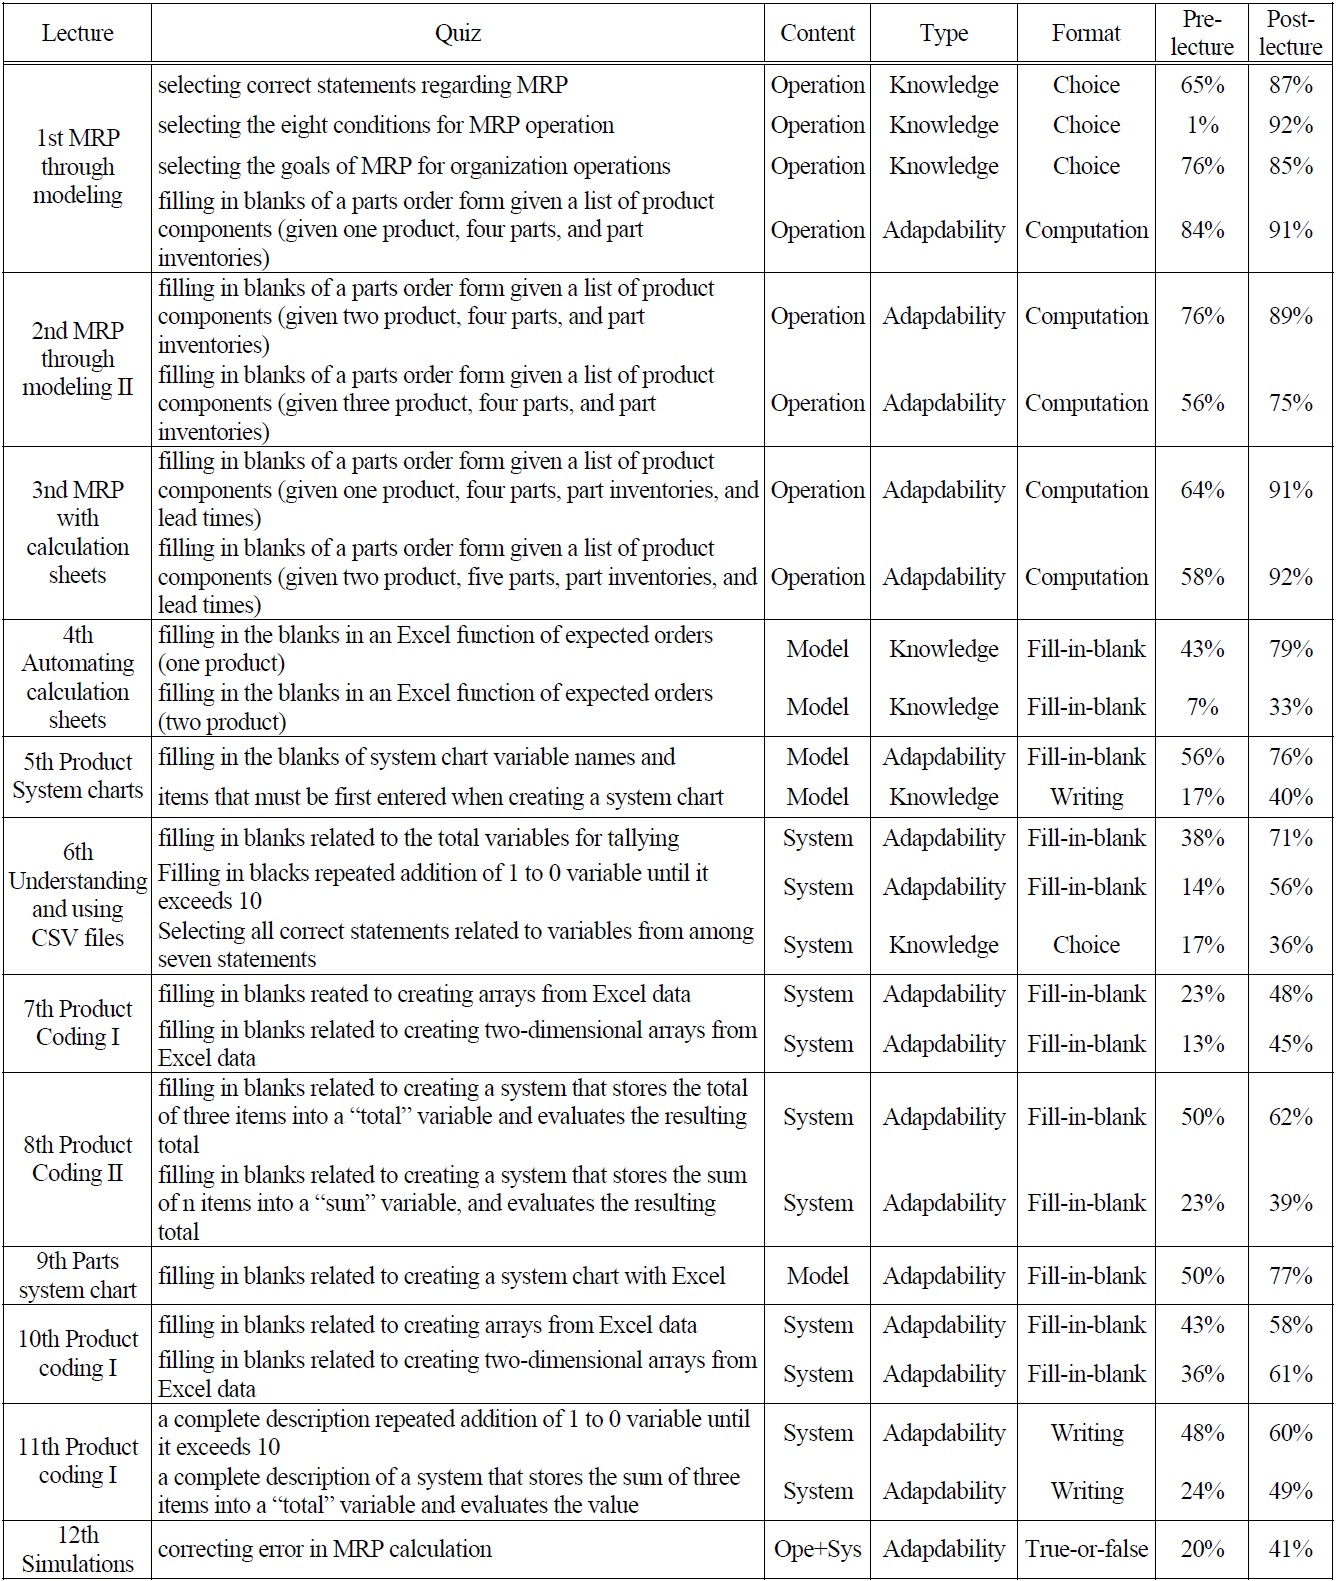
Table 1 shows detailed quiz results of each lecture and Table 2 shows detailed questionnaire results of each lecture.
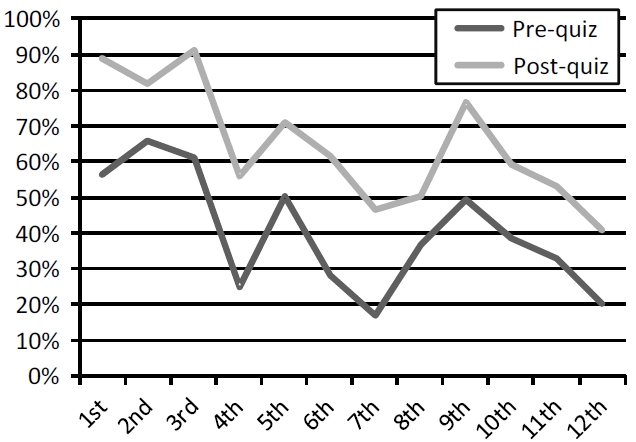
Figure 10 shows the average correct answer ratio of pre-quizzes and post-quizzes in each lecture. The quizzes in the 13th lecture were not delivered because the
[Table 1.] Outline and the correct answer ratio of each quiz

Outline and the correct answer ratio of each quiz
lecture is a review session.
In the 1st, 2nd, and 3rd lecture, the lecture contents were related to Operation. 3 quizzes related to knowledge and 1 quiz related to adaptability were given in the 1st lecture. 2 quizzes related to adaptability were given each in the 2nd and 3rd lecture. Quizzes related to adaptability became more practical and applicative along with the progress of the 3 lectures, so the quiz in
[Table 2.] Question and results of each questionnaire
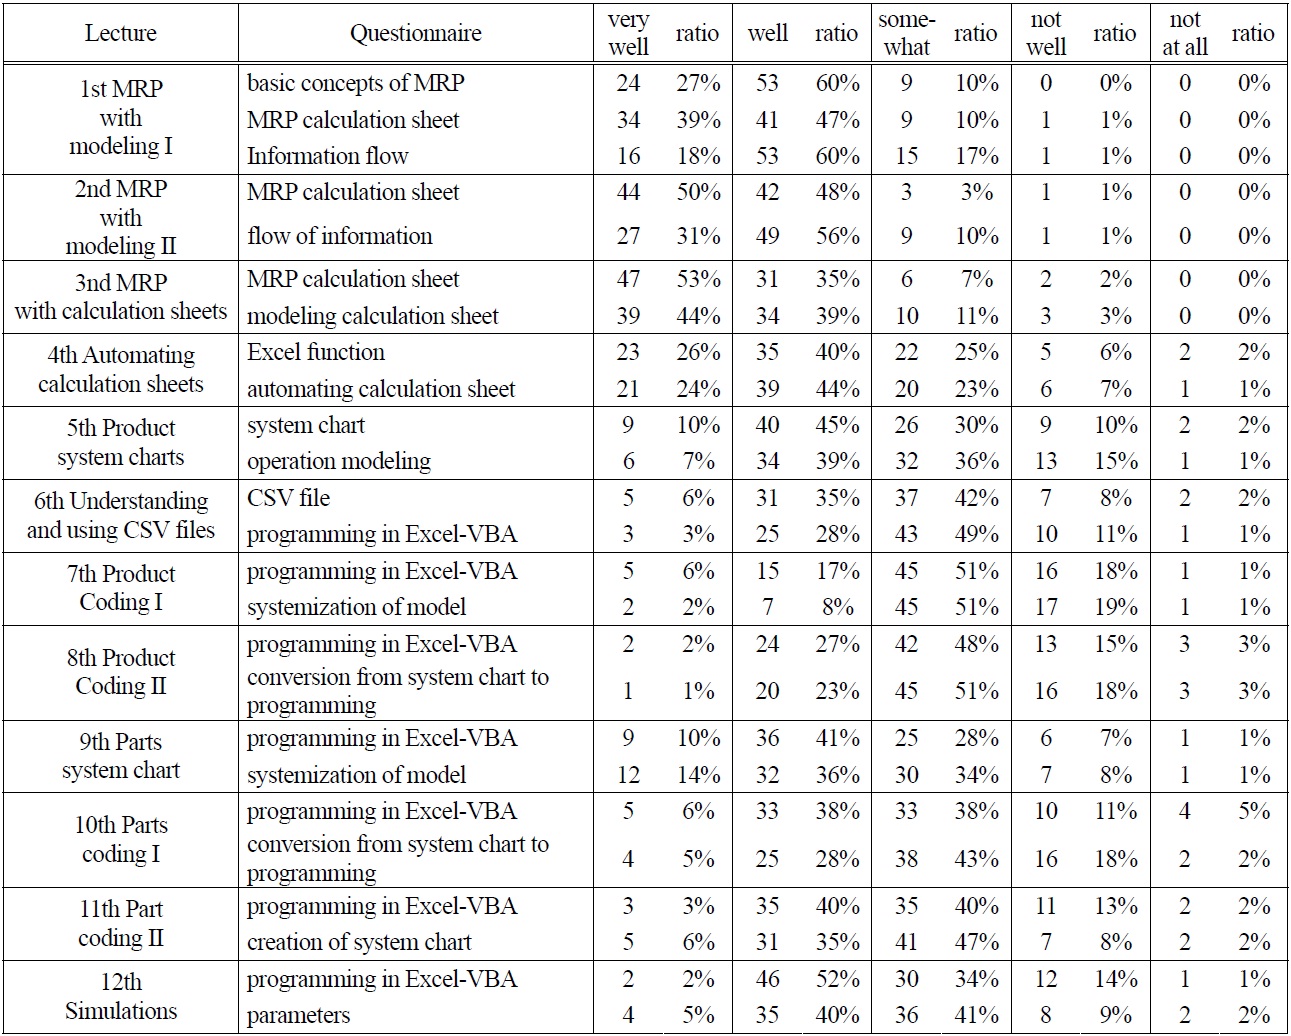
Question and results of each questionnaire
the 3rd lecture was the most practical and applicative. However, the correct answer ratio of post-quiz in the 3rd lecture was as high as 92% and increased 31 points from pre-quiz. These results show that the lectures related to Operation were effective.
In the 4th, 5th, and 9th lecture, the lecture contents were related to Model. As shown in Figure 5, the level of abstraction increased rapidly in the 4th lecture. The correct answer ratio of pre-quiz in the 4th lecture was as low as 25%. However, the correct answer ratio of post-quiz increased 31 points. These results verify the educational effectiveness of Procedure 6.
The correct answer ratio of pre-quiz in the 5th lecture was 50%. The content of the 5th lecture was applied content of the 4th lecture. However, the correct answer ratio of pre-quiz in the 5th lecture was higher than that in the 4th lecture. These results show that the applicable content was easier to understand than the content in which level of abstraction increased rapidly. The correct answer ratio of pre-quiz in the 9th lecture was 50%, which was the same as that in the 5th lecture. These results show that it was not difficult for the learners to understand even when similar lecture did not continue.
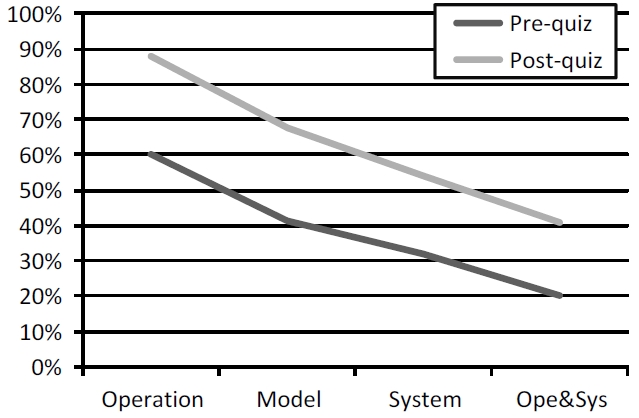
In the 6th lecture, the lecture content was related to System. The correct answer ratio of post-quiz increased 22 points on average from pre-quiz. As shown in Figure 11, the correct answer ratio of post-quiz increased 20% to 30% on average from pre-quiz regardless of the lecture content. These results verify the educational effectiveness.
The average correct answer ratio of post-quiz related to Operation was 88%. However, the average correct answer ratio of post-quiz related to Model, System, and Operation and System were low; the average correct answer ratio of post-quiz related to Model was 68%, that related to System was 54%, and that related to Operation and System was 41%.
There seem to be two reasons why the average correct answer ratio of post-quiz was low. One reason may be the level of learners' knowledge that had been already acquired before the lecture. The average correct answer ratio of pre-quiz related to Operation was 60%. However, the average correct answer ratio of pre-quiz related to Model, System, and Operation and System were low; that related to Model was 41%, that related to System was 32%, and that related to Operation and System was 20%. It is considered that the educational effectiveness was affected by the level of learners' knowledge that had been already acquired before the lecture. This indicates that lecture materials should be created by considering the correct answer ratio of pre-quiz. However, in this research, lecture materials were not created by considering the correct answer ratio of pre-quiz. Further study is required to create a method such as creating the next lecture materials by considering the correct answer ratio of next lecture pre-quiz which is delivered after the lecture.
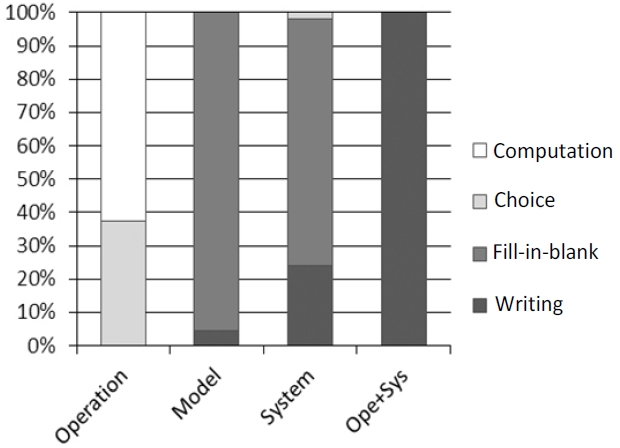
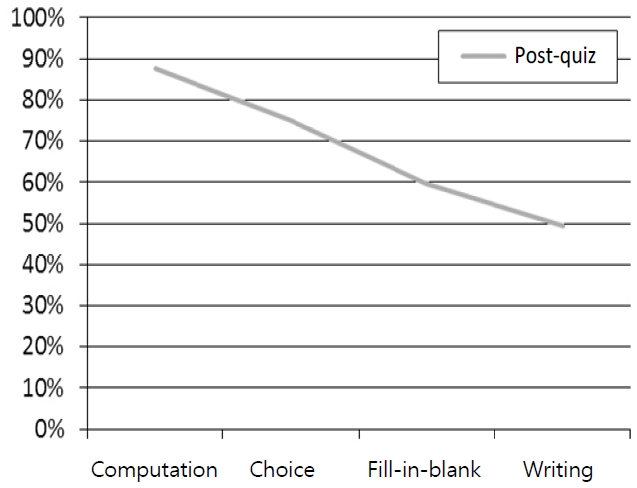
Another reason may be the format of quiz. As shown in Figure 12, the format of quiz is different in each lecture content. The format of the quiz related to Operation is Computation and Choice. On the other hand, the format of quiz related to Model, System, and Operation and System is mostly Fill-in-blank and Writing. As shown in Figure 13, the average correct answer ratio of Fill-in-blank and Writing were lower than that of Computation and Choice. That is why the average correct answer ratios of post-quiz related to Model, System, and Operation and System were low. To make the reason clear, further study is required to create the quiz by considering the format of each lecture content.
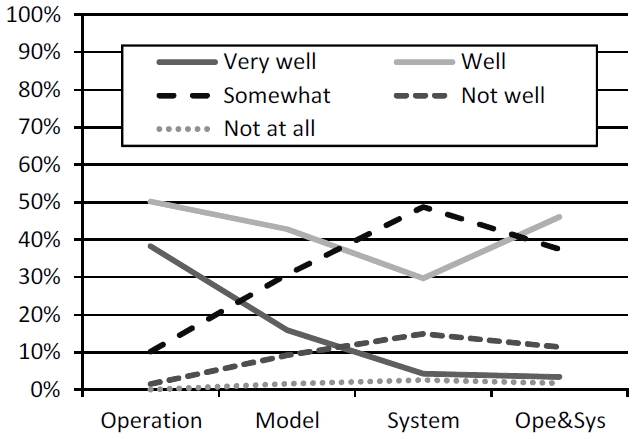
Questionnaire results in each lecture indicate that 17% of learners understood the content “very well” and 40% of learners understood the content “well.” A 57% of learners reported that they understood the lecture content either “very well” or “well.” This indicates a positive evaluation, in that over half of the learners indicated an understanding of the lecture content. Nonetheless, not only did some learners report that they only understood the content “well” or “some-what”, but also “not well” or “not at all”, indicating differing evaluations of the difficulty of the course content for some learners. Figure 14 shows the questionnaire results in each lecture. Comparing the lecture contents related to Model and System, learners who understood the content “very well” and “well” decreased, and learners who understood the content “some-what” and “not well” increased. The reason why the correct answer ratio of post-quiz decreased as shown in Figure 11 was not learners’ misunderstanding of the lecture content but difficulty to understand the lecture content. The lecture materials should be made easier for learners to understand, especially, if the correct answer ratio of pre-quiz is low. Further study is required to improve the method of selecting the lecture materials.
This research developed an MRP exercise-based training program, which is designed to allow the development of personnel with basic IT skills related to understanding actual production site operations and converting those operations into computer systems. The program was designed for 13 lectures organized into 3 sections: experience, design, and evaluation. In the experience section, learners experience an MRP exercise using actual products (ballpoint pens). In the design section, system charts are used to model and systematize the operation experienced in the previous section, and a system conversion process was followed to code the system using Excel-VBA. In the evaluation section, learners used simulations to understand how part compositions, lead time, and other factors correspond to a MRP calculation system. Lecture materials were created in consideration of the levels of topic abstractness. Power-Point was used to create 505 lecture slides to allow visualization of topics through graphs and models. The proposed training program was then taught to 86 college students. The correct answer ratio of post-quiz increased 20% to 30% on average from pre-quiz regardless of the lecture content. These results verify the educational effectiveness. However, the average correct answer ratio of post-quiz related to Model, System, and Operation and System were low. Further research needs to explain the reason why the average correct answer ratio of post-quiz related to Model, System, and Operation and System were low.