검색 전체 메뉴
PDF
맨 위로
OA 학술지
The role of macrophytes in wetland ecosystems
  • 비영리 CC BY-NC
  • 비영리 CC BY-NC
ABSTRACT
The role of macrophytes in wetland ecosystems
KEYWORD
eutrophication , habitat , invasive species , macrophyte , methane , nitrogen , phosphorus , resorption , wetland
  • INTRODUCTION

    Aquatic macrophytes, often also called hydrophytes, are key components of aquatic and wetland ecosystems. As primary producers, they are at the base of herbivorous and detritivorous food chains, providing food to inver-tebrates, fish and birds, and organic carbon for bacteria. Their stems, roots and leaves serve as a substrate for pe-riphyton, and a shelter for numerous invertebrates and different stages of fish, amphibians and reptiles (Timms and Moss 1984, Dvo?ak 1996). Biogeochemical processes in the water column and sediments are to a large extent influenced by the presence/absence and a type of mac-rophytes, and macrophytes can also have a profound im-pact on water movement and sediment dynamics in wa-ter bodies. Some macrophytes are of major importance for their direct contributions to human societies by pro-viding food, biomass, and building materials (Costanza et al. 1997, Engelhardt and Ritchie 2001, Egertson et al. 2004, Bornette and Puijalon 2011).

    Good knowledge of the functions of aquatic macro-phytes in wetlands and shallow lake ecosystems is critical for understanding the basic ecosystem processes. It is also important for numerous applied issues such as wetland restoration, wastewater treatment, and management of invasive species (Lavoie 2010, Casanova 2011).

    The goal of this review is to briefly summarize various macrophyte classifications, and cover in more details nu-merous aspects of the macrophytes’ role in aquatic and wetland ecosystems.

    DEFINITION AND CLASSIFICATION

    The diverse and heterogeneous group of macrophytes has posed a challenge for definition and classification. Macrophytes can be loosely defined as all forms of mac-roscopic aquatic vegetation visible by naked eye. This is in contrast to microphytes, i.e., microscopic forms of aquatic plants, such as planktonic and periphytic algae. The fact that macrophytes live in aquatic environments, at least seasonally, makes them different from terrestrial plants that don’t tolerate flooded environments. The macrophytes include taxonomically very diverse repre-sentatives: macroalgae (e.g., Chara and Nitella), mosses and liverworts (e.g., Sphagnum and Riccia), and vascu-lar plants. Vascular plants represent the largest group of macrophytes including aquatic ferns (Azolla, Salvinia), Gymnosperms (rare) and Angiosperms, both mono- and dicots. Altogether, aquatic macrophytes are represented in seven plant divisions: Cyanobacteria, Chlorophyta, Rhodophyta, Xanthophyta, Bryophyta, Pteridophyta and Spermatophyta, consisting of at least 41 orders and 103 families (for details see Chambers et al. 2008). It is impor-tant to keep in mind that the evolution of angiosperms proceeded in terrestrial environments and when some of them returned to aquatic environment they had to evolve various adaptations.

    There are a number of classical treaties on aquatic macrophytes (Gessner 1955, Sculthorpe 1967, Hutchin-son 1975, Cook 1996) some of them presenting quite elab-orated classification schemes (Hejny 1960, Den Hartog and Segal 1964). Hutchinson (1975) attempted to consoli-date various life-form based classifications (grouped by the relation of plants to water level and substratum) and growth-form based classifications (grouped by structural similarity and relations to the physical environment) into a unified “ecological” classification. Although his product is quite detailed, its main four categories remain the most widely accepted macrophyte classification until today (Wetzel 1975, Denny 1985). It differentiates between freely floating macrophytes and those attached to the substrate, with the attached, or rooted macrophytes further divided into three categories: floating-leaved, submerged and emergent. Brief description of the 4 categories follows:

    “Emergent macrophytes” typically occur in the upper littoral zone at a depth of about 1-1.5 m, their root and rh-zome systems are often adapted to permanently anaero-bic sediments and they have aerial reproductive organs. This group includes rather diverse types of plants that can be further categorized into two groups: 1) erect emergents (e.g., Typha, Phragmites) and 2) creeping emergents (e.g., Ludwigia spp., Myriophyllum aquaticum, Hydrocotyle spp., Nasturtium aquaticum, Alternanthera phyloxeroi-des) (Rejmankova 1992).

    “Floating-leaved macrophytes” represented by genera such as Nymphaea, Victoria, or Brasenia, typically occur at water depths from ~0.5 to 3 m, they have long petioles with leaves adapted to mechanical stress and reproduc-tive organs floating or aerial.

    “Submersed macrophytes” (Chara, Elodea, Cabomba, Utricularia, Myriophyllum) are most adapted to the live in aquatic environment. The depth distribution of an-giosperms is limited to about 10 m, the representatives of other taxonomic groups occur at all depths within the photic zone. They often have elongated, ribbon-like or dissected leaves, and aerial, floating or (rarely) submersed reproductive organs.

    “Freely floating macrophytes” (Eichhornia, Lemna, Sal-vinia) often have highly reduced morphology and duck-weeds (former Lemnaceae, now Araceae) are the smallest angiosperm with the whole plant in genus Wolfia being only about 1 mm across (Sculthorpe 1967). Their leaves and reproductive organs are aerial and/or floating and since they are not rooted in the sediments, their nutrient absorption completely from water.

    Besides the Hutchinson’s ecological classification of macrophytes, several authors attempted to classify mac-rophytes into functional types (Boutin and Keddy 1993, Brock and Casanova 1997, Weiher et al. 1998). Plant func-tional types can be defined as sets of plants exhibiting similar responses to environmental conditions and hav-ing similar effects on the dominant ecosystem processes (Diaz and Cabido 1997, Lavorel et al. 1997). Grouping plants based on their functional traits became increas-ingly important when the need for understanding the link between plant species richness and ecosystem func-tioning has emerged as one of the central questions in ecology during the past decade (Bouchard et al. 2007). A simplification from species to functional groups is also attractive for predictive modeling of vegetation respons-es to human-induced changes in the environment, e.g., climate change (Nygaard and Ejrnaes 2004). However, despite different classification schemes and terminolo-gies there is no single commonly accepted functional type classification useful for all studies whether they are concerned with wetland or terrestrial plants (Sieben et al. 2010). It seems that plant functional groups are being de novo defined for each individual study depending on the study aims (Rejmankova et al. 2011).

    Previous assessments of macrophyte diversity between temperate and tropical regions indicated that the rich-

    ness was similar, or even richer, in temperate regions (Crow 1993).

    However, Chambers et al. (2008) in their thorough comparison of global diversity of freshwater aquatic mac-rophytes among bioregions concluded that vascular mac-rophyte generic diversity for the tropics is greater than for temperate regions. These authors also pointed out that large gaps still exist in our knowledge of aquatic mac-rophyte abundance and distribution, and warned that many of the threats to fresh waters such as eutrophica-tion and alien species introductions will lead to reduced macrophyte diversity.

    ROLE IN WETLAND ECOSYSTEMS

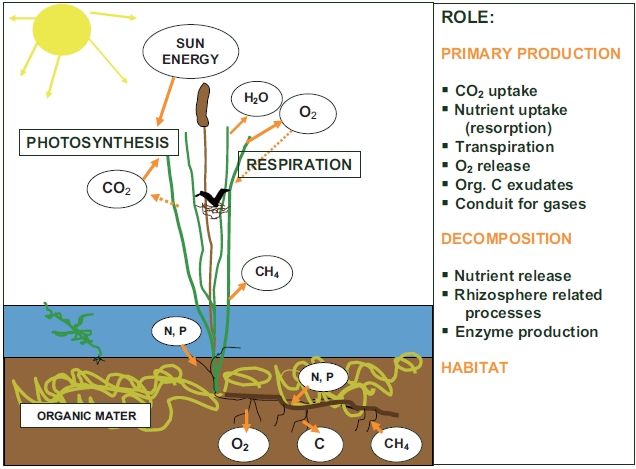
    Different roles of macrophytes in wetland ecosystem, briefly mentioned in the introductory paragraph, are summarized in Fig. 1. The following chapter will explain the individual roles stressing the role of macrophytes in nutrient cycling.

      >  Primary production

    Primary production is one of the basic ecosystem prop-erties. It represents the biomass (usually denoted as W) produced by plants per unit of area per unit of time. Of the most interest is the net primary production, NPP, defined as NPP = gross primary production - respiratory losses. NPP is expressed in units of dry mass per area per unit of

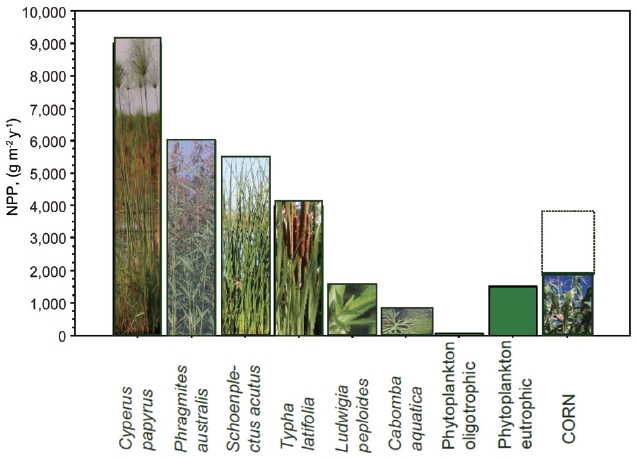
    time, e.g., g dry mass m-2 y-1, sometimes also as ash free dry weight, or weight of carbon, C. NPP corresponds well to the maximum seasonal biomass (Wmax) for plants with one generation time, typically in temperate zones; other-wise it depends on generation time, in the tropics usually NPP ~2 to 3 times Wmax. Examples of NPP of various types of macrophytes are in Fig. 2.

    As in terrestrial ecosystems, NPP depends on tempera-ture, solar radiation, and available nutrients. When tem-perature and solar radiation are near optimal, the ecosys-tem primary production is often limited by shortage of water and/or nutrients (Lambers et al. 1998). Water short-age in permanently flooded wetlands is not an issue and this explains why nutrient rich wetlands are among the most productive ecosystems in the world (e.g., papyrus swamp, see Fig. 2). Another example of highly productive macrophytes are grasses comprising so called floating meadows that develop on floodplains of tropical rivers during the rainy season such as the Amazon floodplain in Brazil, or Magela Creek floodplains in Australia where the peak above-ground biomass often exceeds 4,000 g/m2 (Junk 1997, Pettit et al. 2011).

    Water depth and degree of anaerobiosis of flooded sediments may exert different impact on different species often depending on whether the air is moving through plants from the aerial organs to roots and rhizomes by simple diffusion (most species) or by pressurized ventila-tion (see further in the subchapter on gas exchange).

    NPP can be also impacted by salinity and different types of macrophytes evolved different mechanisms for dealing with increased salinity level, i.e., for keeping their internal osmotic potential in a favorable range (Adam 1990). Some macrophytes decrease their internal osmotic potential by higher mineral salt uptake (Typha, Eleocharis), others rely on organic osmolytica (Cladium) (Rejmankova unpub-lished data).

      >  Nutrients

    Although most wetlands are faced with a slower or faster eutrophication, there are still many places where the wetlands are experiencing nutrient limitation, mostly by nitrogen, N, or phosphorus, P, or their combination (Verhoeven et al. 1996, Gusewell and Koerselman 2002). The range of ombrotrophic to minerotrophic nutrient settings reflects a general trend from low to high nutrient availability, and increasing productivity along the ombro-trophic to minerotrophic gradient (Bedford et al. 1999, Venterink et al. 2003); for definition of wetland types see Mitsch et al. (2009). Thus prevailing N limitation is typical for vascular species of swamp and marsh communities (Bedford et al. 1999, Willby et al. 2001), with P limitation and co-limitation associated with more infertile bog and fen communities (Willby et al. 2001), or marshes with P-poor soils in carstic or serpentine regions (Rejmankova 2005, Sorrell et al. 2011). This gradient in P to N limitation is also associated with changes in species composition from stress-tolerators maximizing nutrient conservation, to fast-growing species that maximize growth and form tall, monospecific stands (Sorrell et al. 2011).

    Shifts from N limitation to P can occur as a result of high atmospheric N deposition (Bobbink et al. 2010). These shifts may affect species composition and diver-sity (Bedford et al. 1999, Gusewell 2004) and impact many ecosystem processes.

      >  Strategies for coping with nutrient limited environment

    Plants have evolved two broad strategies for P acquisi-tion in nutrient-limiting environment: 1) “conservation of use;” and 2) “enhanced acquisition or uptake” (Vance et al. 2003, Ticconi and Abel 2004, Richardson et al. 2009).

      >  Conservation of use

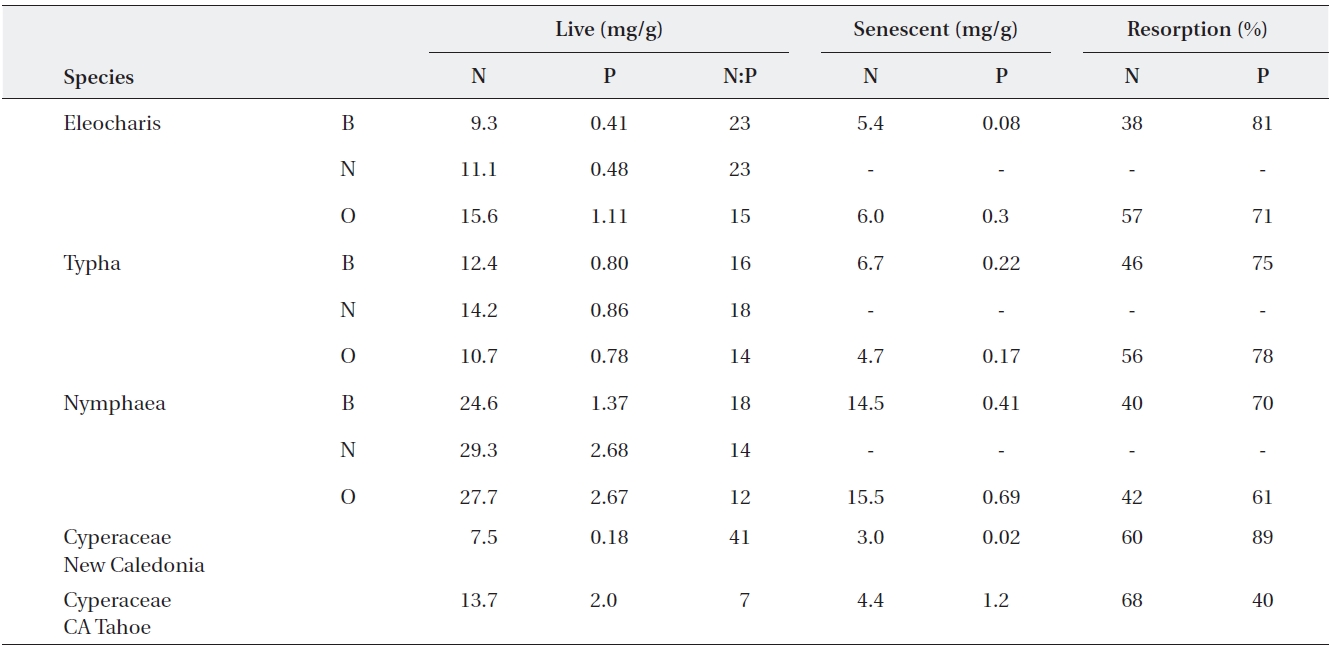
    Resorption of nutrients from senescing to newly grow-ing or storage organs is a typical example of a conserva-tion strategy (Aerts and Chapin 2000). Growth of pe-rennial plants is determined not only by the amount of nutrients they acquire, but also by the amounts of stored nutrients that can be reused. The relationship between nutrient content (N and P) in live tissues and in litter is dependent on resorption, i.e., removal of nutrients from senescing plant tissues and transport of these nutrients to storage organs or growing tissues (Lambers et al. 1998). Two characteristics commonly used to describe nutrient resorption are: 1) resorption efficiency, RE, which is the percent of nutrient reduction between green and senes-cent leaves, and 2) the terminal content of a nutrient in senescent leaves, termed also resorption proficiency (Kill-ingbeck 1996). While average phosphorus RE is around 55% (Aerts 1996), it can reach over 80% in P limited en-vironments (Feller et al. 1999, 2002, Gusewell 2005, Re-jmankova 2005) (Table 1). The average values for nitrogen resorption are slightly lower, 50%, and nitrogen RE never reaches as high values as phosphorus RE. Generally, N in plant tissue fluctuates less as compared to P (Foulds 1993, Aerts and Chapin 2000). Values of 3 mg/g and 0.1 mg/g are given as the ultimate terminal content of N and P, respec-tively, in senescent leaves (Aerts and Chapin 2000). The evidence suggests that the terminal content of nutrients in fully senesced leaves is a particularly sensitive indicator of nutrient availability in wetlands (Rejmankova 2005).

    N/P ratio in live tissue is a good predictor of both P resorption efficiency and P resorption proficiency (Re-jmankova 2005). Phosphorus deficiency can lead to an incomplete N resorption (Feller et al. 2002) and about 6% increase in nitrogen RE of Typha was documented after P limitation was removed (Rejmankova and Snyder 2008).

    The degree to which nutrients are resorbed from se-nescing material determines the quality of litter, which further impacts decomposition rates and the overall sedi-ment nutrient cycling (Aerts and Chapin 2000, Cai and Bongers 2007). Given this, long term changes in plant composition need to be considered when evaluating plant-mediated effects on ecosystem nutrient cycling fol-lowing eutrophication.

      >  Enhanced acquisition

    The enhanced acquisition of N, or P is characterized by a production and secretion of hydrolytical enzymes in-volved in hydrolysis of the respective organic compounds. Enzymes called phosphatases are responsible for release of P from organic P-esters (Duff et al. 1994, Vance et al. 2003, Ticconi and Abel 2004). Extracellular phosphatases are usually located on the outer surface of epidermal cells and root apical meristems (Vance et al. 2003) and the in-duction of phosphatases during P-deficiency is a univer-sal response in higher plants (Raghothama 1999, Phoenix et al. 2004). Typical representatives of enzymes hydrolyz-ing organic N compounds are peptidases (Nausch and Nausch 2000). As is the case with the phosphatases, sev-eral studies demonstrate increasing the peptidase activity with declining N availability (Nausch and Nausch 2000, Hill et al. 2006).

    Another example of enhanced nutrient acquisition involves an increase in spatial soil exploration by expan-sion of the root systems, and formation of symbiotic asso-ciations of roots with mycorrhizae (Lambers et al. 1998). Under nutrient-limited conditions, arbuscular mycorrhi-zae, AM, typically enhance plant growth by providing the plant host with P in exchange for carbon resources (Hart et al. 2003, Holdredge et al. 2010). Until recently, arbus-cular mycorrhizal fungi were considered unimportant in wetlands because anoxic conditions associated with wa-terlogged soils were considered limiting for fungi that are obligate aerobes and have diminished activity in reduced environments (Peat and Fitter 1993). However, more and more studies bring the evidence that AM fungi are pres-ent and widespread in many wetlands, and may influence wetland plant community structure (Brown and Bledsoe 1996, Hildebrandt et al. 2001, Stevens and Peterson 2007, Lagrange et al. 2011). Several wetland plant species (Cy-peraceae, Chenopodiaceae, and Plumbaginaceae) that were thought to be non-mycorrhizal have been shown to have high levels of AMF colonization (Hildebrandt et al. 2001, Holdredge et al. 2010, Kandalepas et al. 2010). It is

    [Table 1.] Examples of live and senescent tissue nutrients, and resorption efficiency in macrophytes from several regions

    label

    Examples of live and senescent tissue nutrients, and resorption efficiency in macrophytes from several regions

    because wetland plants have the ability to oxygenate the rhizosphere (Armstrong et al. 1994) and this may mitigate the negative impact of flooding on the rhizosphere asso-ciated AM fungi (Ipsilantis and Sylvia 2007). Generally, the fungal colonization is higher in dicots than in monocots, with Cyperaceae generally showing a low colonization (Weishampel and Bedford 2006), however, in extreme-ly nutrient limited environments such as wetlands on the ultramafic soils in New Caledonia, Cyperaceae were found to be heavily colonized (Lagrange et al. 2011).

    Oligotrophic softwater lakes of northern Europe and North America represent a special habitat with relatively low nutrient content. They are typically inhabited by sub-merged isoetid plant species, including Littorella uniflora and Lobelia dortmanna, which seem to have the highest degree of mycorrhizal colonization among aquatic plants (Baar et al. 2011).

    An increasing evidence shows that plants in N limited environments, specifically arctic wetlands and many om-brotophic peatlands, are capable to utilize soil organic N compounds. This can happen by direct uptake of simple amino acids such as glycine, as documented for several species of Cyperaceae from wetlands spanning the geo-graphical range from the tropics to the arctics (Raab et al. 1999), or through connections with ericoid or ectotrophic mycorrhizae (Jonasson and Shaver 1999).

      >  Contribution of N-fixation to N economy of macrophytes

    An important contribution to N supply to wetland macrophytes can be from N-fixation (Scott et al. 2007), either by symbiotic N fixers (Elliott et al. 2009) or hetero-trophic N-fixing bacteria living either in the rhizosphere of wetland plants (Dakora and Drake 2000, ?antr??kova et al. 2010) or endophytically (Reinhold-Hurek and Hurek 1998). Diazotrophs of particular importance in wetland and water ecosystems are anaerobic bacteria represented by Enterobacter spp., Klebsiella spp., Vibrio spp., Desulfo-bacter spp., Desulfovibrio spp., and Clostridium spp. (Her-bert 1999).

      >  Wetland eutrophication

    While a great deal of research has focused on the mech-anism by which macrophytes survive in nutrient limited environments, the response of macrophytes exposed to ever increasing amounts of nutrients has been receiving more attention relatively recently (Downing et al. 1999). Agriculturally driven eutrophication has had a profound impact on macrophyte abundance and community com-position in shallow lakes. Shifts in macrophytes commu-nities from a dominance of submergent (e.g., Chara spp.), to floating- leaved (e.g., Nuphar spp.), and to emergent vegetation (e.g., Scirpus spp. and Typha spp.) has been described (for review see Egertson et al. 2004). More in-formation on the response of macrophytes to eutrophi-cation and, specifically, the corresponding changes of wetland ecosystems processes is urgently needed. This information is best learned from nutrient enrichment experiments, preferably long-term and large-scale (Re-jmankova et al. 2008, Richardson 2008).

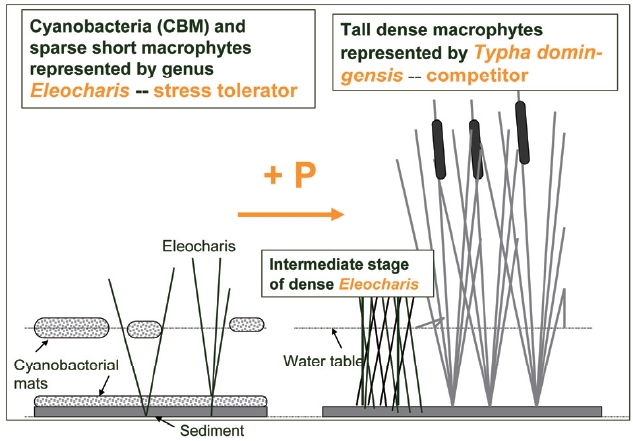
    Nutrient enrichment often leads to species replace-ment of slower growing, nutrient saving stress tolerators by rapidly expanding competitors (Fig. 3). Results of mul-tiple studies on ecosystem response of this change from long term nutrient enrichment plots in subtropical/tropi-cal marshes of the Florida Everglades and Belize, Central America document profound impacts of nutrient input on macrophyte and microphyte species composition leading to a switch from an auto- to heterotrophic metabolism in the water column (Hagerthey et al. 2010), replacement of the autotrophic by heterotrophic N-fixation (?antr??kova et al. 2010) and many other changes (see a special issue of Critical Reviews in Environmental Sciences and Technol-ogy, 41[S1], 2011, for more examples and references).

      >  Gas exchange

    The majority macrophytes rooting in anoxic sediments have developed an aerenchyma, a tissue including large intercellular spaces allowing the transport of oxygen from the atmosphere to roots and rhizomes. The oxygen trans-port enables the continuation of aerobic metabolic pro-cesses in an otherwise reduced environment (Armstrong et al. 1994, Laanbroek 2010). Consumption of oxygen in the belowground plant parts leads to a diffusion flow of air from the shoots to the roots and rhizomes, whereas the metabolically produced carbon dioxide and/or meth-ane follows the opposite route of diffusion (Laanbroek 2010). In many emergent plant species, as well as in some floating-leaved species, this diffusive gas flow is replaced by a more efficient pressurized flow (Dacey 1980, Arm-strong and Armstrong 1991). Pressurized ventilation is induced by the temperature or humidity triggered gra-dient between the air outside the plant and the gases in the plant’s aeration system (Armstrong et al. 1996, Grosse and Frick 1999). Pressurized ventilation has been found in many emergent and floating-leaved macrophytes, such as Typha spp., Phragmites australis. Eleocharis sphacelata, Nuphar luteum, and Schoenoplectus validus (Dacey 1980, Brix et al. 1992).

    Emergent wetland plants play an important role in the emission of methane to the atmosphere (Laanbroek 2010). They provide the carbon necessary for the produc-tion of methane either in form of plant litter or as C-rich root exudates (Strom et al. 2003), and they also facilitate the release of methane through aerenchyma (see above). On the other hand, part of the oxygen transported from the atmosphere through aerenchyma to rhizomes and roots, is released in the root zone where it can contrib-ute to the oxidation of methane. Generally, much higher methane fluxes have been reported from the emergent macrophytes such as Typha, Phragmites, or Eleocharis, than from submersed macrophytes (for specific data Laanbroek 2010). Since the top water layers are usu-ally well oxygenated, the methane emitted into water by submersed macrophytes can be rapidly oxidized before reaching the atmosphere.

    There are conflicting data on the contribution of C-rich root exudates to methane production. Juutinen et al. (2003) found that recent products of photosynthesis of wetland plants made a very limited contribution to meth-ane production, and labile organic carbon for methane production was mainly derived from plant litter. On the other hand, experiments conducted with various rice cul-tivars reported the effect of root exudates on total meth-ane emission (Kerdchoechuen 2005).

    Another discrepancy concerns the relationships be-tween macrophyte biomass and methane production. Strom et al. (2005) and Kao-Kniffin et al. (2010) showed a negative correlation between plant biomass and meth-ane emissions. In contrast, other studies have shown positive relationships between biomass, CO2 fixation, or net ecosystem productivity and methane flux (Chanton et al. 1993, Christensen et al. 2000). Furthermore, in an Alaskan wet meadow tundra, plant biomass did not influ-ence methane emissions from two different sedge species (Schimel 1995).

      >  Decomposition

    Decomposition is a basic process in ecosystem carbon flux and nutrient cycling (Hoorens et al. 2003), especially so in ecosystems where little of primary production is consumed as a living tissue and most ends up in the detri-tus food chain, where the energy bound in organic matter OM is released in a process of respiration by heterotrophs (Ayyappan et al. 1986). Wetlands are often characterized by low herbivory and, unless impacted by humans, they are often ecosystems with low nutrient input. In these limited nutrient environments, the continued availability of nutrient resources often depends on decomposition of organic material (Shaver and Melillo 1984, Aerts and de Caluwe 1997, Alvarez and Guerrero 2000). Decomposi-tion processes are regulated by three interacting sets of factors: physico-chemical environment, the quality or organic material, and the decomposing organisms (Cou-teaux et al. 1995, Morris and Bradley 1999, Liski et al. 2003, Bunemann et al. 2004). In systems where temperature and moisture are not constraining, the most important determinants of decomposition rates are chemical prop-erties of the decomposing material (litter quality) and site quality, i.e., nutrient availability and decomposer activ-ity at the site where the decomposition occurs (Vitousek 2004). Decomposition rates are then related to litter/site quality indicators such as C:N, C:P, lignin:N and N:P ratios (Aerts and de Caluwe 1997, Rejmankova and Houdkova 2006). Under similar conditions, the soft tissue macro-phytes of submersed, floating-leaved and freely floating categories decompose faster than tall emergents (Kim and Rejmankova 2004). Information about decomposi-tion rates and their dependence on environmental condi-tions is important for estimates of carbon sequestration.

      >  Stoichiometry

    To characterize ecological problems, ecological stoichi-ometry is being used with increasing frequency (Sterner and Elser 2002, Tessier and Raynal 2003). For example, N:P ratios have been applied to identify thresholds of nu-trient limitation in wetlands (Koerselman and Meuleman 1996, Aerts and Chapin 2000). Based on studies of Euro-pean wetland plants, thresholds of foliar N:P ratios were found to be < 14 for N limitation and > 16 for phosphorus (P) limitation. Tissue nutrient signatures correspond with ecophysiological differences between growth strategies and with nutrient conditions present in the habitats to which these growth strategies are best matched (Willby et al. 2001). Tissue nutrient contents thus can be used to predict changes in vegetation and corresponding eco-system processes caused by eutrophication, or to detect such changes at early stages before they become difficult to reverse.

    HABITAT PROVIDER

    Wetlands are complex environments with spatial and temporal heterogeneity in hydrology and resource sup-ply. They often support complex vegetation mosaics, which provide habitat for diverse communities of organ-isms, both invertebrates and vertebrates (Dvo?ak and Best 1982, Gonzalez Sagrario and Balseiro 2010). Changes in vegetation caused by increases in nutrient supply (often from anthropogenic activities) result in changes in habitat suitability. As an example: in wetland habitats, phospho-rus enriched runoff from agricultural lands and human settlements causes a replacement of sparse macrophyte vegetation (Eleocharis spp.) with tall dense macrophytes (Typha spp.), see Fig. 3, with important consequences for the larval mosquito community (Pope et al. 2005, Re-jmankova et al. 2006). Sparse macrophytes provide typical habitat for Anopheles albimanus larvae, whereas Typha spp. represent a typical habitat for A. vestitipennis, which is a superior vector of Plasmodium (malaria causing para-site) to humans (Grieco et al. 2000, 2007). Nutrient-medi-ated changes in wetland plant communities can thereby lead to the replacement of A. albimanus by A. vestitipen-nis, increasing the risk of malaria transmission in the re-gion (Achee et al. 2000). Indeed, recent spatial data on malaria incidence showed a weak but positive correlation between the distribution of cattail marshes and number of malaria cases in humans (Pope unpublished data).

    INVASIVE SPECIES

    Wetlands cover ? 6% of the earth’s land area and shal-low waters cover ? 9% of global area yet the proportion of invasive aquatic and wetland plant species is large (30%) (Zedler 2011). It is because aquatic and wetland habitats are especially vulnerable to plant invasions due to high disturbance and often high nutrients that facilitate rapid expansion of invading species. The invaders tend to form monocultures that displace native vegetation and allow few co-occurring plants to persist. Key attributes for suc-cessful invasions are easily dislodged propagules that can establish in novel habitats, clonal growth, broad ecologi-cal tolerance and long-distance dispersal vectors (Ervin et al. 2006).

    The most problematic free-floating species are Azolla pinnata, Eichhornia crassipes, Pistia stratioites, and Sal-vinia molesta, widespread in tropical and sub-tropical re-gions. Other global-scale invasives are Lythrum salicaria, Myriophyllum spicatum, Potamogeton crispus, and Trapa natans. Some species are problematic only in certain re-gions, e.g., Elodea canadensis in Europe, or Hydrilla verti-cillata in North America.

    Examples of invasive emergent macrophytes forming monocultures are giant reed (Phragmites australis), espe-cially in northeastern USA; invasive cattails (Typha spp.), reed canary grass (Phalaris arundinacea) and purple loosestrive (Lythrum salicaria) in temperate North Amer-ica; paperbark (Melalecua quinquenervia) and Brazilian pepper (Schinus terebinthefolius) in Florida; and catclaw mimosa (Mimosa pigra) and aligatorweed (Alternanthera philoxeroides) in Asia and Australia (Zedler 2011).

    The major impact of macrophyte invasive species in-clude the replacement of native species that can lead to potential extinction, changing food webs, and modify-ing the system biogeochemistry (to date, generaliza-tions about the biochemical impacts of invasive species lag behind predictions of their impacts on community composition). The replacement of a native submersed Vallisneria americana with floating-leaved introduced Eurasian Trapa natans in the tidal flats of Hudson River in North America provides a good example (Caraco et al. 2006). The diel oxygen dynamics and the balance of car-bon and oxygen transfers are very different in these two macrophytes. Oxygen levels in large Trapa beds alternate between oxic and hypoxic levels that are harmful to both sensitive fishes and invertebrates, while hypoxic con-ditions do not develop in Vallisneria beds. Most of the chemical differences between beds are brought about by the cascading impacts of hypoxic conditions or alternat-ing oxygen conditions in Trapa.

    CONCLUSION

    Wetland macrophytes comprise taxonomically highly diverse group of plants. Their functions in wetland eco-systems impact many processes such as nutrient cycling and foodweb dynamics. Changes in nutrient availabil-ity often result in replacement of low productivity - high species diversity systems with highly productive species monocultures. Quantity and quality of litter and root car-bon exudates impact sediment heterotrophic microbial processes. Changes in nutrient availability also result in changes in nutrient stoichiometry of plant tissues and nutrient resorption. The roles of macrophytes and sedi-ment microorganisms in wetland ecosystems are closely connected and should be studied simultaneously rather than in isolation.

참고문헌
  • 1. Achee NL, Korves CT, Bangs MJ, Rejmankova E, Lege M, Cur-tin D, Lenares H, Alonzo Y, Andre RG, Roberts DR 2000 Plasmodium vivax polymorphs and Plasmodium falci-parum circumsporozoite proteins in Anopheles (Dip-tera: Culicidae) from Belize, Central America. [J Vector Ecol] Vol.25 P.203-211 google
  • 2. Adam P 1990 Saltmarsh Ecology. google
  • 3. Aerts R 1996 Nutrient resorption from senescing leaves of perennials: Are there general patterns? [J Ecol] Vol.84 P.597-608 google cross ref
  • 4. Aerts R, Chapin FS 2000 The mineral nutrition of wild plants revisited: a re-evaluation of processes and patterns. [Adv Ecol Res] Vol.30 P.1-67 google
  • 5. Aerts R, de Caluwe H 1997 Initial litter respiration as indica-tor for long-term leaf litter decomposition of Carex spe-cies. [Oikos] Vol.80 P.353-361 google cross ref
  • 6. Alvarez S, Guerrero MC 2000 Enzymatic activities associ-ated with decomposition of particulate organic matter in two shallow ponds. [Soil Biol Biochem] Vol.32 P.1941-1951 google cross ref
  • 7. Armstrong J, Armstrong W 1991 A convective through-flow of gases in Phragmites australis (Cav.) [Trin. ex Steud. Aquat Bot] Vol.39 P.75-88 google cross ref
  • 8. Armstrong W, Armstrong J, Beckett PM 1996 Pressurised ventilation in emergent macrophytes: the mechanism and mathematical modelling of humidity-induced con-vection. [Aquat Bot] Vol.54 P.121-135 google cross ref
  • 9. Armstrong W, Brandle R, Jackson MB 1994 Mechanisms of flood tolerance in plants. [Acta Bot Neerl] Vol.43 P.307-358 google
  • 10. Ayyappan S, Olah J, Raghavan SL, Sinha VRP, Purushothaman CS 1986 Macrophyte decomposition in two tropi-cal lakes. [Arch Hydrobiol] Vol.106 P.219-231 google
  • 11. Baar J, Paradi I, Lucassen ECHET, Hudson-Edwards KA, Redecker D, Roelofs JGM, Smolders AJP 2011 Molecular analysis of AMF diversity in aquatic macrophytes: a comparison of oligotrophic and utra-oligotrophic lakes. [Aquat Bot] Vol.94 P.53-61 google cross ref
  • 12. Bedford BL, Walbridge MR, Aldous A 1999 Patterns in nutri-ent availability and plant diversity of temperate North American wetlands. [Ecology] Vol.80 P.2151-2169 google cross ref
  • 13. Bobbink R, Hicks K, Galloway J, Spranger T, Alkemade R, Ashmore M, Bustamante M, Cinderby S, Davidson E, Dentener F, Emmett B, Erisman JW, Fenn M, Gilliam F, Nordin A, Pardo L, De Vries W 2010 Global assessment of nitrogen deposition effects on terrestrial plant diver-sity: a synthesis. [Ecol Appl] Vol.20 P.30-59 google cross ref
  • 14. Bornette G, Puijalon S 2011 Response of aquatic plants to abiotic factors: a review. [Aquat Sci] Vol.73 P.1-14 google cross ref
  • 15. Bouchard V, Frey SD, Gilbert JM, Reed SE 2007 Effects of macrophyte functional group richness on emergent freshwater wetland functions. [Ecology] Vol.88 P.2903-2914 google cross ref
  • 16. Boutin C, Keddy PA 1993 A functional classification of wet-land plants. [J Veg Sci] Vol.4 P.591-600 google cross ref
  • 17. Brix H, Sorrell BK, Orr PT 1992 Internal pressurization and convective gas-flow in some emergent freshwater mac-rophytes. [Limnol Oceanogr] Vol.37 P.1420-1433 google cross ref
  • 18. Brock MA, Casanova MT, Klomp NI, Lunt ID 1997 Plant life at the edges of wetlands: ecological responses to wetting and drying patterns. In: Frontiers in Ecology: Building the Links P.181-192 google
  • 19. Brown AM, Bledsoe C 1996 Spatial and temporal dynam-ics of mycorrhizas in Jaumea carnosa a tidal saltmarsh halophyte. [J Ecol] Vol.84 P.703-715 google cross ref
  • 20. Bunemann EK, Bossio DA, Smithson PC, Frossard E, Oberson A 2004 Microbial community composition and substrate use in a highly weathered soil as affected by crop rotation and P fertilization. [Soil Biol Biochem] Vol.36 P.889-901 google cross ref
  • 21. Cai ZQ, Bongers F 2007 Contrasting nitrogen and phos-phorus resorption efficiencies in trees and lianas from a tropical montane rain forest in Xishuangbanna, South-west China. [J Trop Ecol] Vol.23 P.115-118 google cross ref
  • 22. Caraco N, Cole J, Findlay S, Wigand C 2006 Vascular plants as engineers of oxygen in aquatic systems. [BioScience] Vol.56 P.219-225 google cross ref
  • 23. Casanova MT 2011 Using water plant functional groups to investigate environmental water requirements. [Freshw Biol] Vol.56 P.2637-2652 google cross ref
  • 24. Chambers PA, Lacoul P, Murphy KJ, Thomaz SM 2008 Global diversity of aquatic macrophytes in freshwater. [Hydrobiologia] Vol.595 P.9-26 google cross ref
  • 25. Chanton JP, Whiting GJ, Happell JD, Gerard G 1993 Con-trasting rates and diurnal patterns of methane emission from emergent aquatic macrophytes. [Aquat Bot] Vol.46 P.111-128 google cross ref
  • 26. Christensen TR, Friborg T, Sommerkorn M, Kaplan J, Illeris L, Soegaard H, Nordstroem C, Jonasson S 2000 Trace gas exchange in a high-arctic valley. 1. Variations in CO2 and CH4 flux between tundra vegetation types. [Global Biogeochem Cycles] Vol.14 P.701-713 google cross ref
  • 27. Cook CDK 1996 Aquatic Plant Book. google
  • 28. Costanza R, d’Arge R, de Groot R, Farber S, Grasso M, Hannon B, Limburg K, Naeem S, O’Neill RV, Paruelo J, Raskin RG, Sutton P, van den Belt M 1997 The value of the world’s ecosystem services and natural capital. [Nature] Vol.387 P.253-260 google cross ref
  • 29. Couteaux MM, Bottner P, Ber B 1995 Litter decomposition climate and litter quality. [Trends Ecol Evol] Vol.10 P.63-66 google cross ref
  • 30. Crow GE 1993 Species diversity in aquatic angiosperms: latitudinal patterns. [Aquat Bot] Vol.44 P.229-258 google cross ref
  • 31. Dacey JWH 1980 Internal winds in water lilies: an adapta-tion for life in anaerobic sediments. [Science] Vol.210 P.1017-1019 google cross ref
  • 32. Dakora FD, Drake BG 2000 Elevated CO2 stimulates asso-ciative N2 fixation in a C3 plant of the Chesapeake Bay wetland. [Plant Cell Environ] Vol.23 P.943-953 google cross ref
  • 33. Den Hartog C, Segal S 1964 A new classification of the wa-ter-plant communities. [Acta Bot Neerl] Vol.13 P.367-393 google
  • 34. Denny P, Junk W. Dr. 1985 The Ecology and Management of African Wetland Vegetation: A Botanical Account of African Swamps and Shallow Waterbodies. google
  • 35. Diaz S, Cabido M 1997 Plant functional types and ecosys-tem function in relation to global change. [J Veg Sci] Vol.8 P.463-474 google
  • 36. Downing JA, McClain M, Twilley R, Melack JM, Elser J, Ra-balais NN, Lewis WM Jr, Turner RE, Corredor J, Soto D, Yanez-Arancibia A, Kopaska JA, Howarth RW 1999 The impact of accelerating land-use change on the N-cycle of tropical aquatic ecosystems: current conditions and projected changes. [Biogeochemistry] Vol.46 P.109-148 google
  • 37. Duff SMG, Sarath G, Plaxton WC 1994 The role of acid phosphatases in plant phosphorus metabolism. [Physiol Plant] Vol.90 P.791-800 google cross ref
  • 38. Dvo?ak J 1996 An example of relationships between macro-phytes macroinvertebrates and their food resources in a shallow eutrophic lake. [Hydrobiologia] Vol.339 P.27-36 google cross ref
  • 39. Dvo?ak J, Best EPH 1982 Macro-invertebrate communi-ties associated with the macrophytes Of Lake Vechten: structural and functional relationships. [Hydrobiologia] Vol.95 P.115-126 google cross ref
  • 40. Egertson CJ, Kopaska JA, Downing JA 2004 A century of change in macrophyte abundance and composition in response to agricultural eutrophication. [Hydrobiologia] Vol.524 P.145-156 google cross ref
  • 41. Elliott GN, Chou JH, Chen WM, Bloemberg GV, Bontemps C, Martinez-Romero E, Velazquez E, Young JPW, Sprent JI, James EK 2009 Burkholderia spp. are the most compet-itive symbionts of Mimosa, particularly under N-limited conditions. [Environ Microbiol] Vol.11 P.762-778 google cross ref
  • 42. Engelhardt KAM, Ritchie ME 2001 Effects of macrophyte species richness on wetland ecosystem functioning and services. [Nature] Vol.411 P.687-689 google cross ref
  • 43. Ervin G, Smothers M, Holly C, Anderson C, Linville J 2006 Relative importance of wetland type versus anthropo-genic activities in determining site invasibility. [Biol Invasions] Vol.8 P.1425-1432 google cross ref
  • 44. Feller IC, McKee KL, Whigham DF, O’Neill JP 2002 Nitrogen vs. phosphorus limitation across an ecotonal gradient in a mangrove forest. [Biogeochemistry] Vol.62 P.145-175 google
  • 45. Feller IC, Whigham DE, O’Neill JP, McKee KL 1999 Effects of nutrient enrichment on within-stand cycling in a man-grove forest. [Ecology] Vol.80 P.2193-2205 google cross ref
  • 46. Foulds W 1993 Nutrient concentrations of foliage and soil in South-Western Australia. [New Phytol] Vol.125 P.529-546 google cross ref
  • 47. Gessner F 1955 Hydrobotanik. Die physiologischen Grun-dlagen der Pflanzen-verrbreitung im Wasser. google
  • 48. Gonzalez Sagrario MDLA, Balseiro E 2010 The role of mac-roinvertebrates and fish in regulating the provision by macrophytes of refugia for zooplankton in a warm tem-perate shallow lake. [Freshw Biol] Vol.55 P.2153-2166 google cross ref
  • 49. Grieco JP, Achee NL, Andre RG, Roberts DR 2000 A com-parison study of house entering and exiting behavior of Anopheles vestitipennis (Diptera: Culicidae) using ex-perimental huts sprayed with DDT or deltamethrin in the southern district of Toledo, Belize, C.A. [J Vector Ecol] Vol.25 P.62-73 google
  • 50. Grieco JP, Rejmankova E, Achee NL, Klein CN, Andre R, Roberts D 2007 Habitat suitability for three species of Anopheles mosquitoes: larval growth and survival in re-ciprocal placement experiments. [J Vector Ecol] Vol.32 P.176-187 google cross ref
  • 51. Grosse W, Frick HJ 1999 Gas transfer in wetland plants con-trolled by Graham’s law of diffusion. [Hydrobiologia] Vol.415 P.55-58 google cross ref
  • 52. Gusewell S 2004 N : P ratios in terrestrial plants: variation and functional significance. [New Phytol] Vol.164 P.243-266 google cross ref
  • 53. Gusewell S 2005 Nutrient resorption of wetland graminoids is related to the type of nutrient limitation. [Funct Ecol] Vol.19 P.344-354 google cross ref
  • 54. Gusewell S, Koerselman W 2002 Variation in nitrogen and phosphorus concentrations of wetland plants. [Perspect Plant Ecol Evol Syst] Vol.5 P.37-61 google cross ref
  • 55. Hagerthey SE, Cole JJ, Kilbane D 2010 Aquatic metabolism in the Everglades: dominance of water column heterot-rophy. [Limnol Oceanogr] Vol.55 P.653-666 google cross ref
  • 56. Hart MM, Reader RJ, Klironomos JN 2003 Plant coexistence mediated by arbuscular mycorrhizal fungi. [Trends Ecol Evol] Vol.18 P.418-423 google
  • 57. Hejny S 1960 Okologische Charakteristik der Wasser-und Sumpfpflanzen in der Slowakischen Tiefebenen. google
  • 58. Herbert RA 1999 Nitrogen cycling in coastal marine ecosys-tems. [FEMS Microbiol Rev] Vol.23 P.563-590 google cross ref
  • 59. Hildebrandt U, Janetta K, Ouziad F, Renne B, Nawrath K, Bothe H 2001 Arbuscular mycorrhizal colonization of halophytes in Central European salt marshes. [Mycorrhiza] Vol.10 P.175-183 google cross ref
  • 60. Hill BH, Elonen CM, Jicha TM, Cotter AM, Trebitz AS, Danz NP 2006 Sediment microbial enzyme activity as an in-dicator of nutrient limitation in Great Lakes coastal wet-lands. [Freshw Biol] Vol.51 P.1670-1683 google cross ref
  • 61. Holdredge C, Bertness MD, von Wettberg E, Silliman BR 2010 Nutrient enrichment enhances hidden differences in phenotype to drive a cryptic plant invasion. [Oikos] Vol.119 P.1776-1784 google cross ref
  • 62. Hoorens B, Aerts R, Stroetenga M 2003 Does initial litter chemistry explain litter mixture effects on decomposi-tion? [Oecologia] Vol.137 P.578-586 google cross ref
  • 63. Hutchinson GE 1975 A Treatise on Limnology. III. Limno-logical Botany. google
  • 64. Ipsilantis I, Sylvia DM 2007 Interactions of assemblages of mycorrhizal fungi with two Florida wetland plants. [Appl Soil Ecol] Vol.35 P.261-271 google cross ref
  • 65. Jonasson S, Shaver GR 1999 Within-stand nutrient cycling in arctic and boreal wetlands. [Ecology] Vol.80 P.2139-2150 google cross ref
  • 66. Junk WJ 1997 Structure and function of the large central Amazonian River floodplains: synthesis and discussion. In: The Central Amazon Floodplain: Ecology of a Pulsing System P.455-473 google
  • 67. Juutinen S, Larmola T, Remus R, Mirus E, Merbach W, Silvola J, Augustin J 2003 The contribution of Phragmites aus-tralis litter to methane (CH4) emission in planted and non-planted fen microcosms. [Biol Fertil Soils] Vol.38 P.10-14 google cross ref
  • 68. Kandalepas D, Stevens KJ, Shaffer GP, Platt WJ 2010 How abundant are root-colonizing fungi in Southeastern Louisiana’s degraded marshes? [Wetlands] Vol.30 P.189-199 google cross ref
  • 69. Kao-Kniffin J, Freyre DS, Balser TC 2010 Methane dynam-ics across wetland plant species. [Aquat Bot] Vol.93 P.107-113 google cross ref
  • 70. Kerdchoechuen O 2005 Methane emission in four rice vari-eties as related to sugars and organic acids of roots and root exudates and biomass yield. [Agric Ecosyst Environ] Vol.108 P.155-163 google cross ref
  • 71. Killingbeck KT 1996 Nutrients in senesced leaves: keys to the search for potential resorption and resorption profi-ciency. [Ecology] Vol.77 P.1716-1727 google cross ref
  • 72. Kim JG, Rejmankova E 2004 Decomposition of macrophytes and dynamics of enzyme activities in subalpine marshes in Lake Tahoe basin, U.S.A. [Plant Soil] Vol.266 P.303-313 google
  • 73. Koerselman W, Meuleman AFM 1996 The vegetation N:P ratio: a new tool to detect the nature of nutrient limita-tion. [J Appl Ecol] Vol.33 P.1441-1450 google cross ref
  • 74. Laanbroek HJ 2010 Methane emission from natural wet-lands: interplay between emergent macrophytes and soil microbial processes. A mini-review. [Ann Bot] Vol.105 P.141-153 google cross ref
  • 75. Lagrange A, Ducousso M, Jourand P, Majorel C, Amir H 2011 New insights into the mycorrhizal status of Cy-peraceae from ultramafic soils in New Caledonia. [Can J Microbiol] Vol.57 P.21-28 google cross ref
  • 76. Lambers H, Chapin FS 3rd, Pons TL 1998 Plant Physiologi-cal Ecology. google
  • 77. Lavoie C 2010 Should we care about purple loosestrife? The history of an invasive plant in North America. [Biol Invasions] Vol.12 P.1967-1999 google cross ref
  • 78. Lavorel S, McIntyre S, Landsberg J, Forbes TDA 1997 Plant functional classifications: from general groups to spe-cific groups based on response to disturbance. [Trends Ecol Evol] Vol.12 P.474-478 google cross ref
  • 79. Liski J, Nissinen A, Erhard M, Taskinen O 2003 Climatic ef-fects on litter decomposition from arctic tundra to tropi-cal rainforest. [Glob Change Biol] Vol.9 P.575-584 google cross ref
  • 80. Mitsch WJ, Gosselink JG, Anderson CJ, Zhang L 2009 Wet-land Ecosystems. google
  • 81. Morris JT, Bradley PM 1999 Effects of nutrient loading on the carbon balance of coastal wetland sediments. [Limnol Oceanogr] Vol.44 P.699-702 google cross ref
  • 82. Nausch M, Nausch G 2000 Stimulation of peptidase activity in nutrient gradients in the Baltic Sea. [Soil Biol Biochem] Vol.32 P.1973-1983 google cross ref
  • 83. Nygaard B, Ejrnæs R 2004 A new approach to functional in-terpretation of vegetation data. [J Veg Sci] Vol.15 P.49-56 google cross ref
  • 84. Peat HJ, Fitter AH 1993 The distribution of arbuscular my-corrhizas in the British Flora. [New Phytol] Vol.125 P.845-854 google cross ref
  • 85. Pettit NE, Bayliss P, Davies PM, Hamilton SK, Warfe DM, Bunn SE, Douglas MM 2011 Seasonal contrasts in car-bon resources and ecological processes on a tropical floodplain. [Freshw Biol] Vol.56 P.1047-1064 google cross ref
  • 86. Phoenix GK, Booth RE, Leake JR, Read DJ, Grime JP, Lee JA 2004 Simulated pollutant nitrogen deposition increases P demand and enhances root-surface phosphatase ac-tivities of three plant functional types in a calcareous grassland. [New Phytol] Vol.161 P.279-290 google
  • 87. Pope K, Masuoka P, Rejmankova E, Grieco J, Johnson S, Roberts D 2005 Mosquito habitats, land use, and malaria risk in Belize from satellite imagery. [Ecol Appl] Vol.15 P.1223-1232 google cross ref
  • 88. Raab TK, Lipson DA, Monson RK 1999 Soil amino acid uti-lization among species of the Cyperaceae: plant and soil processes. [Ecology] Vol.80 P.2408-2419 google cross ref
  • 89. Raghothama KG 1999 Phosphate acquisition. [Annu Rev Plant Physiol Plant Mol Biol] Vol.50 P.665-693 google cross ref
  • 90. Reinhold-Hurek B, Hurek T 1998 Life in grasses: diazotro-phic endophytes. [Trends Microbiol] Vol.6 P.139-144 google cross ref
  • 91. Rejmankova E 1992 Ecology of creeping macrophytes with special reference to Ludwigia peploides (H.B.K) Raven. [Aquat Bot] Vol.43 P.283-299 google cross ref
  • 92. Rejmankova E 2005 Nutrient resorption in wetland macro-phytes: comparison across several regions of different nutrient status. [New Phytol] Vol.167 P.471-482 google cross ref
  • 93. Rejmankova E, Grieco J, Achee N, Masuoka P, Pope K, Roberts D, Higashi RM, Collinge SK, Ray C 2006 Freshwater community interactions and malaria. In: Disease Ecology: Community Structure and Pathogen Dynamics P.90-105 google
  • 94. Rejmankova E, Houdkova K 2006 Wetland macrophyte de-composition under different nutrient conditions: what is more important litter quality or site quality? [Biogeochemistry] Vol.80 P.245-262 google cross ref
  • 95. Rejmankova E, Sirova D, Carlson E 2011 Patterns of activi-ties of root phosphomonoesterase and phosphodiester-ase in wetland plants as a function of macrophyte spe-cies and ambient phosphorus regime. [New Phytol] Vol.190 P.968-976 google cross ref
  • 96. Rejmankova E, Snyder JM 2008 Emergent macrophytes in phosphorus limited marshes: Do phosphorus usage strategies change after nutrient addition? [Plant Soil] Vol.313 P.141-153 google cross ref
  • 97. Rejmankova E, Macek P, Epps K 2008 Wetland ecosystem changes after three years of phosphorus addition. [Wetlands] Vol.28 P.914-927 google cross ref
  • 98. Richardson AE, Barea JM, McNeill AM, Prigent-Combaret C 2009 Acquisition of phosphorus and nitrogen in the rhi-zosphere and plant growth promotion by microorgan-isms. [Plant Soil] Vol.321 P.305-339 google cross ref
  • 99. Richardson CJ 2008 The Everglades Experiment : Lessons for Ecosystem Restoration. Ecological Studies Vol. 201. google
  • 100. ?antr??kova H, Rejmankova E, Pivni?kova B, Snyder JM 2010 Nutrient enrichment in tropical wetlands: shifts from autotrophic to heterotrophic nitrogen fixation. [Biogeochemistry] Vol.101 P.295-310 google cross ref
  • 101. Schimel JP 1995 Plant transport and methane production as controls on methane flux from arctic wet meadow tundra. [Biogeochemistry] Vol.28 P.183-200 google cross ref
  • 102. Scott JT, Doyle RD, Back JA, Dworkin SI 2007 The role of N2 fixation in alleviating N limitation in wetland metaphy-ton: enzymatic, isotopic, and elemental evidence. [Biogeochemistry] Vol.84 P.207-218 google cross ref
  • 103. Sculthorpe CD 1967 The Biology of Aquatic Vascular Plants. google
  • 104. Shaver GR, Melillo JM 1984 Nutrient budgets of marsh plants: efficiency concepts and relation to availability. [Ecology] Vol.65 P.1491-1510 google cross ref
  • 105. Sieben EJJ, Morris CD, Kotze DC, Muasya AM 2010 Chang-es in plant form and function across altitudinal and wet-ness gradients in the wetlands of the Maloti-Drakens-berg South Africa. [Plant Ecol] Vol.207 P.107-119 google cross ref
  • 106. Sorrell BK, Chague-Goff C, Basher LM, Partridge TR 2011 N:P ratios delta(15)N fractionation and nutrient resorp-tion along a nitrogen to phosphorus limitation gradient in an oligotrophic wetland complex. [Aquat Bot] Vol.94 P.93-101 google cross ref
  • 107. Sterner RW, Elser JJ 2002 Ecological Stoichiometry: The Biology of Elements from Molecules to the Biosphere. google
  • 108. Stevens KJ, Peterson RL 2007 Relationships among three pathways for resource acquisition and their contribu-tion to plant performance in the emergent aquatic plant Lythrum salicaria (L.). [Plant Biol] Vol.9 P.758-765 google cross ref
  • 109. Strom L, Ekberg A, Mastepanov M, Christensen TR 2003 The effect of vascular plants on carbon turnover and meth-ane emissions from a tundra wetland. [Glob Change Biol] Vol.9 P.1185-1192 google cross ref
  • 110. Strom L, Mastepanov M, Christensen TR 2005 Species-specific effects of vascular plants on carbon turnover and methane emissions from wetlands. [Biogeochemistry] Vol.75 P.65-82 google cross ref
  • 111. Tessier JT, Raynal DJ 2003 Use of nitrogen to phosphorus ratios in plant tissue as an indicator of nutrient limita-tion and nitrogen saturation. [J App Ecol] Vol.40 P.523-534 google cross ref
  • 112. Ticconi CA, Abel S 2004 Short on phosphate: plant surveil-lance and countermeasures. [Trends Plant Sci] Vol.9 P.548-555 google cross ref
  • 113. Timms RM, Moss B 1984 Prevention of growth of potentially dense phytoplankton populations by zooplankton graz-ing, in the presence of zooplanktivorous fish, in a shal-low wetland ecosystem. [Limnol Oceanogr] Vol.29 P.472-486 google cross ref
  • 114. Vance CP, Uhde-Stone C, Allan DL 2003 Phosphorus acqui-sition and use: critical adaptations by plants for securing a nonrenewable resource. [New Phytol] Vol.157 P.423-447 google cross ref
  • 115. Venterink HO, Wassen MJ, Verkroost AWM, de Ruiter PC 2003 Species richness-productivity patterns differ be-tween N-, P-, and K-limited wetlands. [Ecology] Vol.84 P.2191-2199 google cross ref
  • 116. Verhoeven JTA, Koerselman W, Meuleman AFM 1996 Ni-trogen- or phosphorus-limited growth in herbaceous, wet vegetation: relations with atmospheric inputs and management regimes. [Trends Ecol Evol] Vol.11 P.494-497 google cross ref
  • 117. Vitousek PM 2004 Nutrient Cycling and Limitation: Hawai’i as a Model System. google
  • 118. Weiher E, Clarke GDP, Keddy PA 1998 Community assem-bly rules, morphological dispersion, and the coexistence of plant species. [Oikos] Vol.81 P.309-322 google cross ref
  • 119. Weishampel PA, Bedford BL 2006 Wetland dicots and monocots differ in colonization by arbuscular mycor-rhizal fungi and dark septate endophytes. [Mycorrhiza] Vol.16 P.495-502 google cross ref
  • 120. Wetzel RG 1975 Limnology. google
  • 121. Willby NJ, Pulford ID, Flowers TH 2001 Tissue nutrient signatures predict herbaceous-wetland community re-sponses to nutrient availability. [New Phytol] Vol.152 P.463-481 google cross ref
  • 122. Zedler JB, Simberloff D, Rejmanek M 2011 Wetlands. In: Encyclopedia of Biological Invasions P.698-704 google
OAK XML 통계
이미지 / 테이블
  • [ Fig. 1. ]  The role of macrophytes in wetland ecosystems. Plants are using the energy from the sun, CO2, water, and nutrients to produce biomass available to grazers. After senescence, the produced organic matter pro-vides organic C and nutrients to decomposers. Stems and leaves serve as conduit for gases, bringing oxygen rich air to rhizosphere and releasing methane.
    The role of macrophytes in wetland ecosystems. Plants are using the energy from the sun, CO2, water, and nutrients to produce biomass available to grazers. After senescence, the produced organic matter pro-vides organic C and nutrients to decomposers. Stems and leaves serve as conduit for gases, bringing oxygen rich air to rhizosphere and releasing methane.
  • [ Fig. 2. ]  Examples of annual aboveground net primary production by various types of macrophytes. Data for corn including one or two annual crops are given for comparison. NPP, net primary production.
    Examples of annual aboveground net primary production by various types of macrophytes. Data for corn including one or two annual crops are given for comparison. NPP, net primary production.
  • [ Table 1. ]  Examples of live and senescent tissue nutrients, and resorption efficiency in macrophytes from several regions
    Examples of live and senescent tissue nutrients, and resorption efficiency in macrophytes from several regions
  • [ Fig. 3. ]  An example of a community replacement following increased phosphorus, P, input into a P-limited marsh ecosystem; CBM, cyanobacte-rial mats.
    An example of a community replacement following increased phosphorus, P, input into a P-limited marsh ecosystem; CBM, cyanobacte-rial mats.
(우)06579 서울시 서초구 반포대로 201(반포동)
Tel. 02-537-6389 | Fax. 02-590-0571 | 문의 : oak2014@korea.kr
Copyright(c) National Library of Korea. All rights reserved.