Air pollutants clog urban cities; thus, it is difficult to judge the quality of the atmosphere with just a few com-ponents. In this case, we can judge air quality by analyzing the response of species to several air pollutants in con-sideration. In particular, epiphytic macrolichens on tree bark are excellent air pollution bioindicators. For exam-ple, they receive nutrition and moisture through the thal-lus surface, and they have long lives. They also are able to concentrate pollutants, because they do not have cuticles and deciduous parts (Nash 2008). Therefore, epiphytic macrolichens have been used as air pollution bioindi-cators since lichen extinction was first observed in Paris (Nylander 1866, cited in Hawksworth and Rose 1970).
Until the mid-late 20th century, many studies revealed that a high concentration of SO2 disturbs the growth of li-chens (Hawksworth and Rose 1970, Sugiyama et al. 1976, Eversman 1978, McCune 1988, Nimis et al. 1990). Results of these studies also indicated that lichen loss was con-spicuous near the city center or pollution sources. For ex-ample, 129 lichen species within 16 km of London became extinct between 1800 and 1970 (Laundon 1970). Con-versely, the number of lichen species tended to increase with distance from the city center. In a study in London, Rose and Hawksworth (1981) showed that areas in the atmosphere with SO2 > 0.04 ppm (120-130 μg/m3) were lichen deserts where lichen existence was impossible. Interestingly, lichens are recolonizing areas that used to be lichen deserts (Henderson-Sellers and Seaward 1979, Rose and Hawksworth 1981, Hawksworth and McManus 1989, Bates et al. 1990, Seaward 1997).
Although SO2 has decreased recently, nitrogen oxides (NOx) such as NO and NO2, and O3 have been increasing. The change in air pollutants has been accompanied by a decrease in
According to the first ecological study on Korean li-chens by Kim and Lee (1975), areas within 5 km of Gwang-hwamun (city center hereafter) were lichen deserts. By 1991, this area expanded to 15 km from the city center and coincided with areas that had an SO2 concentration > 0.01 ppm (Kim 1991). Considering the phytotoxic ef-fects of SO2 on lichens, their results revealed that air qual-ity in Seoul was quite poor from 1970-1980. However, the Clean Air Act was enacted in 1990, leading to a decrease in SO2 concentration in Seoul. Specifically, the concentra-tion has decreased after 1991 to < 0.04 ppm and has been maintained < 0.01 ppm since 1998 (Ministry of Environ-ment 2010). Assuming 0.04 ppm SO2 as a tolerance limit, it would take approximately 5 years for an epiphytic lichen on rocks such as
In Korea, lichen studies have been conducted on the distribution in relation to pollution centers (Lee et al. 1993, 1994, Yu et al. 1995, Chu and Kim 1998, Kim and Kang 2001), selection of bioindicator species in response to air pollution sources (Hur and Kim 2000), and taxo-nomic diversity (Park 1990, Ka et al. 1997, Moon 1998). However, the extent of lichen studies is very limited. Thus, analyses have not been conducted on whether lichens have established themselves in inner city greens (ICGs), and, if they have, what species have done so, what lichens exist outside the city, and what the species composition and richness are in comparison to Kim and Lee (1975). The spatial and temporal patterns of lichen distribution are critical data to set standards for Seoul’s atmosphere policy and for an overall evaluation of nature conserva-tion policy.
In this study, we attempted to solve the following ques-tions: 1) In Seoul, do species composition and richness differ between inner and outer city greens (OCGs)?; 2) Are there any changes in species composition and richness since the initial study conducted 35 years ago?; 3) Are the particular lichens’ temporal and spatial distributions re-lated to the level of SO2, NO2, or O3?
Seoul is located in the center of the Korean Peninsula (126°59" E, 37°34" N) and is 30.30 km long and 36.78 km across with a total area of 605.52 km2. The Han River flows through the center of the city, crossing in a west to east direction. Namsan stands close to the center of the city. Twenty-six mountains border the edge of the city (Seoul Metropolitan Government 2010). According to climate data (30 year average from 1971-2000), Seoul’s mean tem-perature is 12.2°C, relative humidity is 66.8%, yearly rain-fall is 1,344 mm, and yearly mean wind speed is 2.4 m/s (Korea Meteorological Administration 2001).
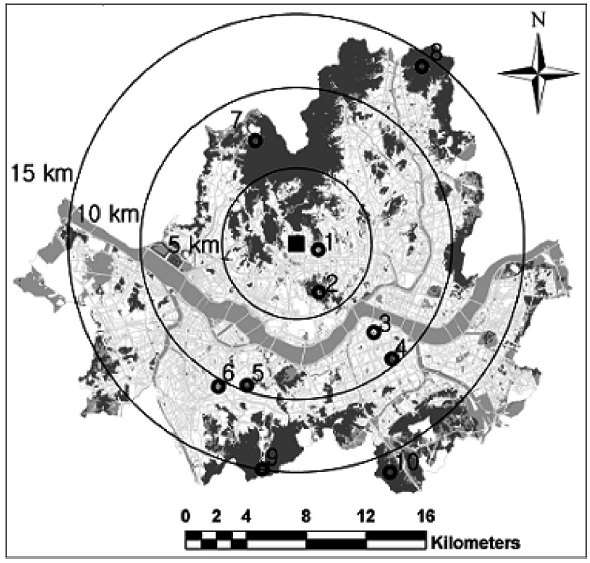
Lichen investigations were conducted in areas that matched the following three criteria: 1) green areas locat-ed 5, 10, 15, and 20 km from the city center; 2) areas that were formed long enough ago for lichens to have become established; 3) areas where studies have been conducted previously, so that temporal comparisons would be pos-sible. Consequently, we selected the following ten sites, six within and four outside a 10 km radius from the city center (Fig.1). Six ICGs (Boramae Park, Chandeokgung, Dosan Park, Namsan Park, Samnung Park, and Sangdo Park) were selected from parks and palaces with long histories of greens located in areas with a relatively high level of air pollution (Oh and Chung 2007). Four OCGs (Bukhansan, Cheonggyesan, Gwanaksan, and Suraksan)
were chosen from outer Seoul. Bukhansan is located within 10 km from the city center but is treated as an OCG because of its ecological value as a national park.
We collected epiphytic macrolichens on tree bark in May-June 2010. We searched entire trails for ICGs and in-vestigated trees on some of the hiking paths for the OCGs. We spent almost similar time sampling at each site. Sam-pling was conducted < 2 m from the ground, largely in the southern part of trees ranging from the southeast to south-west sides. ICG samples were taken from an average of 6.4 tree species per site, e.g.,
Specimens were identified based on exterior character-istics and a chemical composition analysis. We examined the thallus and reproductive structures and conducted chemical analyses following the color test (Nylander 1866), microcrystal tests (Asahina 1937), and thin layer chromatography (Culberson 1972).
Following LeBlanc and De Sloover (1970), we calculated the ecological index,
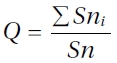
where
We obtained data on air pollutants (SO2, NO2, and O3) during the past 20 years (1989-2009; 1980-2009 for SO2) (Ministry of Environment 2010). Air quality monitor-ing in Seoul began at ten stations in 1989 but has been conducted at 27 stations since 1998. We used the data from the station closest to each site, and when there were two stations close to the same site (e.g., Changdeokgung and Namsan), we used the mean values. To determine whether significant changes occurred in air quality since 1989, we conducted paired
>
Lichen spatial distribution pattern
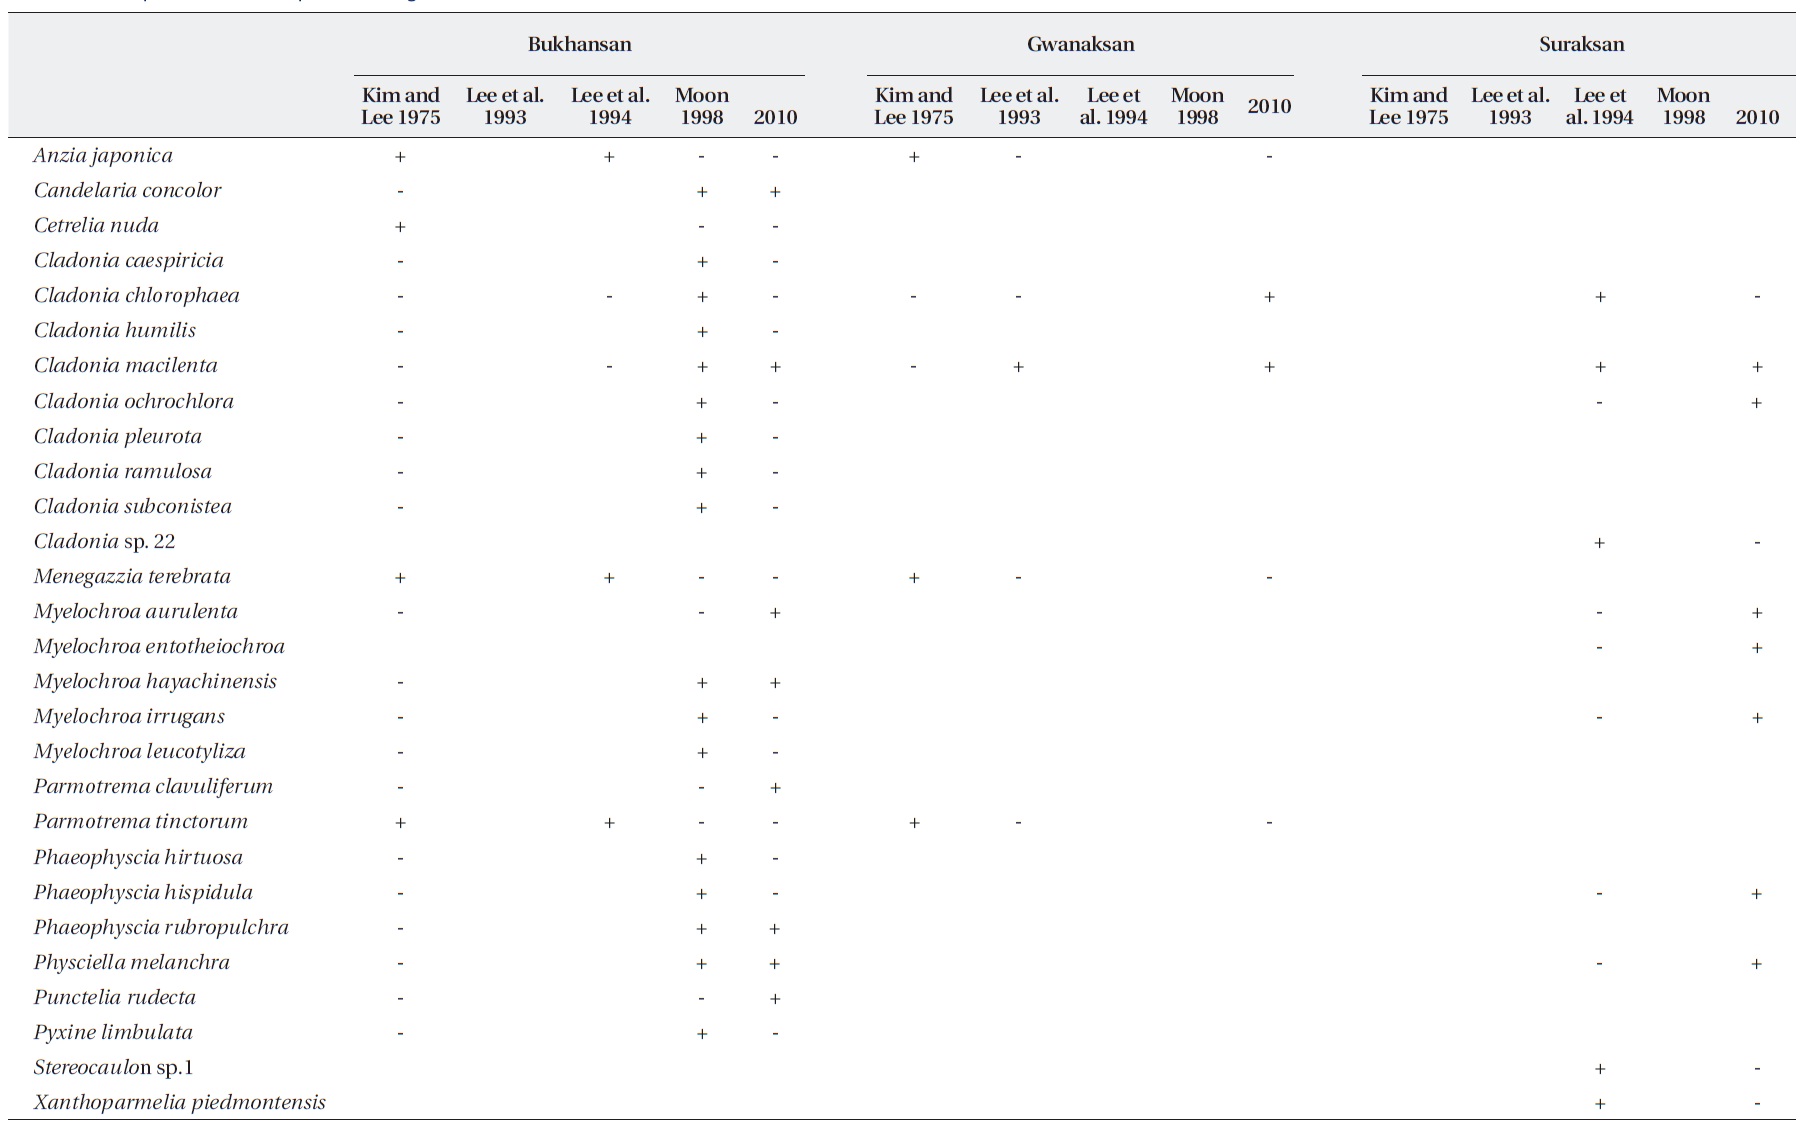
The 133 epiphytic macrolichens collected from ten sites were composed of four families, seven genera, and 13 species (Table 1). The 84 samples collected from six
[Table 1.] Lichen species and the number of lichen samples collected at each site in Seoul
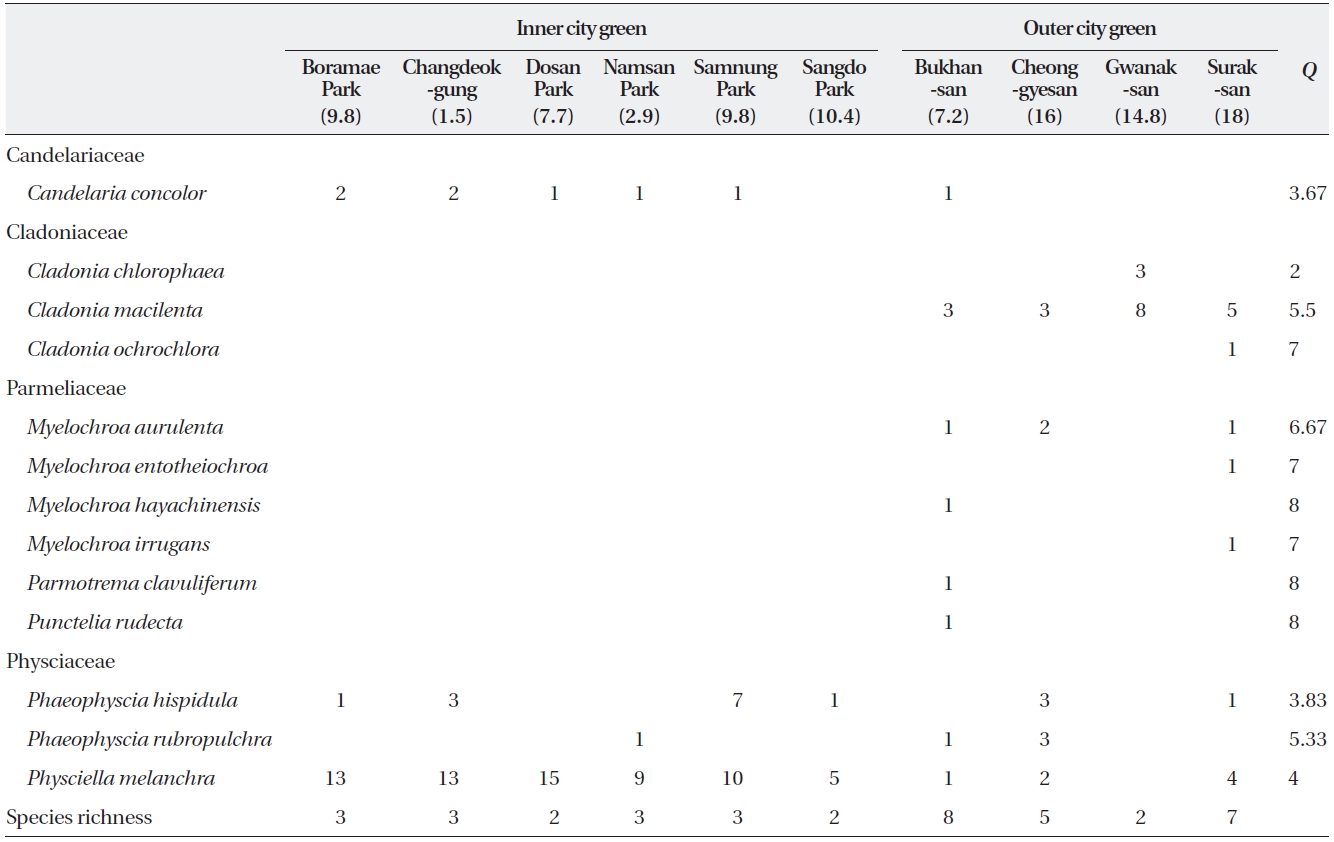
Lichen species and the number of lichen samples collected at each site in Seoul
ICGs were composed of four species from two families with a mean of 2.5 species per site (range, 2 to 3 species) and a mean of 21 samples per species. With the exception of
In the OCGs, there were 49 samples (13 species in four families) with means of 12 samples and 5.5 species per site (range, 2 to 8 species) and a mean of 3.8 samples per species. In addition to the two families observed in the ICGs, two additional families (Cladoniaceae and Par-meliaceae; three and six species each) were observed as well. Of these nine species,
naksan only had two congeneric species (
The abundance per site of the four most abundant spe-cies (
[Table 2.] Record of sites examined in lichen studies in Seoul since 1975
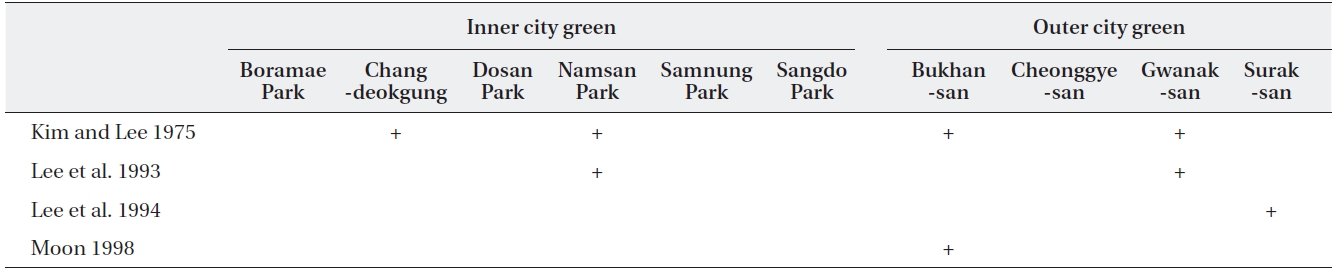
Record of sites examined in lichen studies in Seoul since 1975
8) than those found in both OCGs and ICGs (range, 3.67 to 5.33).
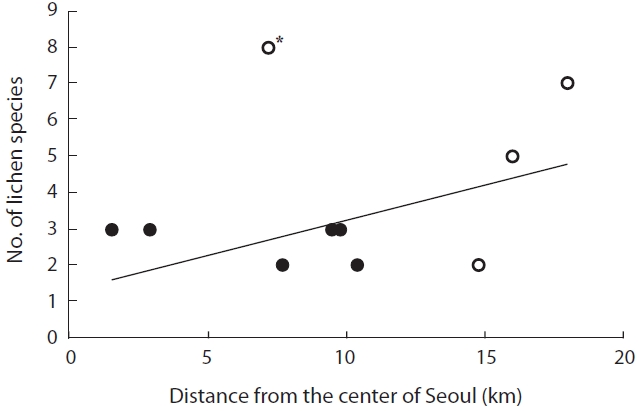
The distance from the city center was not significant-ly correlated with species richness (
>
Lichen temporal distribution pattern
Some of the ten sites examined in this study had also been studied in previous studies (Table 2). Three lichen species each were found in ICGs such as Chandeokgung and Namsan, which were previously lichen deserts.
>
Change in SO2, NO2, and O3 atmospheric concen-trations
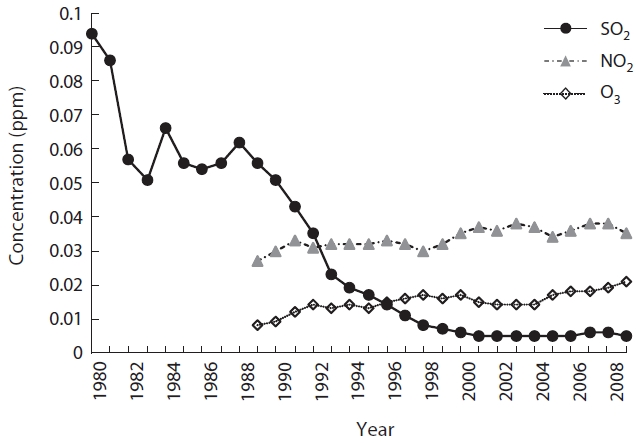
Fig. 3 shows that the mean concentrations of air pol-lutants in Seoul have changed greatly with time. SO2 was 0.094 ppm in 1980 but decreased drastically to 0.006 ppm after 2000, just 6% of 1980, and has been maintained at a similar level since that time. NO2 was 0.027 ppm in 1989 but increased 1.3 times by 2009 to 0.035 ppm. During the same period, O3 increased 2.6 times, from 0.008 ppm to
[Table 3.] Comparison of lichen species among studies conducted since 1975 at three sites in Seoul

Comparison of lichen species among studies conducted since 1975 at three sites in Seoul
0.021 ppm. Comparing data from the initial 3 years to the recent 3 years, SO2 was the only pollutant that decreased (paired
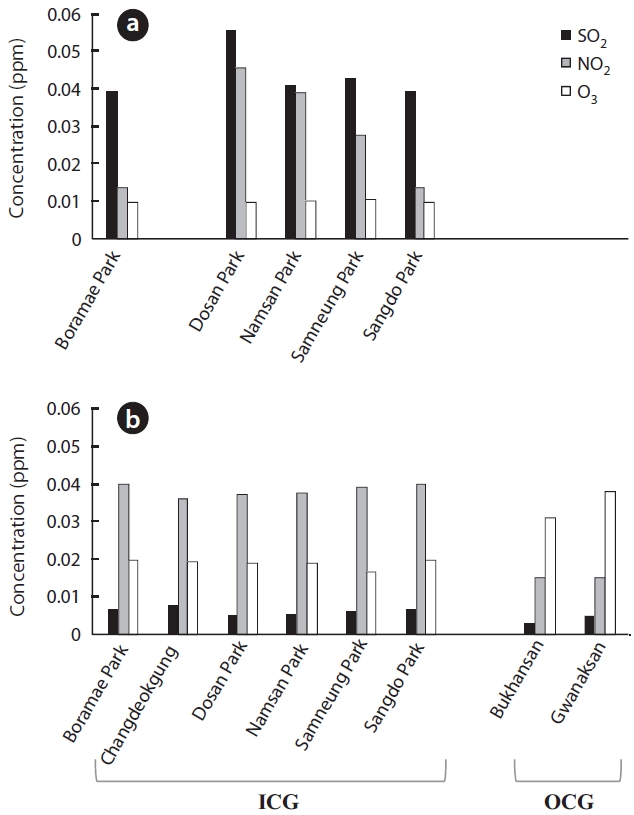
The recent 3-year mean concentrations of air pollut-ants differed slightly or considerably between the ICGs and OCGs (Fig.4 b). Regardless of green type, SO2 concen-tration decreased greatly compared to that in the 1980s. However, it was still slightly higher in ICGs than in OCGs (Wilcoxon two-sample test
This study examined the spatial and temporal changes in lichen distribution by reevaluating the first ecological research on Korean lichens (Kim and Lee 1975). Our re-sults showed that lichens have re-established themselves in ICGs of Seoul, which had been a lichen desert until 1991. However, despite the reestablishment of lichens in ICGs, these are more monotonous in terms of spe-cies composition and are lower in species richness than OCGs. For example, four species (2-3 species per site) were found in ICGs, whereas 13 species (5-8 species per site) were observed in OCGs, except for Gwanaksan. Con-sequently, OCGs such as Bukhansan, Cheonggyesan, and Suraksan possess twice higher species richness than that of the ICGs. An increase in species richness as distance from pollution sources increases has also been observed in other cities in Korea, e.g., Ulsan (Chu and Kim 1998), Yeochun Industrial Estate (Yu et al. 1995), Chongju (Kim and Kang 2001), and Samchonpo Thermoelectric Power Plant (Kim et al. 2004). However, it should be noted that there were significant differences in species composi-tion in the OCGs compared with those in previous stud-ies (Table 3). Such differences either may reflect that air quality is improving (Chu and Kim 1998) or that there is a difference in sampling intensity or species identification among studies. Unfortunately, the specimens from previ-ous studies were not stored; thus, it is impossible to dis-cuss these possibilities.
The distance from Seoul city center does not ac-count completely for lichen species richness. Although Bukhansan is very close to the city center, it exhibited a relatively higher level of species richness. If lichens are more abundant in old-growth forest than in young fo-rests, and in continuous rather than in fragmented forests (Marmor et al. 2011), we believe that Bukhansan, which is a national park, may provide sufficient habitat for a number of lichens. In contrast, lichen species richness in Gwanaksan was quite low in this study, which agreed with previous studies (Kim and Lee 1975, Lee et al. 1993). As all lichen samples in Gwanaksan were obtained from red pines, low species richness may reflect that red pines with strongly acid bark do not support diverse lichens.
Most lichens are very sensitive to air pollutants, par-ticularly SO2 (Hawksworth and Rose 1970, Sigal and Nash 1983, van Dobben and ter Braak 1998, Bates et al. 2001). However, as SO2 concentration decreases, lichen species re-establish themselves, whereas species that have a high requirement for sulfur such as
The increase in NOx, including NO2, influences many lichens. For example, since approximately 20 years ago, acidophilic lichens have been decreasing in the Nether-lands, most likely due to an increase in NOx or NH3 (van Dobben and ter Braak 1998, 1999, van Herk et al. 2003). When NO2 concentration is > 0.019 ppm only tolerant species survive, and lichen species richness will decrease further (Davies et al. 2007). In Seoul, yearly mean concen-trations of NO2 have increased by 1.3 times from 1989 to 2009, reaching 0.035 ppm. This is higher than the 0.019 ppm suggested by Davies et al. (2007) or the 0.03 ppm air quality standard in Korea. NO2 in ICGs contribute greatly to such a high NO2 concentration (3-year mean for ICGs and OCGs was 0.038 ppm vs. 0.015 ppm). Additionally, the speed at which NO2 increased was much greater in ICGs than in OCGs.
Tolerant species and/or nitrophilic species that belong to Candelariaceae, Physciaceae, and Teloschistaceae have been found in London (Davies et al. 2007). Four species belonging to Candelariaceae and Physciaceae were also found in Seoul in 2010. Of these four species,
Lichen species diversity decreases linearly with an in-crease in NOx (Davies et al. 2007). Increases in bark acid-ity (van Herk et al. 2003) or nutrient accumulation in bark (Davies et al. 2007) may contribute to a reduction in species diversity. In this study, four species abundant in ICGs comprised 101 of the 133 samples. If we assume that sampling efforts did not differ greatly at each site, such observations show that a few nitrophilic species are dominant in Seoul’s high NO2 environment. If acidophilic species are under stress of NH3 (Jovan and McCune 2005) or NOx (Larsen et al. 2007) deposition, acidophilic species in Gwanaksan such as
O3 is a secondary pollutant that is generated from a photochemical reaction between NOx and volatile organ-ic compounds (VOC) (Haagen-Smit 1952). The amount of O3 in Seoul has steadily increased from 0.008 ppm in 1989 to 0.021 ppm in 2009 but is still below the air quality stan-dard. Although Korea restricts O3 to a mean of 0.1 ppm/h or a mean of 0.06 ppm/8 h, other countries have addition-al restrictions limiting the number of days the two afore-mentioned means rise above these levels (Seoul Metro-politan Government 2010). Considering the destructive effects of O3 on health and ecology, similar rules may have to be implemented in Korea. In this study, we only consid-ered the yearly means of SO2, NO2, and O3 when analyzing the spatial and temporal patterns of lichen distribution. This is considered a limitation, because it is difficult to fully understand all the effects air pollutants cause with their yearly means, when their effects change seasonally and even daily. It is also notable that an increase in O3 was much greater in OCGs than in ICGs, which are exposed to a greater amount of automobile exhaust and other combustion activities (recent 3-year means, 0.019 ppm vs. 0.034 ppm). If the amount of biogenic VOCs (BVOCs) released by forests is 10 times greater (Middleton 1995) than anthropogenic petrochemical production and use, and BVOCs are more reactive than anthropogenic VOCs (Stockwell and Kuhn 1998), it is possible that OCGs in Seoul have a greater concentration of O3 than that of the ICGs. However, despite the importance of BVOCs to oxi-dizing power of the atmosphere and greenhouse gases and differences in BVOC emission among plant species (e.g., Lim et al. 2011), studies on BVOC in Korea are still in the initial stages. Although it is known that O3 level does not exert a great influence on lichen diversity (McCune 1988, Nali et al. 2007), several lichen species are sensitive to SOx, NOx, and O3 (Sigal and Nash 1983, Conti and Cec-chetti 2001, Lovett et al. 2009). For example, 0.1 ppm O3 causes a 50% reduction in photosynthesis of
The distribution of lichens in Seoul has changed greatly in the past 35 years. In this study, we have been able to de-duce the following three results. First, in 2010, the lichen composition and species richness were different between ICGs and OCGs in Seoul. Second, although the species composition was different, this study and previous stud-ies agree in terms of the linear trend between species rich-ness and the distance from the city center. Third, SO2 is no longer a limiting factor for lichen existence in ICGs and OCGs. Instead, NO2, whose concentration has steadily increased in the past decades, appears to affect species composition and richness. Unlike SO2 or NO2, O3 level was much higher in OCGs. However, we could not directly relate O3 to lichen distribution. Diverse approaches using fumigation experiments, factorial designs incorporating multiple pollutants at once, and long-term monitoring are necessary to identify the importance of lichens to an air quality rating system and to evaluate the health of ur-ban, and suburban areas, as well as forests.