Terrestrial ecosystems are some of the most impor-tant carbon pools, because they assimilate and store vast amounts of carbon. Thus, estimating CO2 sequestration by soil is particularly important in global change studies. Soils in terrestrial ecosystems contain more than 1,500 Pg carbon (Raich and Schlesinger 1992, Eswaran et al. 1993) and, hence, play an important role in the carbon cycle be-tween terrestrial ecosystems and the atmosphere. For this reason, various soil types in terrestrial ecosystems have been extensively studied (Schlesinger and Andrews 2000).
Forests are major carbon pools of the terrestrial carbon sink in temperate zones of east Asia. Cool temperate de-ciduous broad-leaved forest is broadly distributed in this region. Korea also includes temperate deciduous broad-leaved forests, which supply carbon to the soil through various types of litter. Despite that deciduous and mixed forests cover areas of 1.7 × 10⁶ and 1.9 × 10⁶ ha, respec-tively, and account for approximately 57% of all Korean forests (Son et al. 2004), there is insufficient information about CO2 efflux for the forest ecosystem. As a result, anal-yses of carbon cycle characteristics and parameterization for simulating carbon cycles in mountainous forest eco-systems has been restricted.
Soil respiration rate (Rs) is a very important factor that affects the carbon cycle in temperate forest ecosystems (Raich and Schlesinger 1992, Davidson et al. 1998, Law et al. 1999). Various types of organic matter such as leaves, stems, twigs, trunks, and root litter contribute to the soil carbon content in a forest ecosystem. Stored soil carbon is released into the atmosphere mainly through hetero-trophic and autotrophic soil respiration (Schlesinger and Andrews 2000, Lee et al. 2004, Jassal and Black 2006). The mechanism of carbon release from soil is intricately re-lated to various environmental factors.
Previous studies have found that Rs is strongly related to soil temperature (Ts) in various ecosystems (Lee et al. 2002, Wieser 2004, Mo et al. 2005, Suh et al. 2006). A tem-perature sensitivity factor, Q10, has been derived to de-scribe the Rs rate sensitivity with each 10℃ increase in Ts. As higher Q10 values indicate higher temperature sensitiv-ity in the absence of moisture stress, this factor is often used in global carbon budget models to simulate ecosys-tem respiration (Lloyd and Taylor 1994).
The pattern and magnitude of Rs is related to vari-ous environmental factors such as water but not Ts. Rs temperature sensitivity exhibits significant differences throughout the ecosystem (Liang et al. 2004), plant phe-nology (Yuste et al. 2004), topography (Ohashi and Gyoku-sen 2007, Tamai 2010), and litter accumulation. However, these studies indicate that Rs includes high spatial and temporal variations related to wide environmental com-plexity, but its dynamics are not well understood.
High resolution Rs data has been employed to accu-rately determine values and analyze the relationships between Rs characteristics and various events in differ-ent environments. Moreover, temporal and diurnal efflux mechanisms, as well as daily and seasonal trends in Rs related to environmental factors, have been considered for their important roles in simulating regional or global carbon cycle dynamics (Guan et al. 2006).
To comprehend the sophisticated parameters used to calculate the ecosystem carbon budget, it is necessary to confirm long-term datasets related to various environ-mental factors (Mo et al. 2005) based on those obtained in the non-continuous intermittent and short term such as one season or monthly datasets per one growth cycle. This information aids in analyzing high-quality correla-tions between Rs and environmental factors related to the rates and patterns of soil CO2 efflux.
Automatic opening/closing chambers (AOCC) are ad-vantageous, because they allow for short-term measure-ments with minimal disturbance to the surface under study. Furthermore, this system produces high-resolution continuous Rs datasets for an extended time.
To acquire these data, many automatic chambers have been previously used to measure Rs in other countries (Goulden and Crill 1997, Drewitt et al. 2002, Edwards and Riggs 2003, Liang et al. 2004, Suh et al. 2006, Joo et al. 2011). Continuous soil CO2 efflux data have been accu-mulated over the long-term in various forest ecosystems in many other countries. However, many studies were re-stricted in the evaluation such as annual soil respiration or simple seasonal changes using a portable measure-ment system in a Korean ecosystem (Son and Kim 1996, Lee and Moon 2001, Pyo et al. 2003, Kim et al. 2004, 2009).
Some researchers have attempted to introduce an automatic system into the Korean ecosystem. Suh et al. (2006) reported on a newly developed automatic mea-surement system using on electric motor. Lee et al. (2009) showed that Rs is significantly correlated with soil and air temperatures (Ta) but not with soil water in an apple orchard. Joo et al. (2011) reported that the amplitude of flux variations in the net ecosystem exchange is approximately 14% larger than those in soil CO2 efflux in a cool-temperate
The AOCC system carries several restrictions, although it can create high resolution datasets. For example, a sus-tainable electrical power supply and some level of electri-cal skill for maintaining the system are required. For these reasons, automatically measured datasets are severely restricted in the Korean temperate vegetation zone. As a result, more sophisticated analyses, using high resolution Rs datasets, are relatively rare in Korean ecosystems. Soil carbon flux data must be collected to evaluate and predict the carbon cycle in Korean temperate forests.
In this study, we examined the applicability of an auto-matic continuous measurement system in a Korean de-ciduous broad-leaved forest. We estimated the seasonal and annual amount of soil CO2 efflux and its character-istics based on a full growth season of data collected with automatic continuous measurements including the win-ter snow season.
The study area was Gwangneung Experimental Forest (37°45'25.37" N, 127°9'11.62" E 340 m a.s.l) of the Korea Forest Research Institute. This is a well-preserved, cool temperate forest located in Kyenggido Province in the west-central portion of the Korean peninsula. The vegeta-tion included old-growth, mixed deciduous broad-leaved forest protected from forest management activities, hu-man disturbance, and civilian access (Lim et al. 2003). This cool temperate deciduous broad-leaved forest is dominated by
>
Description of the soil chamber system
The AOCC system was developed based on the open-flow method and could be used for four seasons. During waiting status, the lid was positioned vertically allowing snow, rain, leaves, and twigs to drop into the soil surface and allowed normal drying and wetting of the soil surface in the chamber. This system provides a high quality Rs dataset related to various environmental factors for short and long-term based measurements with good time reso-lution (Suh et al. 2006).
The AOCC system is composed of three main parts that include a chamber system in addition to pumping and timer systems. To avoid air stagnation zones, the chamber is shaped as a long octagon with dimensions of 20 (length) cm × 30 (width) cm × 12 (height) cm. The di-mensions of the chamber were selected to exclude small plants that could lead to underestimating CO2 levels as a result of photosynthesis during the daytime.
Applying DC current to the motor opens and closes a 0.5-cm-thick acrylic lid. Two limit switches attached to the top frame cut power to the motor and lock the lid in a vertical position. The pump system consisted of an air pump (GD-6EA; Enomoto, Tokyo, Japan), a mass-flow me-ter (RK-1250; Kofloc, Tokyo, Japan), an air filter (TPF2000; TPC Inc., Seoul, Korea), a water trap (Perma Pure dryer, SWG-A01-18; Asahi Glass Engineering Co., Ltd., Chiba, Japan), and two infrared gas analyzers (IRGAs, LI-820; Li-Cor, St. Lincoln, NE, USA) to measure the CO2 concentra-tion at the air inlet and outlet. The IRGAs were calibrated with pure nitrogen gas (zero) and two span gas of 1, 507 μL/L (summer) and 507 μL/L (winter) at least once every 2 weeks. After calibration, differences in CO2 concentration between the IRGAs were within approximately 1 ㎛ol/mol to zero, 961, and 1,601 μL/L.
In our experiment, well-buffered ambient air collected from 30 cm above the soil surface was pumped into the chamber at a rate of 1.8 L/min from a buffer tank with an approximate capacity of 5 L. The pump supplied ambient air at the rate of 0.6 L/min to the IRGA, which was used as a reference CO2 value for calculating the difference in CO2 concentrations between the chamber inlet and out-let. This airflow rate was chosen based on LI-820 lab test results, which has a maximum flow rate of 1.0 L/min. Therefore, our selected airflow rate was deemed adequate for IRGA usage.
The timer system was constructed from a timer (H5CR; Omron, Tokyo, Japan) that controlled the opening and closing times of the chamber lid and included relays (G2A; Omron) that divided the electrical power supplied by the DC motor among the chambers. Additionally, the timer system controlled the opening and closing of sole-noid valves and data transmission from the IRGA to the data logger terminals (CR10X; Campbell Scientific, Inc., Logan, UT, USA). When the chamber was closed, the ab-solute CO2 concentration values at the air inlet and outlet were measured consecutively over a 20-min measure-ment period (Suh et al. 2006). All CO2 concentration data were logged in a data logger.
Four chambers were operated to generate continuous Rs datasets. The four chambers were installed consider-ing the kinds of litter supplied from the dominant species on September 15, 2003. The chambers were inserted ap-proximately 4 cm deep from the chamber base into the soil by cutting through the surface litter. Rs was collected in 24 datasets per chamber per day during 15 min per hour for each chamber.
Failed measurements occurred six times over the 2 years due to electrical failure, analyzer trouble, and data logging failure. The main failed measurement period was 64 days from January 15 to March 19, 2005 and when the IRGA was being repaired for 30 days from September 15 to October 15, 2005. During these periods, daily Rs values were calculated using the function from the relationship between Rs and Ts at 5 cm soil depth (Ts5). We collected continuous data for 2 years.
Rs (mg CO2 m-2 h-1) was calculated from the difference in the CO2 concentrations between the chamber’s air inlet and outlet by:
where
To collect annual Rs for each year, hourly mean Rs val-ues of the failed measurements were filled by exponential functions derived from all measured Rs of Ts5 for each year and from data seasonally separated from Rs and Ts. Each Rs evaluated in each exponential function was ex-amined for statistical significance. Each season was sepa-rated; spring from March to May, summer from June to August, autumn from September to November, and winter from December to February.
Diurnal changes in Rs and Ts were analyzed only dur-ing two periods for 10 days in May 19-28 (spring) and July 30-August 8 (summer) in 2005 to estimate the ability of short-term data taking on the continuous measurement system to temporal changes in environmental factors such as rain.
The annual Rs temperature response was estimated based on the exponential function Rs = R0eKTs, where Rs is the daily or hourly mean Rs at a Ts of 0℃; Q10, the tem-perature sensitivity of Rs; and Ts, the measured Ts5. Q10 was calculated by the factor reaction increase for an in-crease of 10℃ (Q10 = e10k), and
>
Measurement of environmental factors
Ts values were measured at depths of 0, 2, 5, 10, 20, and 30 cm with a T-CC thermocouple (0.32 mm; Ninomiya, Tokyo, Japan). Ts measurements are necessary to estimate annual Rs rates using a temperature-based Q10 model. Daily Ts from a temperature logger (HOBO TidbiT v2; Scottech, Hamilton, New Zealand) were used for gap fill-ing instilled at a 5-cm soil depth.
The Ta and air pressure for calculating Rs were mea-sured at a height of 30 cm above the soil surface using a thermocouple and temperature sensor (HOBO Pro RH/Temp; Scottech) installed in the radiation shell. Soil wa-ter content (SWC) was measured at depths of 0-30 cm at three points, and precipitation was collected with a rain gauge (RG2-M; Cole-Parmer, Raleigh, NC, USA). All data-sets were stored in a data logger (CR10X; Campbell Scien-tific Inc., Madison, WI, USA).
The Rs value distributions were tested for normality, and the data for each year was normally distributed. Cor-relation analysis and one-way analysis of variance were used to determine the relationship between measured Rs and environmental factors for each year and to test for significant differences among the annual and seasonal Rs values; 1) that the gap was filled with the exponential function derived from the annual (GA) or seasonally sepa-rated (GS) daily mean Rs and daily mean Ts collected dur-ing each season (spring, summer, autumn, winter), and 2) which was calculated using an exponential function derived from the annual (EA) or seasonally (ES) separated daily mean Rs and daily mean. Therefore, while directly measured Rs were included in GA and GS, EA and ES did not include the measured Rs. Multiple comparisons be-tween annual or seasonal values were tested at the 0.05 probability level.
All statistical analyses were conducted using MinTab Statistical Software (Minitab Inc., State College, PA, USA).
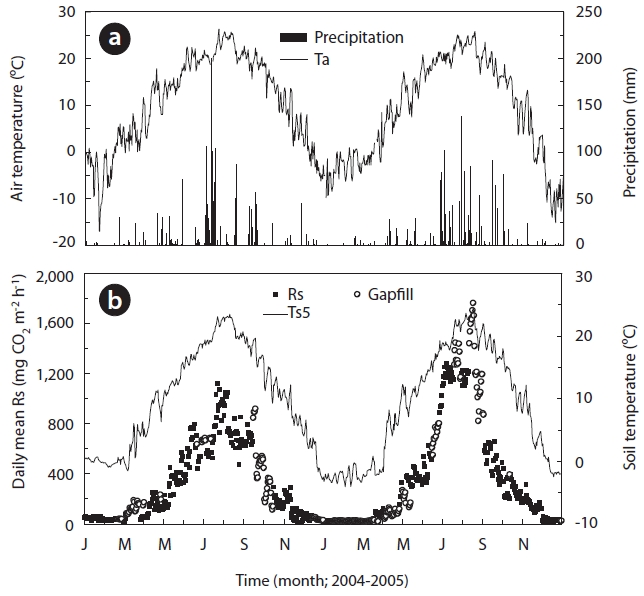
The annual precipitation was 1,789.1 and 1,745.3 mm in 2004 and 2005, respectively (Table 1 and Fig.1a). Precipi-tation was greatest during summer in both study years. The annual mean Ta measured at 0.3 m height above the soil surface was 10.6℃ in 2004 and 8.7℃ in 2005 (Fig.1a). The 1 year daily mean Ta ranged from -17.0℃ at the end of January to 26.2℃ in late June and from -15.1℃ at the end of December to 25.8℃ at the end of August 2004 and 2005, respectively (Fig.1a). The annual mean Ts5 was 10.1℃ in 2004 and 8.6℃ in 2005, respectively (Fig.1b). The mini-mum and maximum Ts5 ranged from -1.5℃ in March to 23.5℃ in early August 2004 and ranged from -3.5℃ at the end of January to 24.4℃ in mid August 2005, respectively.
>
Annual and seasonal soil CO2 efflux rate
Fig.1b shows the seasonal variation in Rs that was filled with values calculated with an exponential function de-

Various values of soil respiration and environmental factor in Gwangneung cool temperate deciduous broad-leaved in 2004 and 2005
rived from relationships between measured Rs and Ts5 for each year. Rs was moderate in the winter, from Decem-ber to March, increasing to a peak of approximately 1,300 mg CO2 m-2 h-1 in July, and then decreased in autumn. Rs showed the highest wave patterns during the summer and the lowest during winter. In the winter, Rs was 41.8
and 26.2 mg CO2 m-2 h-1 in 2004 and 2005, respectively, and Ts5 was 0.5 and -1.9℃ in 2004 and 2005, respectively. Ts clearly increased to 7.7 and 4.9℃ during spring in 2004 and 2005, respectively. Furthermore, Ts5 increased to 19.7 and 19.1℃ during the respective summers of 2004 and 2005. Rs in spring and summer increased to 173.3 and 684.4 mg CO2 m-2 h-1 in 2004, respectively. Additionally, Rs increased to 205.2 and 968.2 mg CO2 m-2 h-1 in spring and summer 2005, respectively. However, in the respective au-tumn seasons in the aforementioned years, Ta decreased sharply to 12.7 and 12.3℃, as did Rs to 310.4 and 311.7 mg CO2 m-2 h-1. These results indicate that the seasonal changing patterns in Rs undoubtedly depended on those of Ts5. This finding was particularly evident at a depth of 5 cm (Figs.1a and 2a), which was widely used in the expo-nential functions.
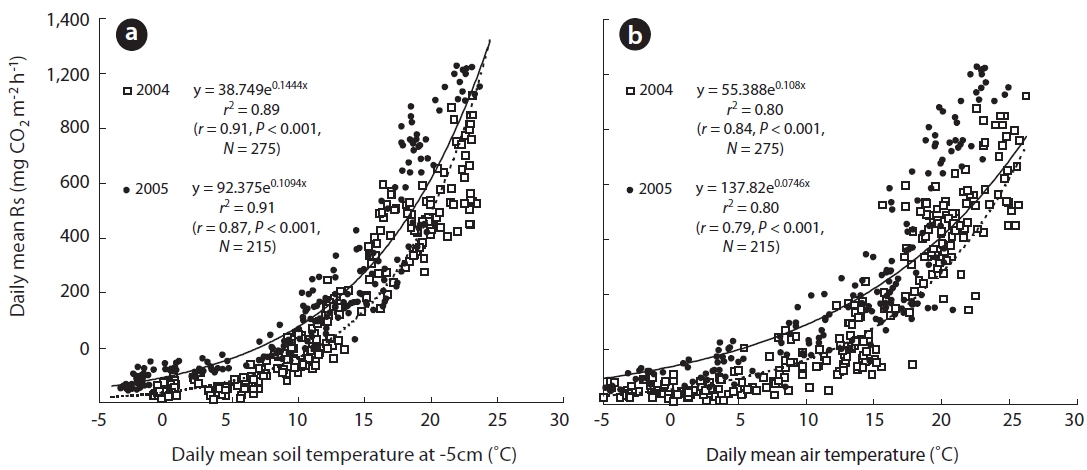
Previous studies have shown that the variation in Rs is strongly related to factors associated with Ts fluctua-tions (Liang et al. 2004, Joo et al. 2011). Temperature may explain up to 72-96% of the variation in Rs in temperate forests (Rey et al. 2002, Kang et al. 2003, Subke et al. 2003), and that any change in Rs is strongly related to fluctua-tions in Ts. Furthermore, Rs is strongly correlated with Ts in temperate forests (Mo et al. 2005, Suh et al. 2009, Bahn et al. 2010).
The approximate relationship between Rs and Ts5 is given by Eq. 1 (
Rs(2004) = 38.75e(0.1444Ts5) (1)
Rs(2005) = 92.38e(0.1094Ts5) (2)
Rs(2004) = 55.39e(0.108Ta) (3)
Rs(2005) = 137.82e(0.0746Ta) (4)
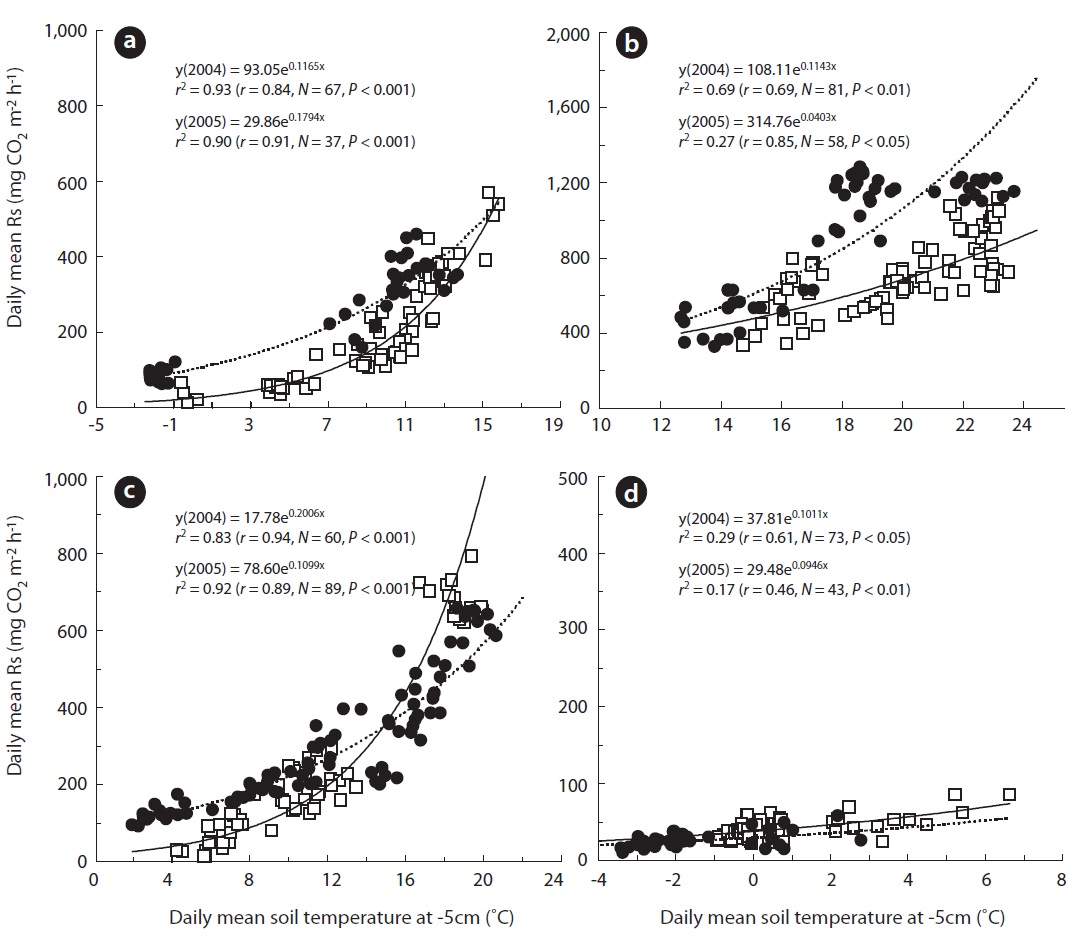
A seasonal analysis revealed that Rs, which is expressed as the daily soil carbon efflux, was significantly correlated with daily mean Ts5 (Figs.1b, 2a, and 3). In the two measurement years, Ts5 increased from -2.5 to 15.8℃ in the spring, and Rs also increased from approximately 13.0 to 568.0 mg CO2 m-2 h-1. Rs was strongly correlated with Ts and Ta in spring (Fig.3a). These trends are illustrated in Fig.3a, which shows that
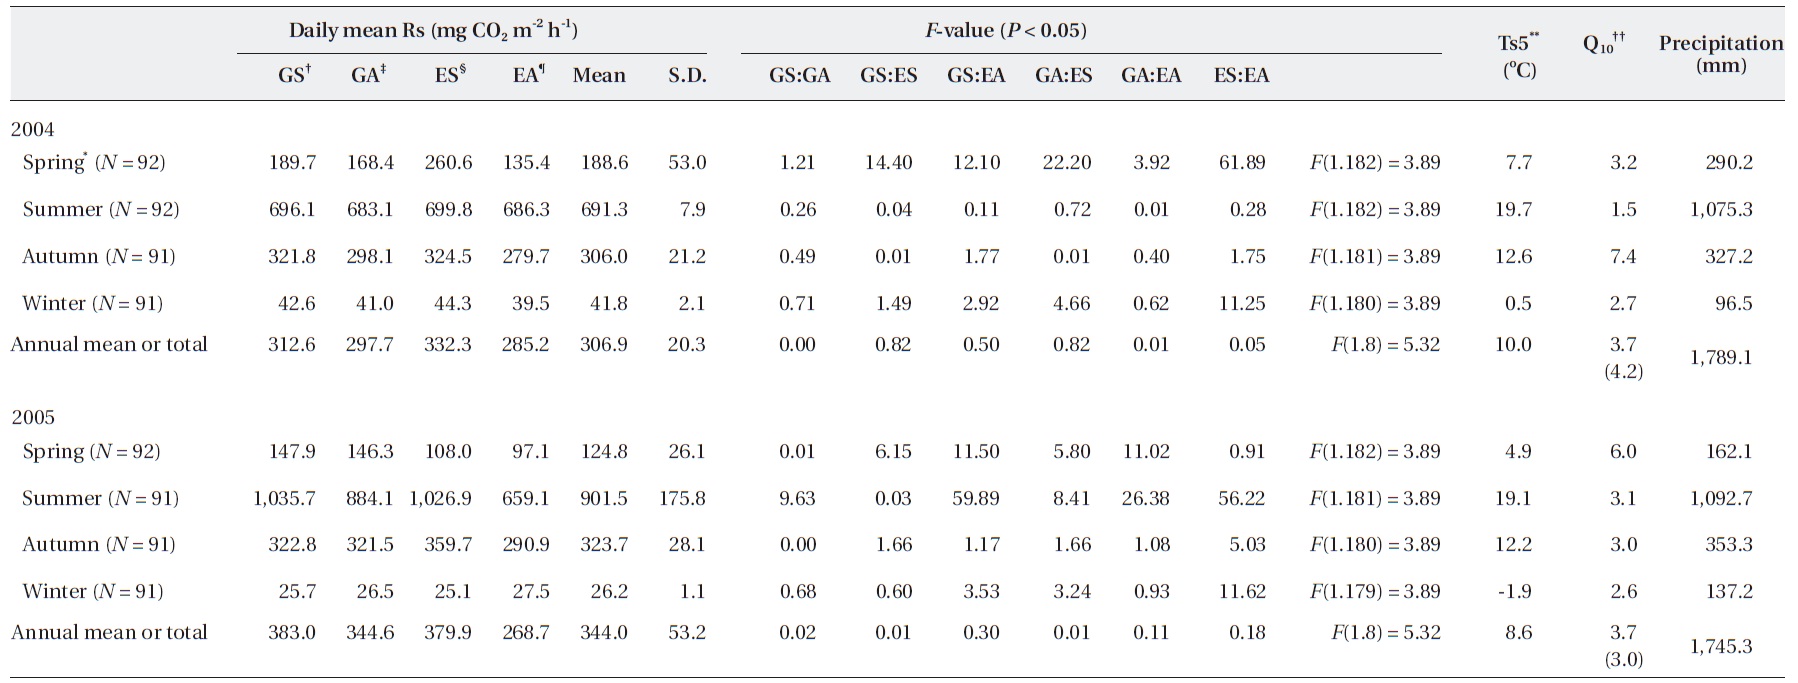
However, the annual Rs value was different according to the gap filling or estimating method, although the dif-ference was not significant. We assumed that the most ideal annual Rs value occurred when the gap was filled with a value calculated with a seasonally separated expo-nential function based on seasonal data (GS in Table 1).
The annual Rs estimated with EA was 285.2 (2,498.6 g CO2 m-2 y-1) and 268.1 mg CO2 m-2 h-1 (2,353.4 g CO2 m-2 y-1) in 2004 and 2005, respectively (Table 1). However, the annual Rs values, with the gap filled with data using the exponential function derived from Ts5 and Rs collected in each season, were 312.6 mg CO2 m-2 h-1 (2,738.1 g CO2 m-2 y-1) in 2004 and 383.0 mg CO2 m-2 h-1 (3,355.1 g CO2 m-2 y-1) in 2005 (GS in Table 1). In the case of GA, the annual Rs values were 297.7 (2,607.5 g CO2 m-2 y-1) and 344.6 mg CO2 m-2 h-1 (3,018.9 g CO2 m-2 y-1) in 2004 and 2005, re-spectively. Also, the annual Rs values calculated with ES were 332.3 (2,911.0 g CO2 m-2 y-1) and 379.9 mg CO2 m-2 h-1 (3,328.0 g CO2 m-2 y-1) in 2004 and 2005, respectively. Al-though no significant differences were observed between annual values, the seasonal values showed significant dif-ference in some cases.
In the summer of 2005, annual Rs was significantly higher in GS compared with that in GA and EA. GS was significantly lower compared to ES but higher than EA in spring in 2004 (
Although no significant difference was observed be-tween the estimated annual Rs (
Over all, the mean annual Rs was about 2,851.3 g CO2 m-2 y-1 and ranged from 2,426.0 to 3,229.5 g CO2 m-2 y-1, according to calculation or gap filling methods. These val-ues were relatively lower than those reported in a previous study for a Korean temperate forest. Annual Rs in portable temporal measurements sometimes employed presump-tion absence data in winter or the rainy season. In this study, these findings may have been observed because data were collected for a restricted period under relatively favorable conditions.
Several studies have been conducted on Korean tem-perate forests. Lee and Moon (2001) estimated an annual mean Rs of 6,964 g CO2 m-2 y-1 in a
Raich and Schlesinger (1992) reported that the annual soil CO2 efflux is 1,943.0-5,133.4 g CO2 m-2 y-1 in a temper-ate broadleaf and mixed forests at 34-38° latitude. The medium value of the mean soil CO2 efflux calculated by Raich and Schlesinger (1992) was 2,374.8 g CO2 m-2 y-1 in a temperate forest, which was relatively lower than that collected in our study. One explanation for this result is that our study site was an 80-100-year-old forest (Chae et al. 2003, Suh et al. 2006).
In contrast, the temperature sensitivity of Rs, com-monly referred to as Q10, has been the general focus of many studies, and Ts is typically a reliable predictor of Rs, except under severe drought conditions (Moncrieff and Fang 1999). The Q10 values from spring to winter cal-culated from each season's dataset were 3.2, 1.5, 7.4, and 2.7 in 2004 and 6.0, 3.1, 3.0, and 2.6 in 2005, showing high fluctuations within each season (Table 1).
However, the Q10 calculated with the annual full growth season data was 4.2 and 3.0 in 2004 and 2005, respectively. Annual values between years showed some differences compared to the annual data. When Q10 was calculated with only three growth seasons from spring to autumn, without considering the winter season, which is some-times absent in temporal measurements, the value was the same at 4.03 in 2004 and 2005, respectively, which was higher than the four-season mean.
Q10 derived from the exponential functions, referred to as daily Rs, was 4.2 and 3.0 in 2004 and 2005, respectively (Table 1). An exponentially linear relationship between Q10 and temperature is generally acknowledged (Bekku et al. 2003, Zhang et al. 2009). A Q10 value of 2-4 is considered typical for forest soils in which the temperature ranges from 10-25℃, whereas higher values are observed when the temperature is 0-10℃ (Kirschbaum 1995). Moreover, an average Q10 of 2.4 for Rs has been suggested (Raich and Schlesinger 1992). In this study, individual values were 4.2 and 3.0 in 2004 and 2005, respectively (Table 1). These values exceeded the previous typical value by 1.2. How-ever, several studies have determined that Q10 has annual and seasonal variations. Those studies indicated that the variation in Rs under field conditions is very low at low Ts and high at high Ts (Frank et al. 2002, Jia et al. 2006). Moreover, Q10 varies with seasonal changes due to factors such as leaf phenology, root growth, and the microbial population (Mo et al. 2005, Bahn et al. 2010). Therefore, long-term measurements under various environmental conditions are required for a more accurate estimate of Q10. We can understand the Rs mechanism from the avail-able data, including relationships between parameters. Therefore, a temperature sensitivity evaluation is needed that includes winter season datasets.
>
Diurnal change in soil respiration
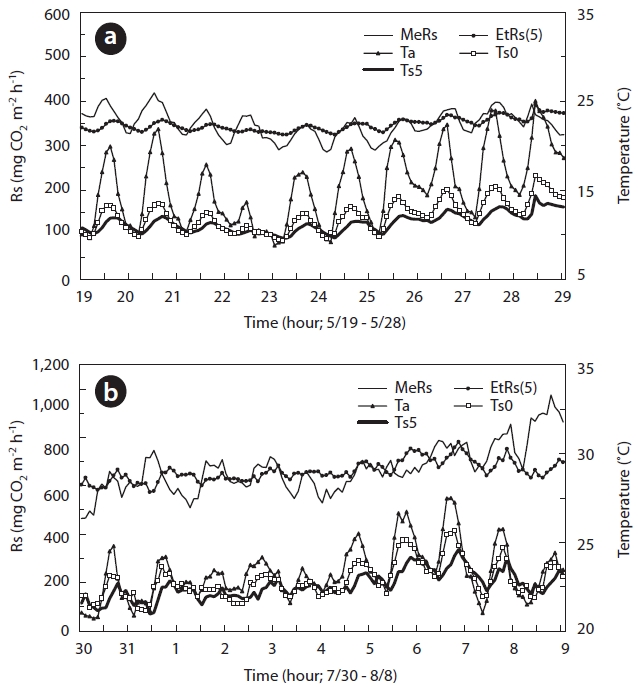
The relationship between Ta and Ts at 0, 2, 5, 10, and 20 cm was determined for periods spanning several days in
sumspring and summer (Fig.4a and 4b). Rs, expressed as the hourly soil CO2 efflux, clearly exhibited diurnal variation during some days in the spring (May 19-28) and summer (July 30-August 9) seasons. In the spring, the diurnal pat-tern of CO2 efflux fluctuated by about 90 mg CO2 m-2 h-1. However, the value was higher in the summer at approxi-mately 160 mg CO2 m-2 h-1. At that time, Ta and Ts showed clear changes in wave patterns. The range of change was higher in Ta and surface Ts than that in deep soil.
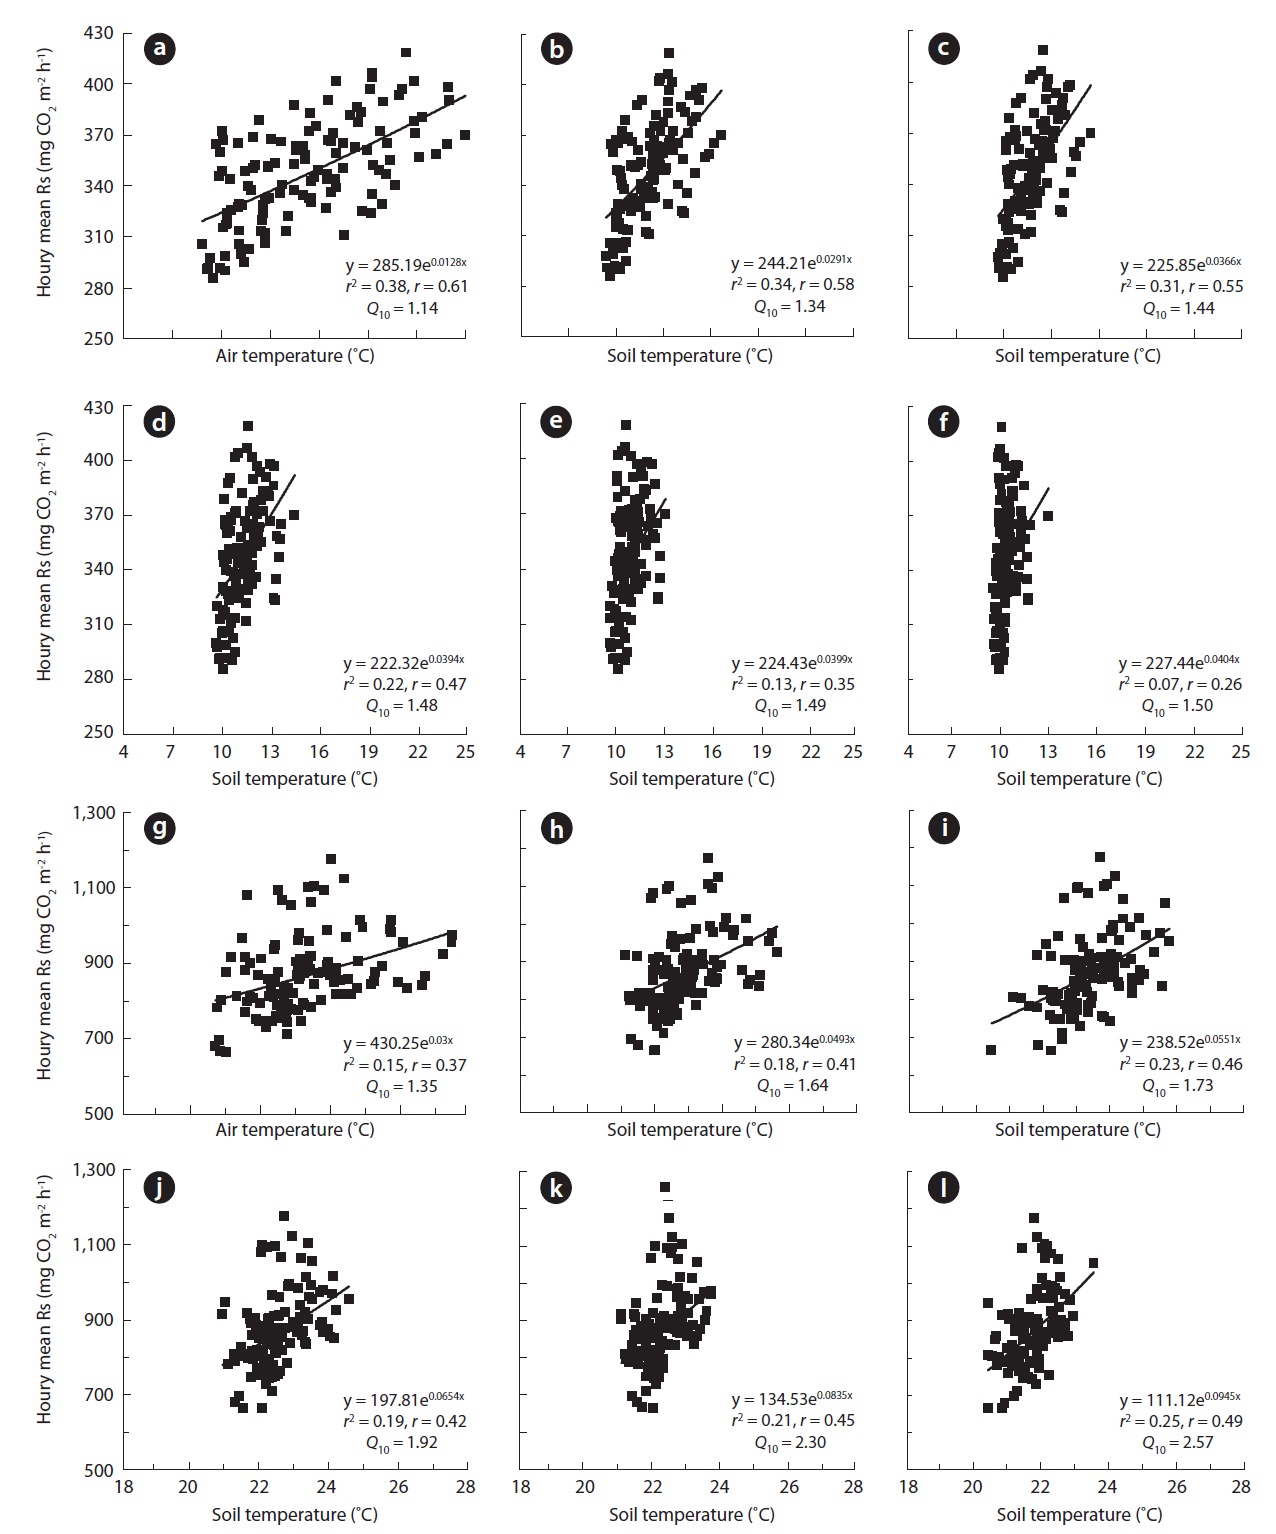
Fig. 5 shows the results for the relationship between Rs, Ta, and Ts at soil depths of 0, 2, 5, 10, and 20 cm in 2005. In the 2005 spring season, the diurnal change in Rs correlated more strongly with Ta (
The diurnal Q10 based on Ta and Ts was calculated for periods of several days in the spring and summer seasons. The calculated diurnal Q10 values were unreasonably low, with an average of 1.40 over the range 1.14-1.50 in the spring and an average of 1.92 over the range 1.35-2.57 in the summer.
The diurnal Rs patterns were nearly regular, producing a wave in both spring and summer seasons (Fig.4). Addi-tionally, Rs fluctuated with changes in Ta and Ts. Overall, the regression analysis indicated relatively lower correla-tion coefficient values (
The Q10 derived from Ta and Ts increased with soil depth (Fig.4). A similar trend was observed in previous studies. Mo et al. (2005) described that Q10 derived from the relationship between Rs and Ts at various depths increased from 3.8 at -1 cm to 5.5 at -50 cm in a temperate forest in central Japan. These researchers suggested that the Ts at -50 cm may not be as effective for predicting Rs in temperate forests as that observed at a more shallow depth (0-20 cm). Savage et al. (2009) reported that the depth at which Ts measurements are performed clearly affects the calculated diurnal Q10, which is used to calculate the regression.
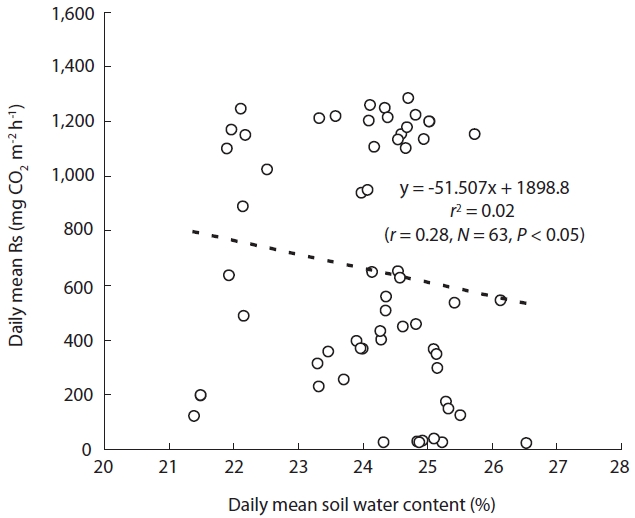
The relationship between Rs and the SWC was analyzed with 1-year data in 2005, because a soil water sensor was installed that year. Moreover, because Rs and Ts are cor-related, CO2 efflux may be depressed by low temperatures during winter. Therefore, we used only the data for the summer season in our analysis of Rs-SWC relationships. Rs showed a weak correlation with SWC for the summer (
Although Rs showed a clear correlation with Ts (
during the so-called Jangma in Korea (Joo et al. 2011). Rainfall during the main growth from June to September accounted for 73.0% (1,306.5 mm) and 82.7% (1,266.5 mm)
of the annual rainfall in the study area in 2004 and 2005, re-spectively (Fig.1a). From these results, it was determined that the SWC was sustained at an approximate average of 24.1% (Fig.6), although some SWC data were absent. Therefore, because the study area received sufficient pre-cipitation to provide stress-free moisture conditions, the relationship between Rs and SWC may not have been re-vealed.
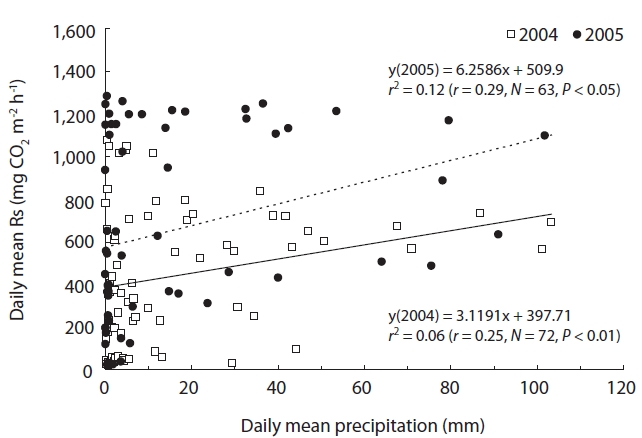
Fig. 7 shows the relationship between Rs and precipita-tion. Rs showed a confounding correlation with precipita-tion for the full growth season (
>
Application of the continuous system for Rs measurements
Functions relating soil CO2 efflux and environmental factors and the various related parameters helps in un-derstanding and predicting soil carbon cycle evolution. However, the task is daunting, because the material cycle is affected by various environmental factors in the ecosys-tem. Collecting Rs data is generally restricted by various factors such as weather and field conditions (Son and Kim 1996, Kang et al. 2003, Yi 2003, Moon 2004). In particular, measurements in the winter season are impeded by fac-tors such as a relatively low Rs and working conditions that are harsher than those during other seasons. For these reasons, the annual mean Rs or the total amount of soil CO2 efflux in this study was inaccurately estimated from the use of exponential functions, or this value could not be calculated because of insufficient data for the win-ter. However, the AOCC system helped collect data under various environmental conditions. Therefore, use of this system affords more sophisticated results than those ob-tained by the temporal periodic measurement method (Suh et al. 2006).
Although the AOCC system automatically collects continuous data onsite, field conditions may make accu-rate data collection difficult. Unpredicted events such as abrupt heavy rain or snow, felled trees, and power failures can result in the absence of data. Data collection frequen-cy (used for elucidating different relationships) collected by the AOCC system under various environmental condi-tions was higher than that obtained with a portable sys-tem, although several accidents occurred when using the system. The characteristics in the annual and seasonal datasets were analyzed by comparing Rs values and en-vironmental factors.
We used the AOCC system to collect adequate continuous data to analyze the relationship between Rs and seve-ral environmental factors. The results indicated that nor-mal Rs values under various forest conditions cannot be obtained by intermittent measurement systems. Annual Rs can be underestimated because direct measurements in winter are often restricted by various factors. However, soil CO2 efflux during the dormant season ranges from 10% to 50% of the total annual Rs (Mariko et al. 2000, Brooks et al. 2005, Schindlbacher et al. 2007, Wang et al. 2010).
A simple instrument such as a manually operated por-table system was used to obtain normal values such as magnitudes of annually emitted amounts. However, to understand certain characteristics such as seasonal varia-tions and to estimate annual magnitude for the reference respiration of soil CO2 efflux in several ecosystems, it is necessary to introduce a parallel continuous measure-ment system into an existing temporal measurement.


![Diurnal variations in soil respiration rate by measuring Rs (MeRs) and estimated Rs (EtRs[5]) air temperature (Ta) and soil temperature at 0 cm (Ts0) and 5 cm (Ts5) depths: (a) diurnal variations during the spring season May 19-31 2005 and (b) in the summer season July 30-August 9 in the same year.](http://oak.go.kr/repository/journal/11080/STHHCL_2011_v34n4_411_f004.jpg)