Typha angustifolia has ecological characteristics of clonal growth similar to Phragmites australis. The plant spreads by clonal growth and seed dispersal. In this study, for the three stands which have different settlement age at the Baksilji wetland in Korea, genetic diversity was estimated by random amplification of polymorphic DNA analysis to evaluate the change in genetic diversity of T. angustifolia during stand development in the same population. Stand (ST) 1 was the old-est and ST 4 was the youngest. ST 5 was in a small ditch out of the Baksilji. Although the ST 1, ST 2, and ST 3 did not differ significantly in vegetational or physical environment, the genetic diversity estimated according to Nei’s gene diversity (h) and the Shannon index (i) increased in the order of ST 1 < ST 2 < ST 3 contrary to formative age. The genetic diver-sity of ST 4 was much higher than that of the other three stands. ST 4 has similar abiotic environmental conditions with slight T. angustifolia dominance, and seems to be in the early establishment stage. ST 5 differed from the other stands in vegetational and soil environments, which can result in stressful cattail conditions. Even though the ST 5 stand was not younger than the ST 4 stand, ST 5 showed the highest genetic diversity. Our results indicate that after early settlement of the T. angustifolia population, genetic diversity within the species decreased over time and that the decreasing pattern of genetic diversity within T. angustifolia stands is not likely to occur under stressful conditions.
Genetic diversity is a fundamental source of biodi-versity (Hughes et al. 2008). Knowing the distribution of genetic variation among individuals and populations is important for evaluating the attributes of plant species, especially in rare species (Williamson and Werth 1999, Reed 2007, Hughes et al. 2008). The distribution of genetic diversity is dependent on life history and other ecologi-cal factors (Loveless and Hamrick 1984). Further, genetic diversity may be inflenced by several ecological factors (Hangelbroek et al. 2002). Many studies have examined the relationship between interspecific or intraspecific competition and genetic diversity (Gustafson et al. 2002, Vellend and Geber 2005, Vellend 2006, Lankau and Strauss 2007, Roscher et al. 2008, Sanders 2010). Genetic diversity has important ecological consequences even for a single generation (Hughes et al. 2008). Further, environmen-tal heterogeneity influences genetic variation (Prati and Schmid 2000, Pluess and Stocklin 2004). Genetic diversity allows clonal plants to adapt to variable habitat condi-tions. The response of
Cattails (
However, the genetic diversity within a population de-creases due to drift, selection, and population subdivision (Harnett and Bazzaz 1985, Lacy 1987). As for
Although many studies have been performed on cattail genetic diversity, such as the spatial distribution of genet-ic diversity, interspecific comparison of genetic diversity, and the potential for interspecific hybridization (Keane et al. 1999, Selbo and Snow 2004, Tsyusko et al. 2005, Till-Bottraud et al. 2010), few studies have been conducted on genetic diversity changes during the development of sub-divided cattail stands. Therefore, in this study, the extent and differences in genetic variation among
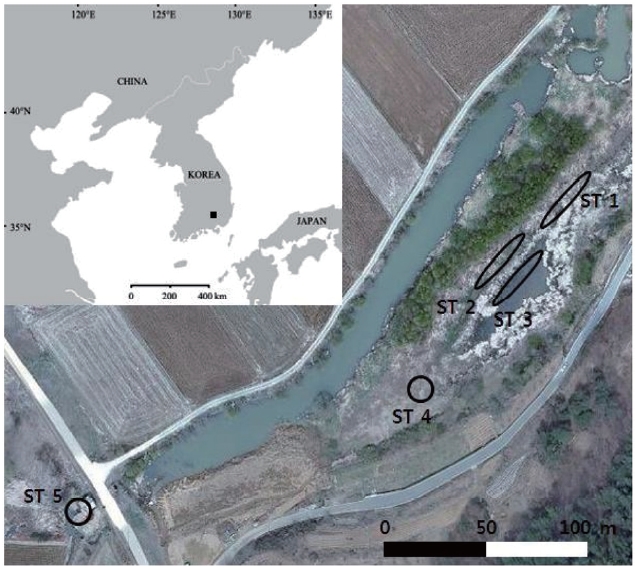
The sampling sites were chosen at Baksilji wetland in the southeast part of the Korean Peninsula (35°31´ N, 128°7´ E), where five stands of
At each stand, we established three randomly dis-tributed 1 m2 quadrats and measured the coverage and abundance of all plant species in June 2011. Relative cov-erage of
Relative coverage = cover of species/total cover
H' = -Pi log Pi (Pi = number of species i/total number)
Soil was collected from the surface to a depth of 5 cm at each stand site. Soil was passed through a 2-mm sieve to remove large organic matter and pebbles. Soluble PO4-, NO3-, NH4+, and fresh water moisture content in the fresh soil were measured. Organic matter, air-dry moisture, pH, and conductivity were measured after the soil was air-dried in the lab. Soluble PO4- was extracted using Bray No. 1 solution (Bray and Kurtz 1945) and measured colorimet-rically using the ascorbic acid reduction method (Solor-zano 1969). Soluble NO3- and NH4+ were extracted using 2 M KCl solution and measured colorimetrically using the hydrazine and indophenol method (Kamphake et al. 1967, Liddicoat et al. 1975). The water content was deter-mined after the samples were dried at 105℃ in an oven for 24 h, while the organic matter content was calculated as the loss on ignition after the samples were kept in a muffle furnace at 550℃ for 4 h (Boyle 2004). Soil pH and conduc-tivity were measured in mixed soil and distilled water at a 1:5 ratio using a pH meter and conductivity meter.
Linear transects were set at stand sites ST 1, ST 2, and ST 3. Sixteen fresh leaves were collected at 2-m intervals along a 30-m line transect; thus, 48 leaves were sampled. Eight leaves from ST 4 and ST 5 were sampled at 2-m in-tervals. ST 1, ST 2, and ST 3 leaves were sampled in July 2010, whereas the other two sites’ leaves were sampled in November 2010. These samples were stored at -20℃ until the DNA extraction was performed.
Total genomic DNA was isolated using a G-spinTM llp Genomic DNA Extraction Kit (For Plants; Bioneer, Seoul, Korea) according to the manufacturer’s protocol. Poly-merase chain reaction carried out using 41 random oli-gonucleotide primers (N-8001 to -8010, N-8041 to -8050, N-8071 to -8083; Bioneer). Amplification was performed using AccuPower PCR premix (Bioneer) in a total reaction volume of 20 μL containing 1 μL of DNA (1 ng/μL), 1 μL of primer (10 pmol), and 18 μL of distilled water. Five prim-ers were selected for band polymorphism analysis (Table 1). The amplification reaction began with 2-min DNA de-orgnaturation at 94℃, followed by 28 cycles for 45 s at 94℃, 45 s at 34℃, and 1 min 35 s at 72℃. The final extension step was at 72℃ for 2 min.
The amplified products were separated in 1% agarose gels using a 1-kb ladder. Gels were stained with ethidium bromide and then run in 1× TAE buffer for 20 min at full voltage. Band pattern was determined using UV light and recorded by binary character matrix marked with a 1 for presence or a 0 for absence.
The number and percentage of polymorphic loci deter-mined by Nei’s gene diversity (h), Shannon’s information index (i), and genetic distance were computed using soft-ware Popgen32 (Yeh and Boyle 1997). One-way analysis of variance (ANOVA) was applied to test significant differ-ences among the five sites.
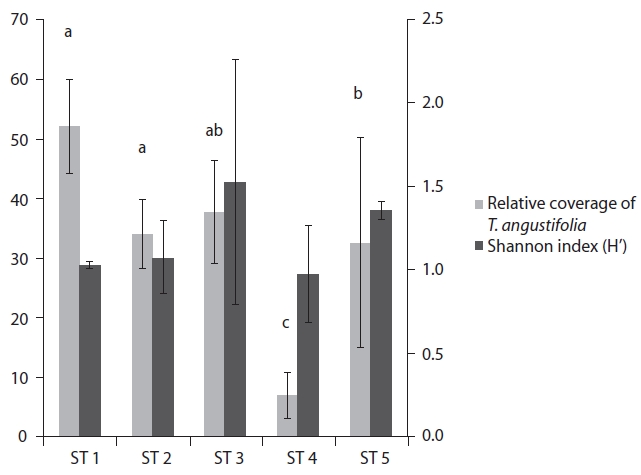
The range of Shannon index in the five stands was 0.97-1.52, and relative coverage of
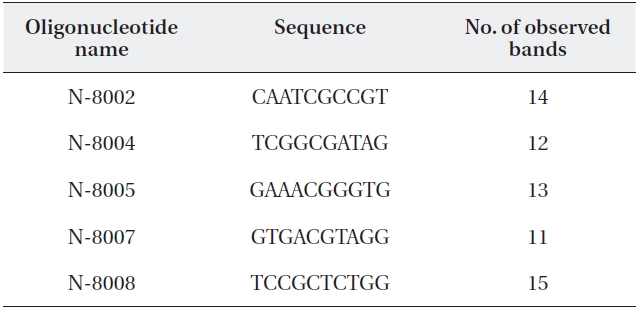
Random amplification of polymorphic DNA (RAPD) primer se-quences and number of amplified RAPD fragments
[Table 2.] Plant species and relative coverage of each site
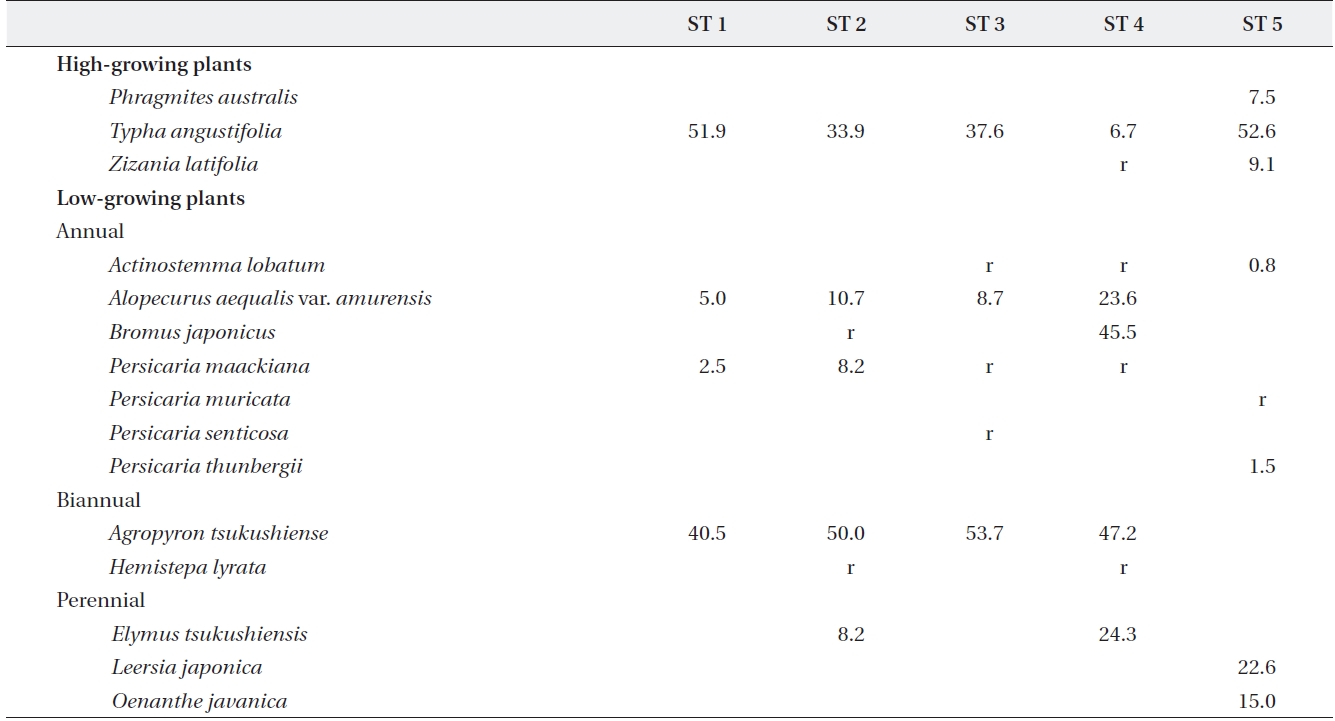
Plant species and relative coverage of each site
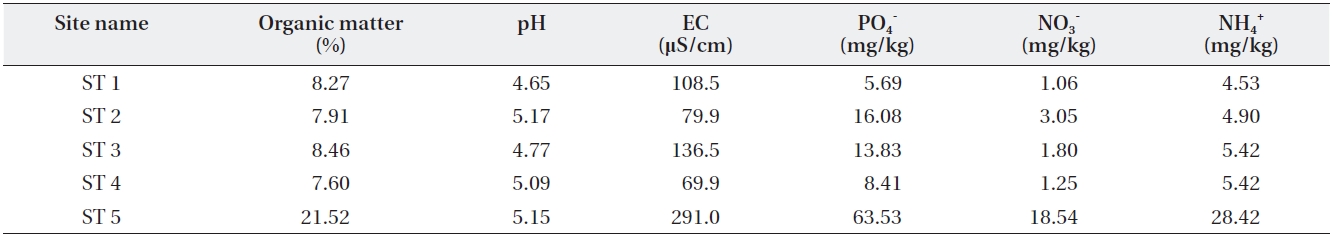
[Table 3.] Soil characteristics of the sampled sites

Soil characteristics of the sampled sites
Four other sites appeared to share similar soil char-acteristics, but ST5 relatively higher soil environmental variable values except for soil pH (Table 3). This indicates that
>
Genetic diversity of T. angustifolia stands
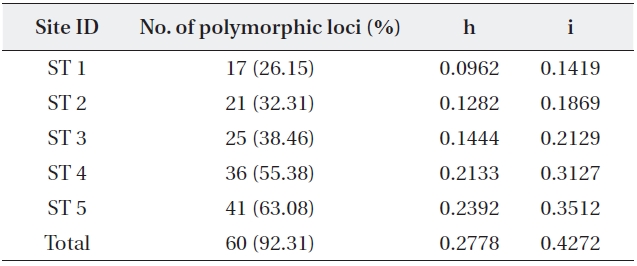
The five primers chosen generated a total of 65 dif-ferent banding positions, 60 of which were polymorphic (92.31%) (Table 4). The mean proportion of polymorphic loci of the five stands of
mined by Nei’s gene diversity (h) and Shannon’s informa-tion index (i) for the five stands were 0.2778 and 0.4272, respectively. The highest genetic diversity values were ob-tained in ST 5, which showed the most different environ-ment in terms of water level and soil characteristics. The other four stands also varied significantly in genetic diver-sity: the older the stand, the higher the genetic diversity.
>
Genetic distance among T. angustifolia stands
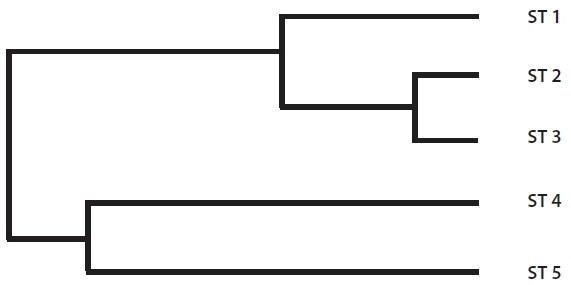
The range of Nei’s genetic distance among the five sites was 0.0694-0.4274 (Table 5). The pairwise genetic distanc-es in ST 1, ST 2, and ST 3 were relatively low as expected based on their geographically close position. However, even though ST 4 was located close to the above three

Five stand estimates number of samples number of polymor-phic loci and percentage Nei’s (1973) gene diversity (= h) Shannon index (= i)
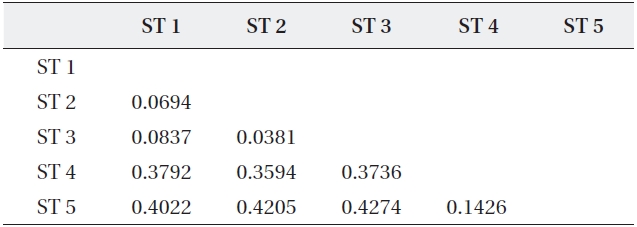
Coefficients of genetic distance for pairwise comparison of five sites of Typha angustifolia
sites, the genetic distance between ST 4 and ST 5, sepa-rated by a road and located about 200 m apart, was lower than those between ST 4 and the other three sites. Fur-ther, ST 4 and ST 5 were clustered into the same genetic branch (Fig. 3).
The three
There is no historical aerial photograph or scientific study on the change in cattail stands within Baksilji; thus, it remains unclear exactly when the oldest cattail stand (ST 1) formed. However, the relative age of cattail stands can be assumed based on observation of the
The above speculation can be also strengthened by comparison with ST 4, which showed significantly higher genetic diversity. Although ST 4 was about 70 m away from the three cattail stands, its habitat was not significantly different from those of the above three stands in terms of abiotic ecological factors, such as the topography, water level, and soil characteristics. The dominance of
The cattails in the early colonization stand initially compete with other plants. In this period, genetic diversi-ty is important for successful establishment since genetic variation affects competitive ability by providing a base for larger ecological variation (Roscher et al. 2008, Sanders 2010). Further, genetic diversity was experimentally prov-en to increase colonization by manipulating
The analyzed stands of
According to the biotic and abiotic analysis, the envi-ronmental conditions of ST 5 can be characterized based on the coexistence of emergent macrophytes (e.g.,