The sex ratio of dioecious plants is an important fac-tor in the reproductive success of male and female plants and, furthermore, in population and species persistence (Renner and Ricklefs 1995). If the reproductive costs of male and female plants are equivalent, frequency-de-pendent selection should result in a 1:1 sex ratio (Fisher 1930). Mixed patterns have been reported, though male-biased sex ratios (Opler and Bawa 1978, Ornduff 1985, Sakai 1990, Allen and Antos 1993) are more common than female-biased ones (Crawford and Balfour 1990, Ueno et al. 2007) or 1:1 sex ratios (Ortiz et al. 1998, Schmidt 2008). Male-biased sex ratios are generally ascribed to the ef-fects of higher reproductive costs of females than males. Many authors have inferred higher female reproduc-tive costs from slower growth (Obeso et al. 1998, Nunez et al. 2008), delayed or less frequent flowering and fruit-ing (Armstrong and Irvine 1989, Thomas and LaFrankie 1993), and/or higher mortality (Lloyd and Webb 1977, Barrett et al. 2010). Differential growth and/or survivor-ship between male and female plants can generate age- or stage-specific sex ratios, especially for long-living plants. However, different species adapt different mechanisms to compensate for the females’ higher reproductive costs (Queenborough et al. 2007).
The sex-differential reproductive cost of dioecious plants can result in sex-dependent spatial segregation (SSS) (Bawa and Opler 1977, Bierzychudek and Eckhart 1988, Houle and Duchesne 1999). Females subjected to resource limitations due to high reproductive costs tend to be common in more favorable or less stressful condi-tions in terms of elevation (Nunez et al. 2008), water avail-ability (Ortiz et al. 2002), and/or soil fertility (Lawton and Cothran 2000). For example, female
In this study, we examined the sex ratio and spatial structure of the dioecious
To our knowledge, the first quantitative survey sexing
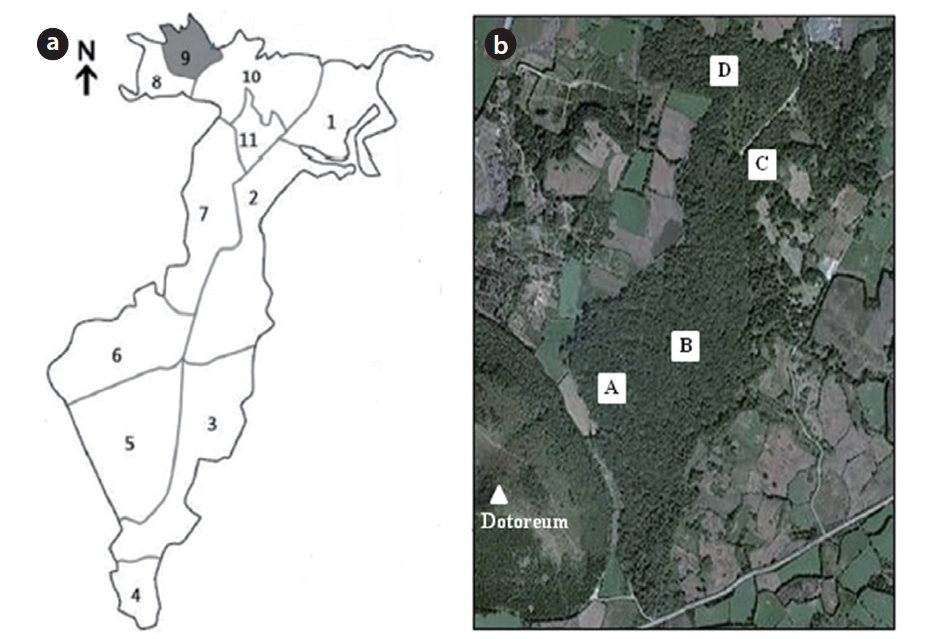
and the Dotoreum (a volcano near the southern end of the population; 284.2 m a.s.l.), and it extends 1.4 km northward with a width of 0.6 km. According to data from a weather station close to the forest, in 2001 to 2010, the mean monthly temperature ranged from 5.7℃ in January to 27.2℃ in August (annual mean temperature, 15.9℃), the mean annual precipitation was 1,474.9 mm with a peak in August (304.4 mm), and the mean annual wind speed was 4.0 m/s (Korea Meteorological Administration 2011). This forest is renowned for its high species diversi-ty: in addition to
>
Data collection and analyses
During the quantitative survey in 1999 (KTHA 1999), all trees ≥ 6 cm dbh were tagged and their ecological traits (size [dbh and height], sex, vitality, climber coverage, bark hole area, stripped bark area, number of competing trees, number of shading branches) were recorded. In a later study (Lee 2009), the tagged trees’ sizes and vitalities were re-examined. These data were combined into a da-tabase. The 1999 data and 2009 data each contained 2,878 trees (male, 1,507 vs. female, 1,371), and 2,861 trees (male, 1,498 vs. female, 1,363). These data indicated that 17 trees died between 1999 and 2009. The trees’ vitalities were classified into four categories (healthy, moderate, weak, and very weak) depending on their overall conditions, in-cluding factors such as leaf amount, leaf color, and trunk damage (KTHA 1999). Climber coverage was classified into four levels: severe, ≥60% coverage; middle, 40-60%; little, <40%; and none, 0%. “Bark hole area” indicates the hole area in the trunk (m2); “stripped bark area” repre-sents the damaged truck area (m2); “number of competing trees” is the number of trees potentially competing with each
Ten of eleven plots of
Sex ratios in 1999 and 2009 were obtained by the num-ber of male trees divided by the sum of male and female trees for each year. The chi-square test was used to con-firm the unbiased sex ratio for each habitat (ten plots and three habitats). One-way ANOVA was used to examine the difference in dbh between habitats or sexes. Two-way ANOVA was subsequently used to test the simultaneous effects of habitat and sex. Annual dbh growth rates were obtained by subtracting the 1999 dbh from the 2009 dbh and then dividing it by 10. Two-way ANOVA was employed to test the effects of habitat and sex on annual growth rates. Because a number of
In May 2011, we installed two quadrats in each habitat (Habitats I and II) for a total of four quadrats (each 50 × 50 m) (Fig. 1b). The GPS coordinates for 105 individuals within the quadrats were mapped using ArcMap Ver. 9.3 (Environmental Systems Research Institute 2008).
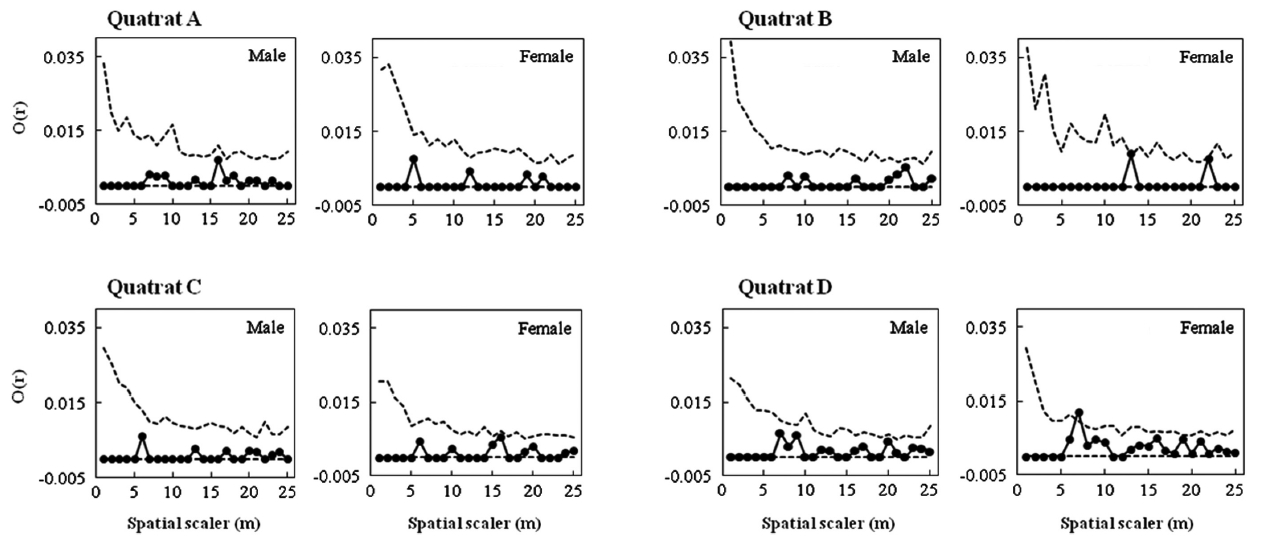
Male and female trees’ spatial structures were analyzed two ways. First, the pattern of association between the nearest male and female neighbors was examined using Fisher’s exact test. Second, the O-ring statistic suggested by Wiegand and Moloney (2004) was used. The O-ring statistic is useful for identifying the spatial correlation between populations. The value of O(r) was calculated as follows: around each individual data point, numer-ous circles with radius r were drawn, and the correlation between the average number of individuals within the circles and the radius r was deduced to determine the O value. To conduct significance tests on the O(r) value for each distance r, the null hypothesis was formed using complete spatial randomness (CRS). The 95% confidence interval was obtained after 999 times of randomization using Monte Carlo simulations for each population. If the O(r) value was above the CRS value, the individuals were considered clumped; if it was within the 95% confidence interval, they were considered randomly distributed; and if it was below the CRS value, they were considered regu-larly distributed. All calculations and simulations were performed using PROGRAMITA software (Wiegand 2010).
>
Mean size and sex ratio of T. nucifera
For the total of 2,861 trees measured in 2009, the mean dbh was 52.4 ± 20.1 cm (mean ± SD) and the mean height was 10.4 ± 2.2 m (Table 1). However, the mean dbh varied widely among plots, ranging from 39.4 cm (Plot 10) to 61.7 cm (Plot 5). The population density was 67.6 trees/ha, but this value also differed among plots. For example, Plots 1, 4, and 9 exhibited very low densities (<30 trees/ha), whereas Plot 10, which was adjacent to Plots 1 and 9, ex-hibited the highest density (114 trees/ha). Across the ten plots, mean dbh values were independent of densities (
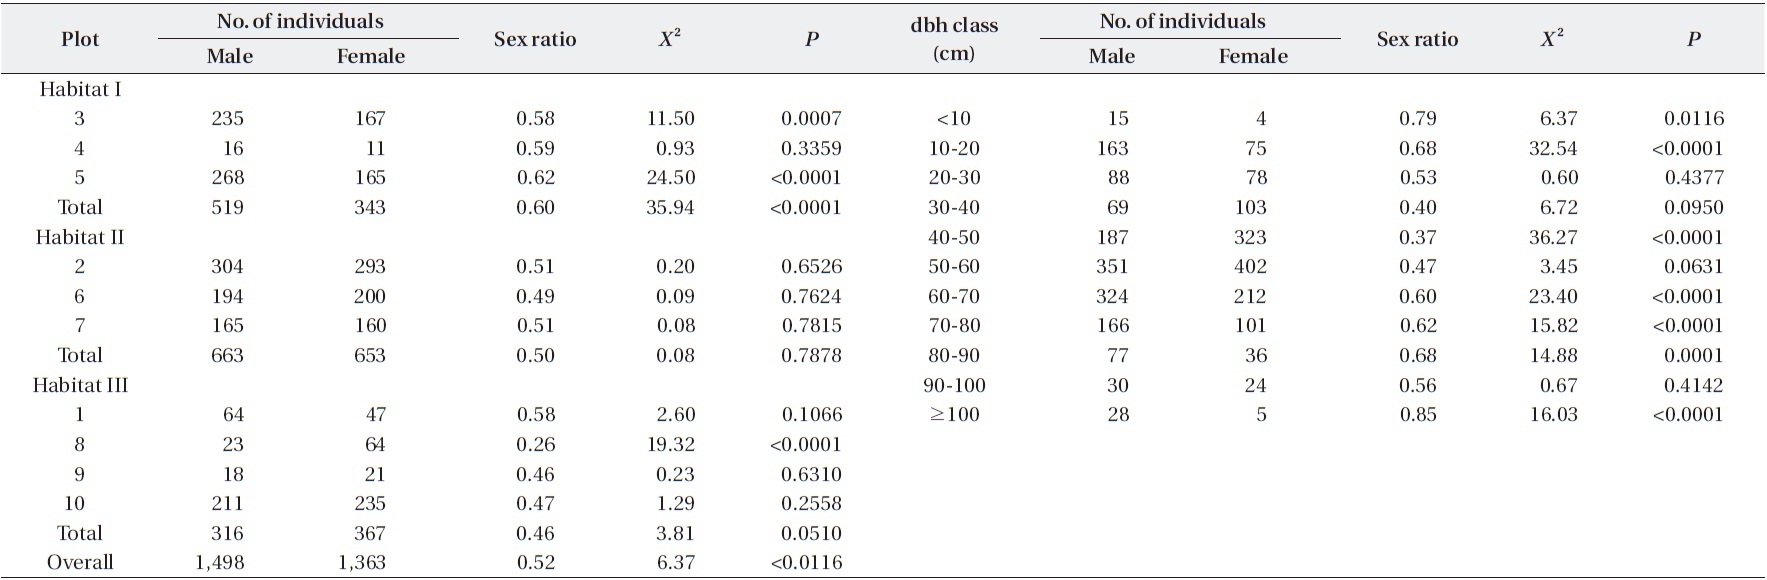
The sex ratio of the trees was 0.52 in both 1999 and 2009. The null hypothesis of an equal sex ratio was reject-ed, revealing a significant bias for males (Table 2). How-ever, significance in sex ratios was detected only in three plots with opposite patterns: there were 1.4-1.6× more males than females in Plots 3 and 5, while there were 2.8× more females than males in Plot 8 (Table 2). This plot-based pattern was observed at the habitat level as well: there were 1.5× more males than females in Habitat I but 1.2× more females than males in Habitat III. Habitat II showed a 1:1 ratio.
Sex ratios tended to change in a U-shape according to dbh class (Table 2). Small trees < 30 cm dbh and large trees ≥ 60 cm dbh exhibited significant male skews. In particular, trees with <10 cm dbh and ≥100 cm dbh had sex ratios of 0.79 and 0.85, respectively, indicating that the
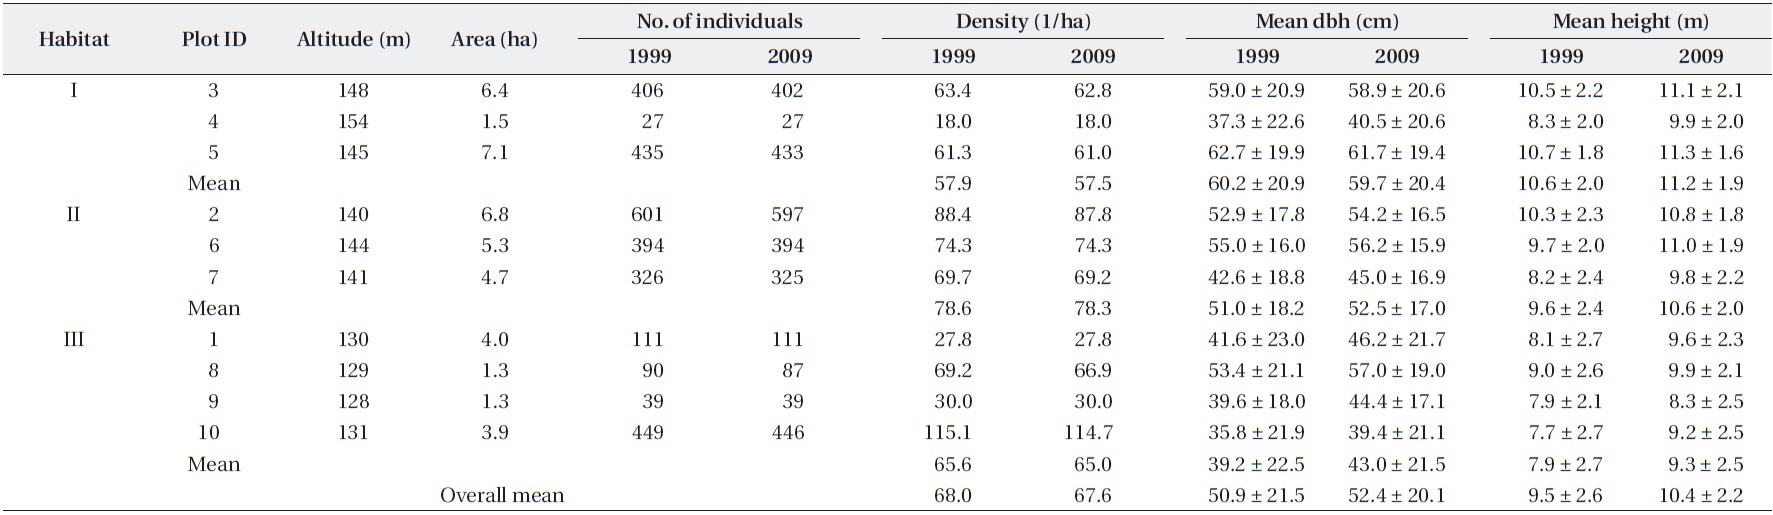
Mean sizes (± SD) and numbers of Torreya nucifera trees in ten plots of Torreya Forest in Jeju Island

Numbers and sex ratios of male and female trees among plots and dbh classes of Torreya nucifera trees in Jeju Island
male trees were 3.8× and 5.6×, respectively, more abun-dant than females. On the other hand, the sex ratio of a 40-50 cm dbh class was 0.37, meaning that this size group is significantly skewed toward being female.
>
Relationship among dbh, habitat, and sex
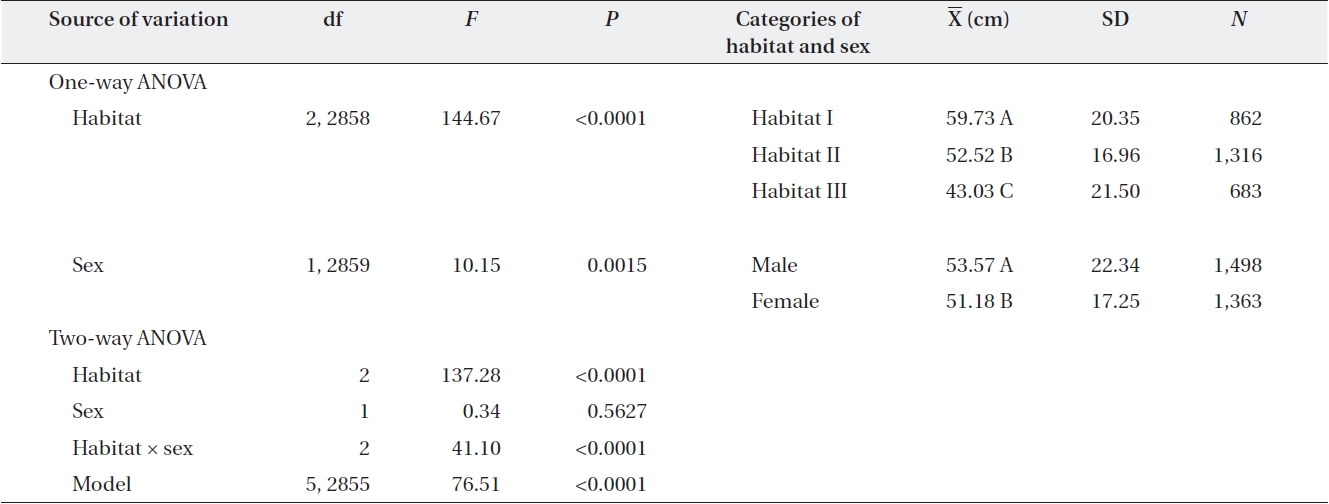
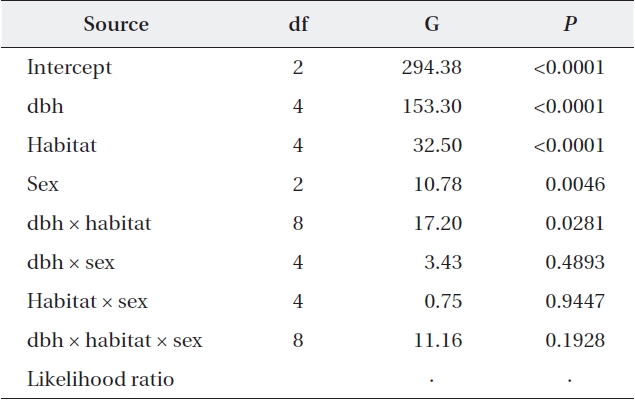
One-way ANOVA using either sex or habitat as an in-dependent variable showed that males had larger mean dbh than females by 2 cm (Table 3). The dbh also differed significantly among habitats, declining from Habitat I to Habitat III by an average of 17 cm (Table 3).
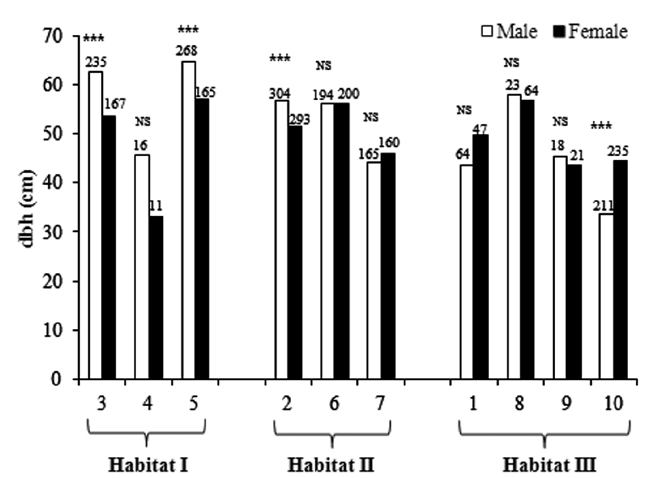
In two-way ANOVA using habitat and sex as indepen-dent variables, the habitat × sex interaction effect was significant (Table 3). Separate analyses for each habitat showed that in Habitats I and II, males were larger than females, while in Habitat III, the opposite pattern was observed. In subsequent analyses of each habitat, the relationship between dbh and sex differed among habi-tats. Across all plots in Habitat I, males were larger than females (plot,

One-way ANOVA of the effect of habitat and sex and two-way ANOVA of the effects of habitat and sex on diameter at breast height of Torreya nucifera
in Plot 2, while males were larger in Plot 10.
In two-way ANOVA examining the difference in an-nual dbh growth rates between habitat and sex, sig-nificant results were detected only when annual growth rates were expanded up to 3 mm (≤1 mm,
>
Relationship between tree vitality and tending
In 1999, vitality was significantly associated with climb-er coverage only in both male and female trees (
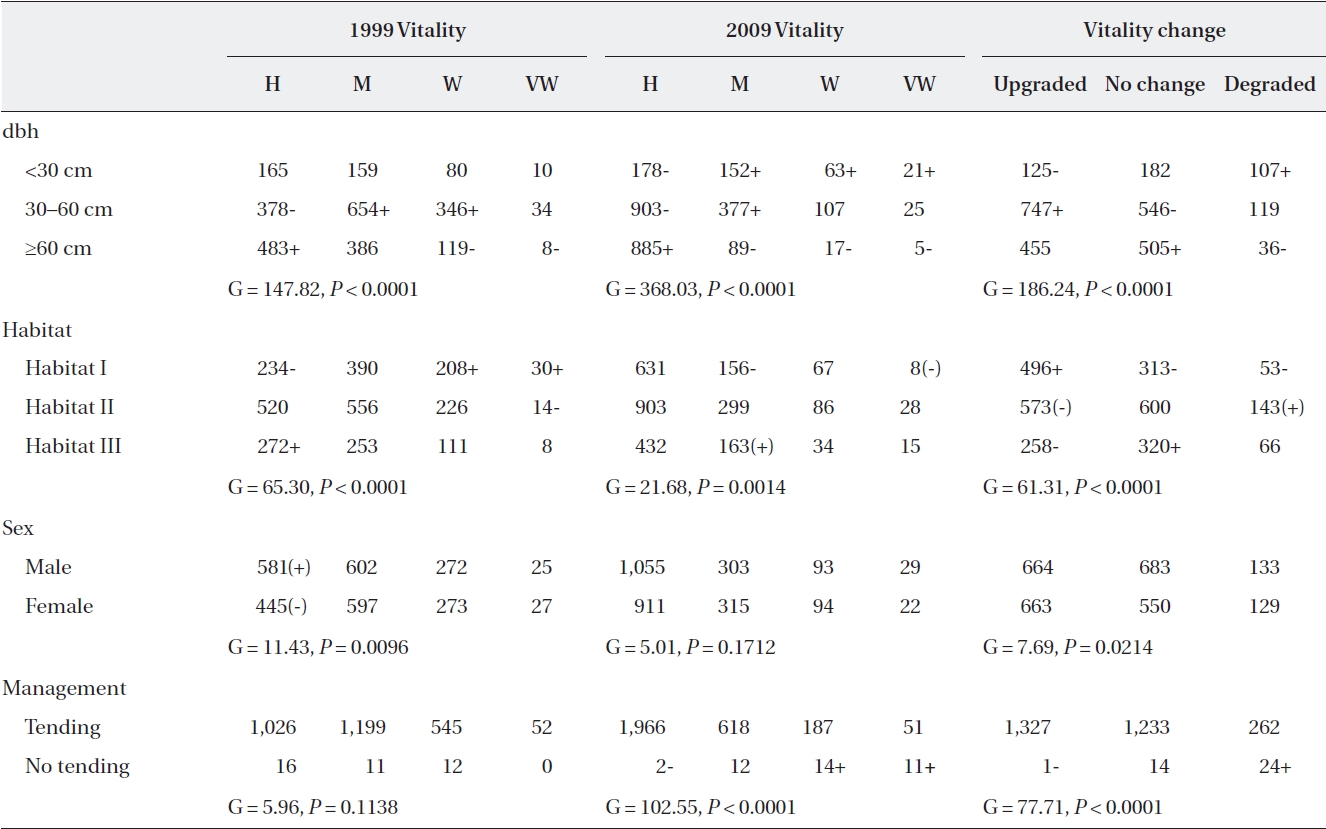
In 1999, trees assigned to the healthy group comprised only one third of the population (36.4%, 42.5%, 19.3%, and 1.8% for healthy, medium, weak, and very weak, re-spectively). In two-way contingency table analyses, vi-tality was significantly associated with dbh, habitat, and sex (Table 4). Almost half of the large trees ≥ 60 cm dbh (48.5%) were identified as healthy, and 12.8% of them were identified as weak or very weak. On the other hand, medium-sized trees (30-60 cm dbh) (26.9%) rather than small trees < 30 cm dbh were mainly identified as being weak or very weak. The proportion of weak and very weak trees was 27.6% in Habitat I, while it was lower in Habitats II and III (18.2% and 18.5%, respectively). Conversely, the

Two-way contingency table of vitality vs. dbh, habitat, sex, and management among Torreya nucifera trees in 1999 and 2009
proportion of healthy trees in Habitat III was 1.6× greater than in Habitat I. The probability of males being healthy was 1.2 times higher than that of females (39.3% vs. 33.2% for male and female trees, respectively). The two groups of plots that were assigned to tending or not in 1999 did not differ in vitality before the tending was initiated (Table 4).
After ten-year tending, the proportion of trees identi-fied as healthy in 2009 increased 1.9× compared to that of 1999 (69.7%, 21.9%, 6.6%, and 1.8%, for healthy, medium, weak, and very weak, respectively). Vitality in 2009 was significantly associated with dbh, habitat and tending but not with sex (Table 4). Healthy trees were twice more abundant among large trees than small trees (88.9% vs. 43.0%). Conversely, weak (and very weak) trees were al-most ten times more abundant in small trees than in large trees (20.3% vs. 2.3%). In Habitat I, the number of trees showing moderate vitality was less than expected, while in Habitat III, the reverse was true. In particular, the as-sociation between vitality and tending was quite strong after ten-year tending (Table 4). Seventy percent of the trees in the tending plots were healthy compared to 5.1% in the non-tended plot.
Tracking the individual tree vitality for ten years, the proportion of trees whose vitality was upgraded, main-tained or degraded was 46.4%, 43.6%, and 10.0%, re-spectively (Table 4). Vitality change patterns differed significantly according to dbh, habitat, and sex. Almost half of the medium-sized trees displayed improved vital-ity (52.9%), while only 8.4% of them displayed decreased vitality. In contrast, only one third of small trees exhibited increased vitality, while one fourth displayed decreased vitality (30.2% vs. 25.9%). Compared to Habitat III, Habi-tat I trees had a 1.4× higher probability of having an up-graded vitality. Among females, the proportion of trees whose vitality was upgraded was greater than those with no change (49.4% vs. 41.0%), whereas the opposite was true for males (44.9% vs. 46.2%). Also, approximately half (47.0%) of the trees in the tended plots for ten years had upgraded vitalities compared to those of the trees in the non-tended plot, and only 9.3% had lower vitalities. In contrast, only a single tree from the non-tended plot dis-played improved vitality, while 61.5% displayed worsened vitalities. Considering dbh, habitat, and sex simultane-ously, all main variables and the dbh × habitat interaction were significantly associated with vitality changes (Table 5). Separate analyses for each habitat showed that in all habitats, a vitality change was associated with dbh with-out significant two-way interactions between dbh and sex (Habitat I, G = 30.67,

Maximum likelihood analysis of variance with vitality change as a response variable and dbh, habitat, and sex as explanatory variables (N = 2,822)
Of the 17 trees that died between 1999 and 2009, almost half were healthy (
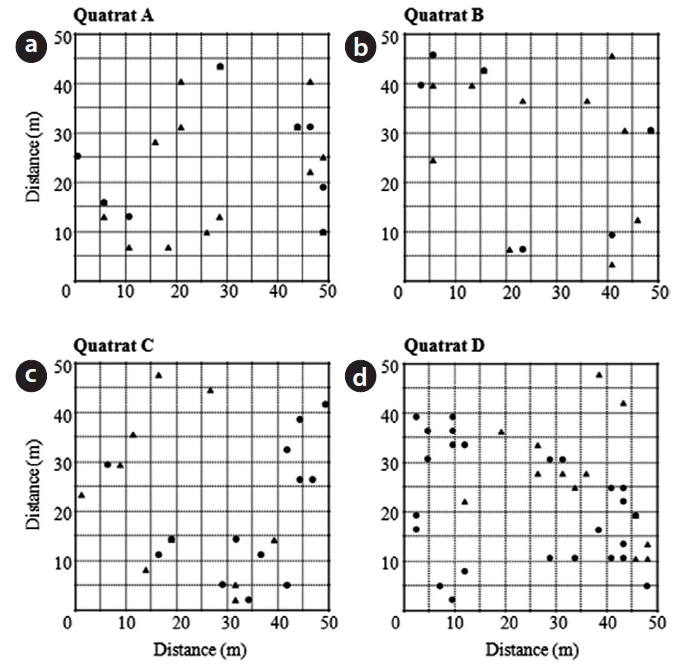
Fig. 3 shows the distribution pattern of male and female trees within four quadrats established in Habitats I and III. Sex ratios within quadrats were quite analogous to those within habitats (0.65 and 0.63, respectively, in quadrats A and B in Habitat I; 0.43 and 0.35, respectively, in quadrats C and D in Habitat III). Significant associations between nearest neighbor sexes were detected only in quadrats B and D (A,
Until quite recently, the sex ratios of
However, sex ratios of
On the other hand, a higher proportion of female trees among the middle-sized trees may reflect the increase in female trees that have grown as much as males (reach-ing 30-60 cm dbh) until they become old. In this study, we could not find evidence of differences between sexes in annual dbh growth, although average male dbh was slightly larger than that of females. However, it should be mentioned that in 1999, measuring dbh was an ex-tremely difficult task because of climbers’ heavy coverage of trunks at that time. Lee (2009) noted that the dbh of
As the distance from the Dotoreum increased, and the elevation decreased, the sex ratios of
Diverse climbers such as
The effect of tending on
Tending may be needed to maintain
>
Spatial pattern of T. nucifera trees
The expected SSS under the hypothesis of the high re-productive cost of females has been observed in many angiosperms and gymnosperms including