The rapid urbanization in developing countries is accelerating both the depletion and fragmentation of urban green space, despite the known positive effects of green spaces on the environmental conditions in cities and the quality of life of residents. Consequently, there is a need for practical tools that can support the development of networks of urban green spaces. This article presents a study that used a GIS-based least cost path (LCP) analysis to identify the best alterna-tive for developing an urban green space network in the coastal city of Jakarta, Indonesia, which was based on the evalu-ation of topography and land use characteristics. Pair-wise analysis was used to reduce the sensitivity in the LCP model. The results showed that the coastal wetlands in the northern part of Jakarta and the agricultural fields in the suburban areas of Jakarta play an important role in connecting the green space network. On the other hand, some green spaces in the central part of Jakarta could not be connected by the LCP model. The method used in this study can serve as a tool to support the identification of networks of potential urban green spaces. It can also provide useful information for sustain-able urban landscape planning and management in urban ecosystems. However, the inclusion of socio-economic criteria would further improve the model.
The increasing concentration of the human population in urban areas has caused several environmental prob-lems, such as air and water pollution, noise, and urban heat islands. In addition, cities located in coastal areas also face increased risks of flooding as the sea-level rises due to climate change. Academics have pointed out the important positive effects of green spaces on the environ-mental conditions in urban areas through its influence on temperature, humidity, pollutants, and wind speed (Fir-man 1998, 2009, Kong and Nakagoshi 2006). In terms of ecosystem services, urban green spaces can help reduce many environmental problems and improve the quality of life of residents (Kong and Nakagoshi 2006, Ban et al. 2009, Firman 2009). In the process of urbanization, how-ever, green spaces often become fragmented and deplet-ed without appropriate policies. To prevent or undo such damage, decision makers would greatly benefit from tools that can support guiding the development of networks of urban green spaces.
Jakarta is the capital and largest city in Indonesia. For megacities like Jakarta, the impact of the problems caused by urbanization is considered to be more severe because they are perceived as their nation’s political and economic capitals (Firman 1998, 2009). Urbanization due to the rapidly increasing population in Jakarta has led to large-scale residential, commercial, and industrial devel-
opment, which resulted in the loss of many urban green spaces (Kim et al. 2006, Firman 2009). It is important for Jakarta to maintain and develop green space networks as these are known to have a positive effect in terms of eas-ing certain environmental problems (Kim et al. 2006).
In addition, Jakarta is adjacent to the sea. Coastal cit-ies have to be even more concerned about environmental problems than other cities due to climate change. As has been the case in Bangkok, Thailand, low lying cities locat-ed in coastal areas are much more susceptible to rises in sea level (Firman 1998, 2009, Yokohari et al. 2000), which can greatly impact the quality of life of residents. Based on this, the green networks of coastal cities are essential, not only for resolving the problems caused by urbaniza-tion but also for ultimately improving the quality of life of residents.
Since 2001, the Indonesian government has attempted to decentralize urban development by means of new town development. From an environmental viewpoint, howev-er, this has resulted in the further fragmentation of green spaces and inefficient use of natural resources (Firman 2009). The situation in Jakarta has become alarming (The Jakarta Post 2011), and there is an urgent need to develop a network of urban green spaces for better landscape eco-logical function and the development of social capacity.
Least-cost path (LCP) analysis is a simple and fast way to perform network analysis (Bagli et al. 2011). LCP has been used to find locations for road ways, pipeline con-structions, and so on (Bagli et al. 2011). In ecological stud-ies, it has shown to be very useful to analyze networks for habitat fragmentation (Douglas 1994, Adriaensen et al. 2003, Beier et al. 2009).
In this study, LCP analysis was used to identify loca-tions in Jakarta that are suitable for urban green space and locations where more green space is needed as part of a network.
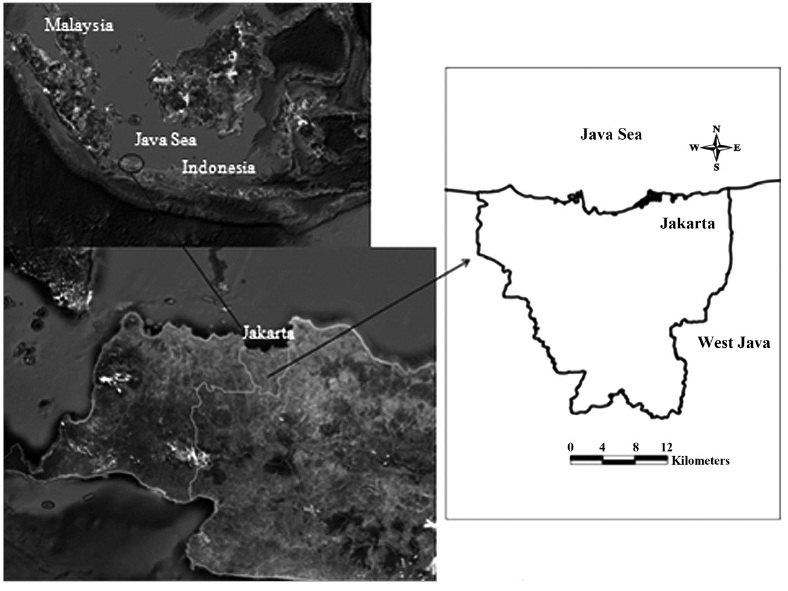
Fig. 1 shows the study site of Jakarta (capital of Republic of Indonesia), which is located 106°40′ E-107°00′ E, 6°04′ S-6°22′ S and covers an area of about 661 km2. Jakarta is located along the north coast of the western part of Java Island, and consists of five municipalities. Built up from the silt washed down from the volcanic mountain range to the south, an alluvial plain spreads out in a fan shape traversed by several rivers such as Cisadane, Angle, Cili-wung, Bekasi, and Citarum (Goldblum and Wong 2000, Han and Basuki 2001). The area around the mouth of the Ciliwung River in west Java has known human settlement from prehistoric times.
The area of Jakarta is relatively flat with topographical slopes ranging between 0° and 2° in the northern and cen-tral part, and up to 5° in the southern part. The southern part has an altitude of about 50 m above mean sea level. The average annual precipitation is about 1,800 mm. Al-though rainfall occurs throughout the year, it is heaviest from November to May. The average daily temperature ranges from 21℃ to 33℃, with little seasonal variation. The dominant vegetation type is tropical rainforest.
LCP analysis is used to find the path in a network be-tween two points, among many possibilities, which has the lowest cost to connect areas, where cost is a function of time, distance, or other user-defined factors.
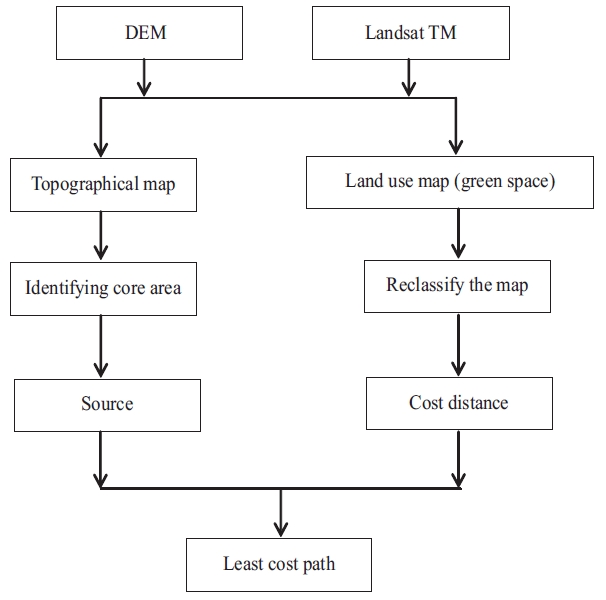
There are two major steps to find a LCP between a start-ing point and a destination point in a given gridded map. The first step is to create an accumulated cost surface with respect to all relevant cost factors. The second step is to construct the LCP with slope-tracing lines on the ac-cumulated cost surface (Fig. 2).
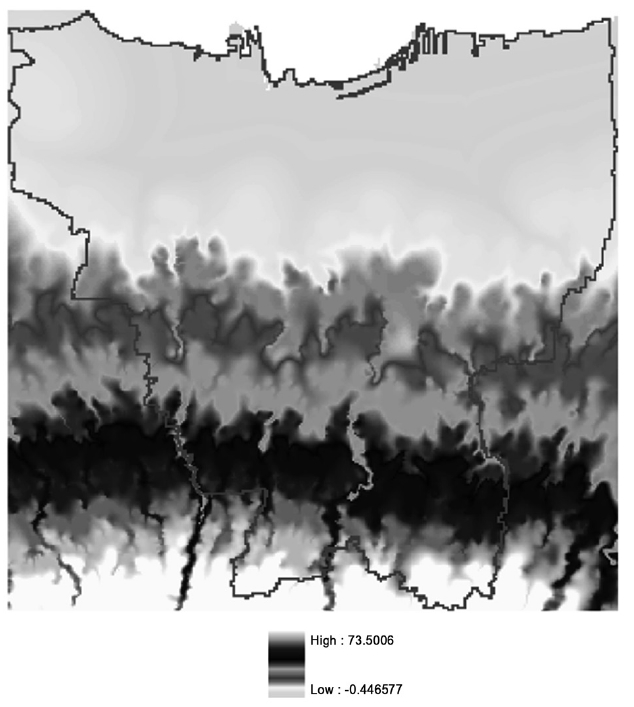
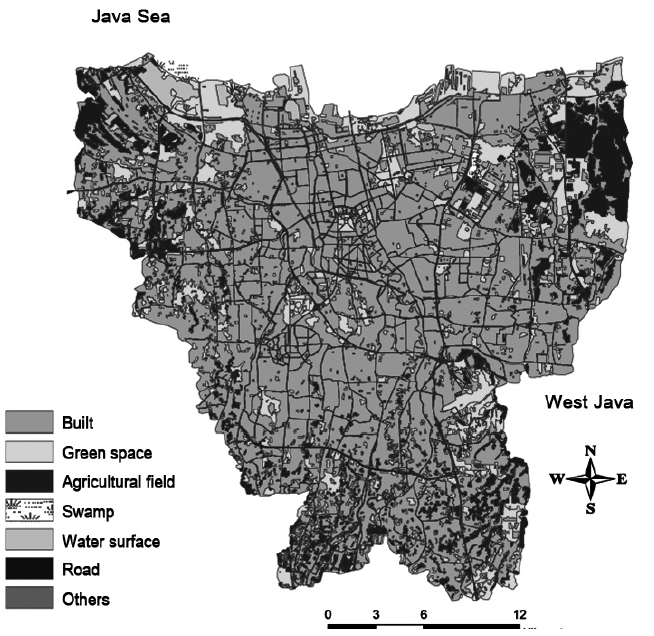
A digital elevation model (DEM) was used to geograph-ically map data for elevation (Fig. 3), aspect, and slope. A land use map (Fig. 4) was derived from Landsat TM satel-lite imagery. The map resolution was set to 30 m × 30 m.
According to Rayfield et al. (2010) landscape structure influences how sensitive the connectivity assessments are to the quality of land use type. To overcome this sensitivi-ty, all land use types were compared with each other using a multicriteria evaluation (Bagli et al. 2011). In this study the follow criteria were accounted for:
1) Elevation, classified by: below 15 m, between 15-30 m, over 30 m.
2) Aspect, classified by: east, south, west, north.
3) Slope, classified by: below 2.5 degree, between 2.5-5 degree, over 5 degree.
4) Land use types, classified by: built-up area, green space, agricultural field, swamp, water surface, road, others.
Pair-wise analysis was used to compare these criteria. The logic of the pair-wise analysis suggests obtaining a rela-tive value of the merit of criteria in situations where there is any uncertainty about the criteria to determine the de-
[Table 1.] Scale of relative importance (based on Saaty 1992)
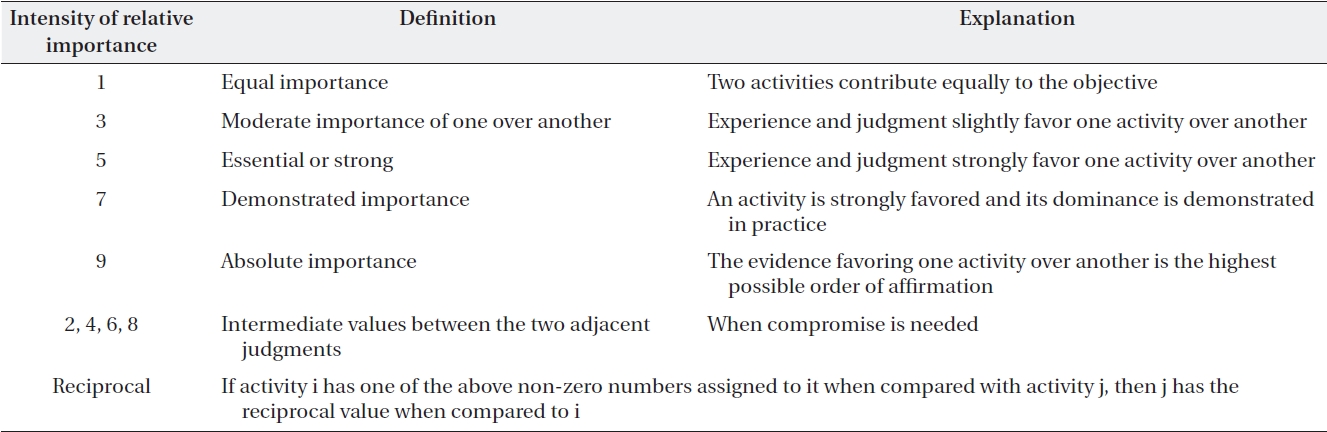
Scale of relative importance (based on Saaty 1992)
[Table 2.] Weights assigned to the criteria and sub-criteria
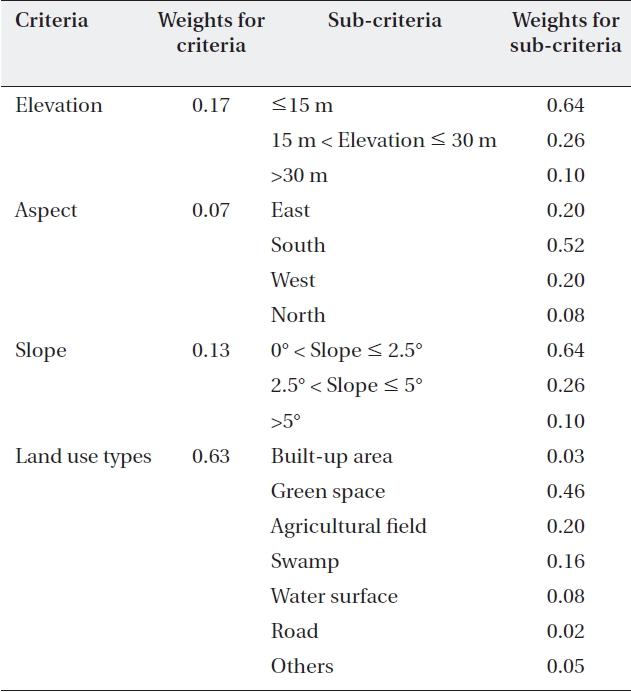
Weights assigned to the criteria and sub-criteria
sired patterns in a spatial analysis procedure. The pair-wise comparison is a decomposed analysis produced by pairs of elements. In order to quantify the relative im-portance of factors, the scale of Saaty (1992) was used (Table 1).
The weight of importance for each criterion needs to be implemented over the entire study area. The total score obtained after comparison of each factor was used as a ratio in the pair-wise comparison matrix, which was then used to calculate the eigenvector of weights for each input factor. The factor weights sum to one, which is a require-ment for using the weighted linear combination (WLC) procedure (Basnet et al. 2001). The combination of com-ponents, according to the WLC model, is determined us-ing the following equation:
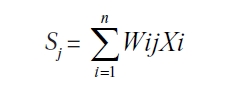
, where
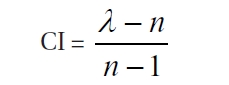
A consistency test is required when priorities are de-rived based on pair-wise comparisons (Bantayan and Bishop 1998, Mardle et al. 2004, Svoray et al. 2005). In the pair-wise comparison of more than two objects, there is the natural potential for intransitivity to exist. Conse-quently, random errors may not be eliminated with stan-dard consistency checks.
The consistency index (CI) is based on the assumption that λ, which is defined as the average consistency vec-tor, is always larger than or equal to the number of criteria in a matrix (
Next, the consistency relationship (CR) is calculated using the following equation:
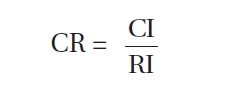
where RI is the random index developed by Saaty (1977), and a constant that depends on the number of criteria in the matrix. If CR is smaller than 0.1, the pair-wise com-parison results can be accepted.
A topographical map was made using a DEM. While the highest altitude on this map can be found in the south, it was only 70 m above sea level; thus the majority of the area had a flat and leveled topography. The gradient and direction were influenced by this topographical map.
With the exception of the large-scale green spaces located in the central part of the city, the land use map showed that the majority of areas fall under the category of built-up areas. Comparatively speaking, more green spaces can be found along the coastal areas. The major-ity of agricultural areas were located in the outer areas of Jakarta. While the agricultural areas in the northeastern part of Jakarta showed a relatively big patch type, frag-mentation was already visible on the southern side.
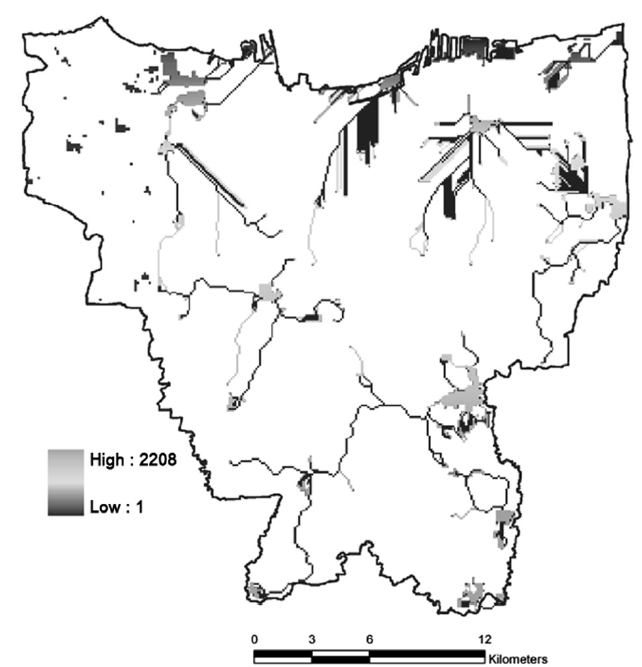
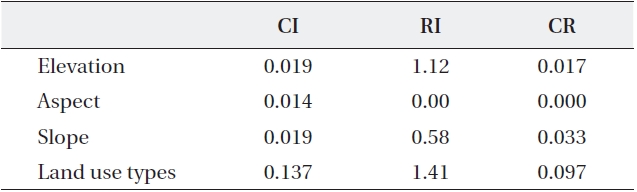
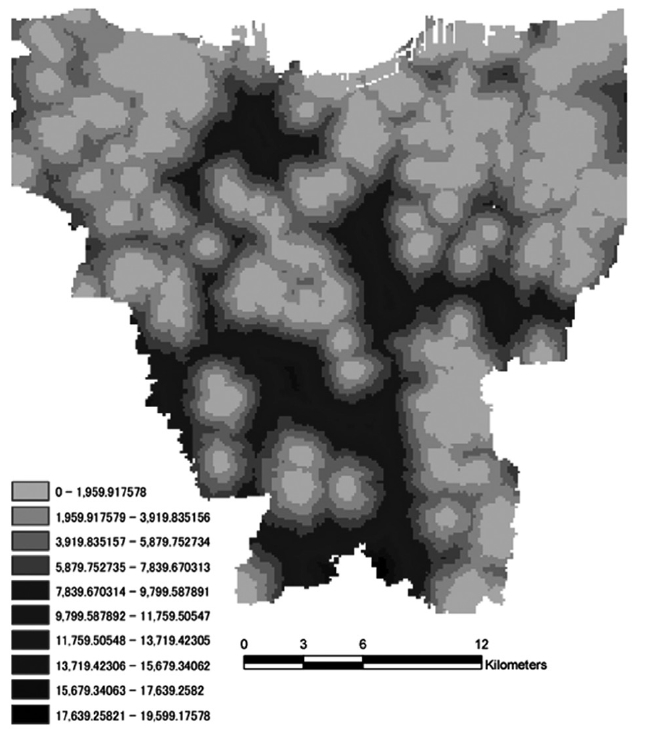
The cost distance map is displayed in Fig. 5. This map was used as the foundation to examine the patch connec-tivity in the LCP analysis. Viewed from this standpoint, the downtown central area appeared to be already frag-mented. The final LCP map connecting the green spaces of Jakarta (Fig. 6) showed that the green spaces along the coastline in the north were relatively easy to connect. The results of the consistency test are shown in Table 3. Be-cause all of the CR values were smaller than 0.1, the use of a pair-wise analysis was deemed appropriate.
A landscape ecological approach based on a network model can be used in the planning and management of urban green spaces. This can be of great help in the evalu-ation and identification of landscape patterns and land-scape ecological functions of urban green spaces (Kong and Nakagoshi 2006). Although the geomorphological landscape is regarded as an important element in terms of the formation of green networks, the topography of Jakarta is relatively flat, its altitude is relatively low and the city is generally leveled. As such, the geomorpho-logical landscape of Jakarta would appear to not greatly
[Table 3.] The value of the consistency relationship on each criterion

The value of the consistency relationship on each criterion
influence the composition of its green networks. Further-more, much as in the case of the pair-wise analysis, the weight scores were found to be relatively low. In the case of cities where topographical elements do not wield great influence, land use tends to be regarded as the major fac-tor involved in the formation of green networks. There-fore, the use of water or green spaces around roads has been recognized as a good method of forming green net-works (Kong and Nakagoshi 2006, Theobald 2006).
In addition, there is a need to take a look at the quality of green spaces in urban areas. Some of the green spaces located in downtown Jakarta have the characteristics of squares, but fail to function as a true green space because of the inclusion of pavement (Kim et al. 2006). In this re-gard, it becomes necessary to consider not only the con-nectivity of green spaces, but also the quality thereof.
Since the LCP analysis includes many parameters, it can show a large range of uncertainty (Beier et al. 2009). In addition, LCP analysis based on GIS is sensitive to the resolution that is applied. Nevertheless, LCP analysis is one of the most widely used methods for establishing net-works (Pinto and Keitt 2009, Pullinger and Johnson 2010). It is known to be more accessible than other methods in GIS environments. The present study suggests a simpler method to connect green networks based on using a DEM and land use map as the basic spatial materials associated with the use of GIS. This method also made it possible to see the basic green axes of the downtown area of Jakarta. The application of the GIS-based LCP model constitutes a simpler method of applying landscape planning and management to the establishment of green networks in urban areas, which makes it more accessible to decision makers in practice.
The present study sought to minimize the influence of the landscape structure when performing the LCP analy-sis by employing a pair-wise analysis. However, more ef-fective data could have been produced by adding socio-economic factors to the basic materials used in this study. Furthermore, even better results can be anticipated if the network was composed in a manner that takes into ac-count the quality of green spaces.