This study was performed in order to suggest the possibility of tree species classification using high-resolution Quick-Bird-2 images spectral characteristics comparison(digital numbers [DNs]) of tree species, tree species classification, and accuracy verification. In October 2010, the tree species of three conifers and eight broad-leaved trees were examined in the areas studied. The spectral characteristics of each species were observed, and the study area was classified by image classification. The results were as follows: Panchromatic and multi-spectral band 4 was found to be useful for tree species classification. DNs values of conifers were lower than broad-leaved trees. Vegetation indices such as normalized differ-ence vegetation index (NDVI), soil brightness index (SBI), green vegetation index (GVI) and Biband showed similar pat-terns to band 4 and panchromatic (PAN); Tukey’s multiple comparison test was significant among tree species. However, tree species within the same genus, such as Pinus densiflora-P. rigida and Quercus mongolica-Q. serrata, showed similar DNs patterns and, therefore, supervised classification results were difficult to distinguish within the same genus; Random selection of validation pixels showed an overall classification accuracy of 74.1% and Kappa coefficient was 70.6%. The classification accuracy of Pterocarya stenoptera, 89.5%, was found to be the highest. The classification accuracy of broad-leaved trees was lower than expected, ranging from 47.9% to 88.9%. P. densiflora-P. rigida and Q. mongolica-Q. serrata were classified as the same species because they did not show significant differences in terms of spectral patterns.
Forests account for over 60% of land area in South Ko-rea. However, city expansion plans and urban develop-ment projects have inevitably created more demands and increasing forest development. The Ministry of Environ-ment (ME)’s latest report on the time-series changes in the land cover map of the country shows significantly re-duced forest area: approximately 64% remained as of the end of 2000s from 66% at the end of the 1980s (Ministry of Environment 2010).
Forests, as resources for human activities and wild life habitat, play an indispensible role in the environment and in the entire ecosystem. They require an organized system of forest survey and management to prevent dam-ages by indiscriminate development.
The 1st National Natural Environment Survey kicked off in 1986, as part of ME’s nationwide natural environ-ment survey (as per Article 32 of the National Environ-ment Conservation Act) initiative to be carried out every 10 years. From the 2nd National Natural Environment Survey onwards, results and information collected were included in the GIS-DB building and then generated into an official report on the status of the eco-environment (published in April, 2007). Over 90% of the report con-cerns the results of the vegetation survey, in addition to covering various aspects of the ecosystem, including in-formation on the flora and the fauna (mammals, birds, amphibians and reptiles, insects, freshwater fish, and freshwater invertebrates) and topography (National Insti-tute of Environmental Research 2010).
With the 2013 4th National Natural Environment Sur-vey, the survey interval is to be reduced to 5 years, rather than the aforementioned 10. Thus, devising an efficient vegetation survey master plan has become a matter of ur-gency, in anticipation of the significant increase in vegeta-tion survey area to be covered annually.
Satellites have the merit of being able to obtain data for a large area. Since 1995, several countries have launched satellites that can obtain images with spatial resolution of equal to or less than 10 m. In addition, the QuickBird, launched October 2001, is a high-resolution satellite from Digital Globe. It offers high spatial resolution by simulta-neously acquiring 0.64-m panchromatic (PAN) and 2.50-m multispectral imageries and has four bands that simul-taneously record reflected or emitted radiation from the earth’s surface in the blue (band 1, 0.45 to 0.52 μm), green (band 2, 0.52 to 0.60 μm), red (band 3, 0.63 to 0.69 μm) and near-infrared (band 4, 0.76 to 0.90 μm) portions of the electromagnetic spectrum.
Forest classification is important for forest ecosystem management and scientific research. Field ground sur-veys of plant species composition and forest classification are time consuming and provide incomplete information of forest polygon delineation. The techniques of plant species classification, from satellites with high resolution images, could be the most effective way to classify and as-sess large areas of forest (Martin et al. 1998, Franklin et al. 2001).
Studies using IKONOS and QuickBird images have been used to identify trees (Ham et al. 2004, Katoh 2004, Kim 2008) and classify forest types (Chung et al. 2001, Lee 2001, Jayakumar et al. 2007) in forest stands with discern-ible crown diameter. However, it is difficult to distinguish among species in broadleaved forests, as they have the same tone in QuickBird images. The classification process of high resolution images, using spectral characteristics of bands and vegetative indices, needs to be developed.
Therefore, the objectives of this study are to use the high-resolution QuickBird-2 satellite images to compare and analyze the spectral characteristics of the tree spe-cies within the study area, to automatically classify and perform an accuracy assessment of the tree species, using the images, and to address the question of feasibility of QuickBird-2 imagery-based tree species classification by providing the relevant databases.
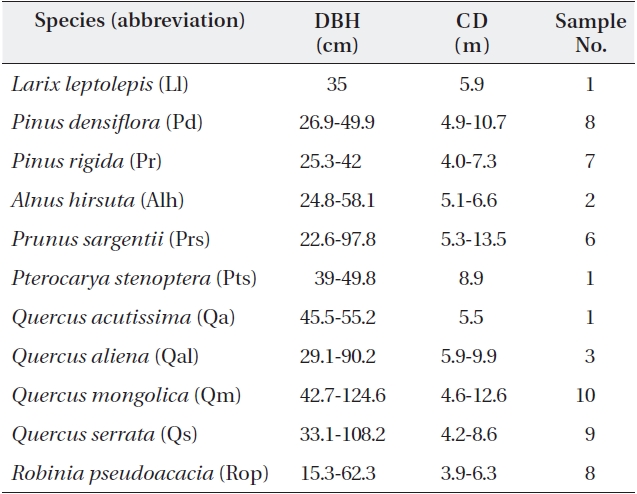
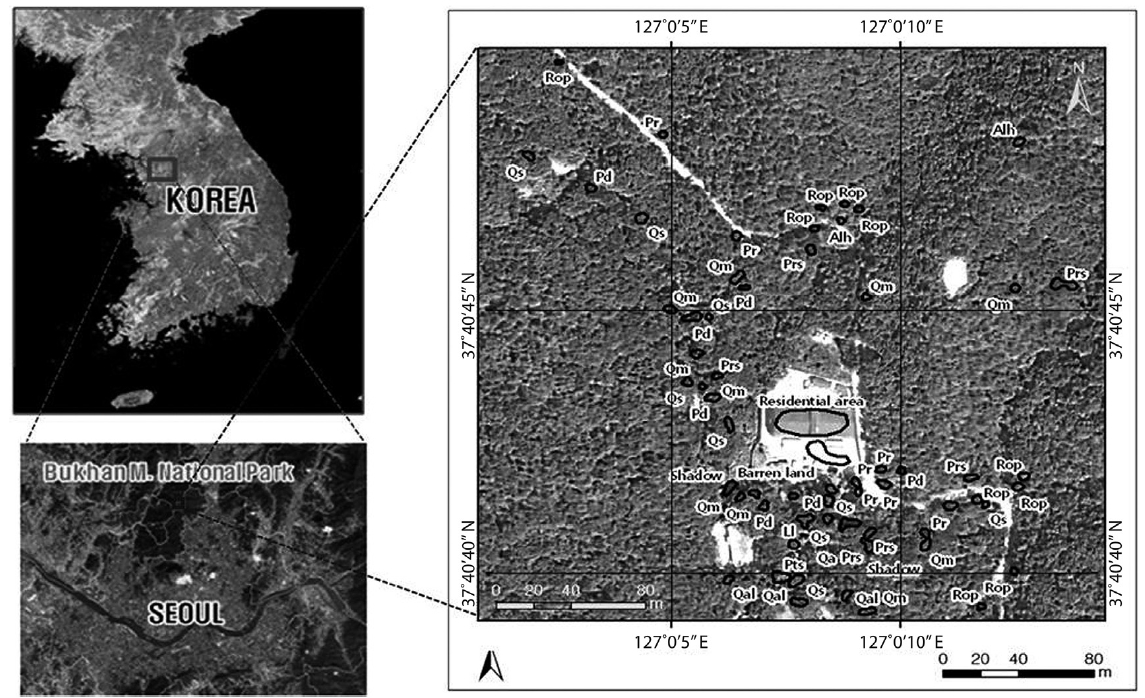
The study area was defined as the 122,500 m2 (350 m × 350 m) land located at 127°00′00″ E-127°00′15″ E longitude and 37°40′35″ N-37°40′50″ N latitude from the Bukhansan National Park office at Ui-dong, Gangbuk-gu, Seoul, Ko-rea (Fig. 1). The study forest is composed of broadleaved trees such as
Satellite images obtained from Digital Globe’s Quick-Bird-2 were used as primary data for this study. These of-fer spatial resolution by simultaneously acquiring 0.64-m PAN and 2.50-m multispectral imageries. There are four bands that simultaneously record reflected or emitted ra-diation from the earth’s surface in the blue (band 1, 0.45 to 0.52 μm), green (band 2, 0.52 to 0.60 μm), red (band 3,
[Table 1.] Tree species conditions in the study and their abbreviations

Tree species conditions in the study and their abbreviations
0.63 to 0.69 μm) and near-infrared (band 4, 0.76 to 0.90 μm) portions of the electromagnetic spectrum. The digi-tal map, detail vegetation map, and boundary data of the Bukhan Mountain National Park were obtained at the courtesy of relevant institutions and authorities, and the digital elevation model (DEM) was produced hands-on, using the digital map for this particular study (Table 2).
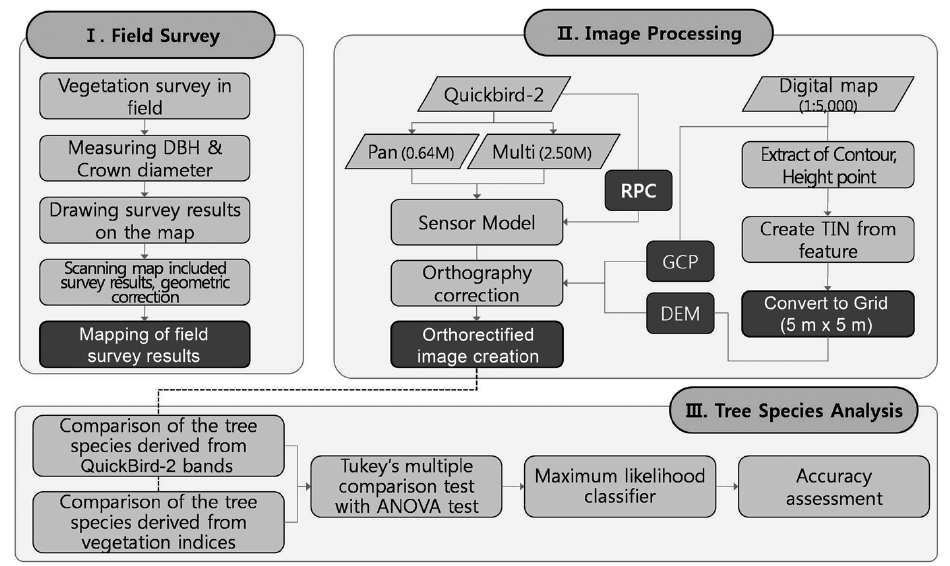
The study was carried out in 3 major parts: field survey, image processing, and tree species analysis. Refer to Fig. 2 for a study process flow chart.
The site map, produced from QuickBird-2 images, was used to carry out the field survey. The diameter at breast
[Table 2.] List of materials used in the study
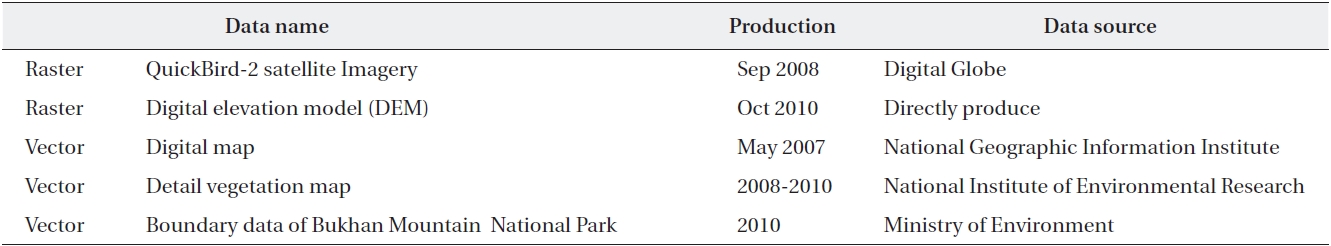
List of materials used in the study
height (DBH) and the crown diameter of the tree species were measured, and the crown boundary was marked on the map, scanned, and geometrically corrected to build the GIS-DB with the crown boundary, DBH, and crown diameter information for each tree species.
For image processing, rational polynomial coefficient data was provided at the purchase of images and was re-flected to remove internal errors. Ground control point and DEM were each marked and built on a digital map with a ratio scale of 1:5,000 for orthography correction of PAN (resolution 0.64M) and multispectral (resolution 2.50M) QuickBird images.
Field survey results were used to compare and analyze the band patterns of the orthography-corrected images and the spectral characteristics of each vegetation index.
Tukey’s multiple comparison tests were performed for a statistical significance assessment, and corresponding band combinations for tree species classification were set. Supervised classification, using the maximum likeli-hood classifier, was applied to the field survey area desig-nated as the training region.
The final stage of the study consisted of comparing the results of supervised classification against the field survey findings for the final accuracy assessment necessary for
[Table 3.] Transformation of vegetation indices
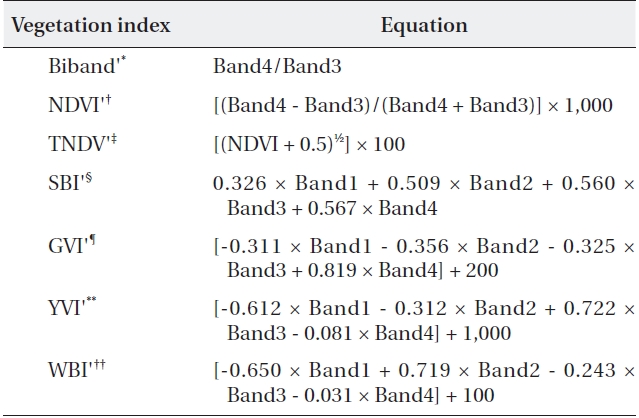
Transformation of vegetation indices
determining the feasibility of image-based tree species classification and its proposal.
Programs used for this study included: Arcview 3.2 and ArcGIS 9.2 for DEM construction; ERDAS 9.1 for image processing (ERDAS 1997). Also, QuickBird-2 images were used to produce and analyze a total of 7 vegetation indi-ces (Table 3).
Analysis of variance (ANOVA) was used to test for statis-tically significant differences among groups, using SPSS ver. 17.0 (SPSS Inc., Chicago, IL, USA), and Tukey’s mul-tiple comparison test was then used (
>
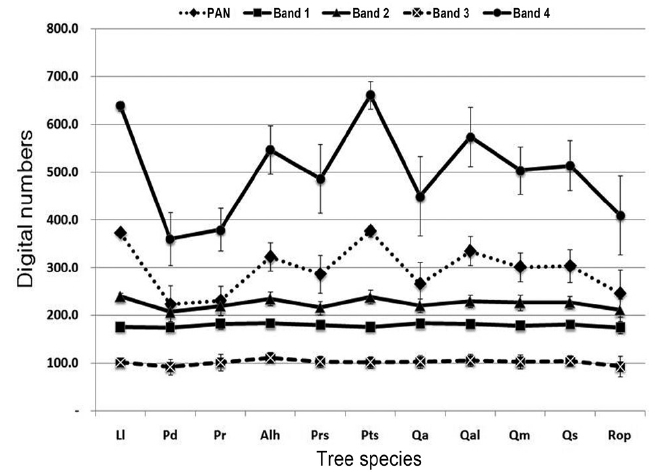
Comparison of the tree species derived from QuickBird-2 bands
QuickBird-2 band analysis show lower digital num-bers (DNs) for conifers,
>
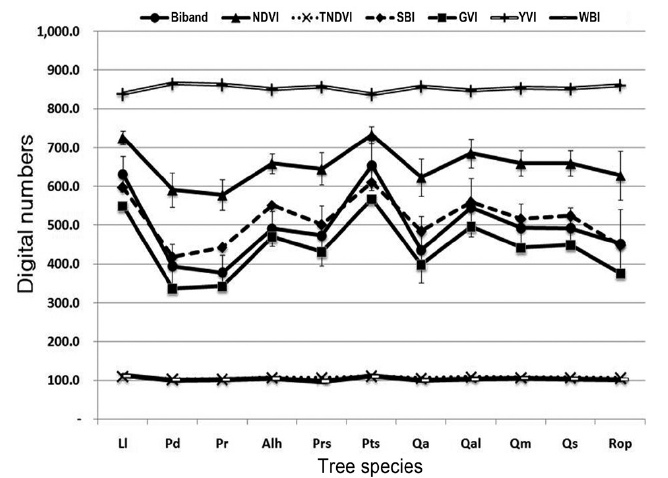
Comparison of the tree species derived from vegetation indices
A comparison of vegetation indices-based tree spe-cies spectral characteristics showed clear differences in the average DNs between tree species in the normalized
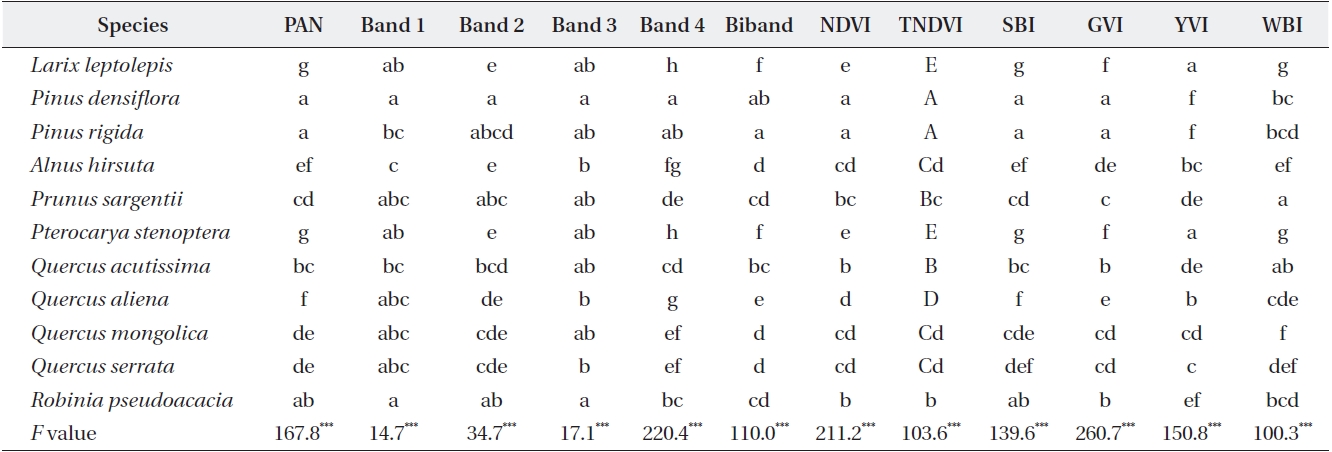
Tukey's multiple comparison test of the QuickBird-2 bands and vegetation indices with ANOVA analysis (N = 1450)
difference vegetation index (NDVI), green vegetation in-dex (GVI), soil brightness index (SBI) and Biband. Such a distribution pattern was similar to the one obtained from image band spectral characteristics comparison (Fig. 4).
>
Statistical significance assessment
Tree species were classified into
Using the significant differences in the QuickBird bands (Table 4), the group with high DNs included
A statistical significance assessment revealed varia-tions in the spectral characteristics among tree species in the PAN, Band 4, Biband, NDVI, SBI, and GVI. However, species’ signatures between
Based on the results of the statistical significance test, images of 5 QuickBird-2 bands and vegetation indices were collected and the maximum likelihood classifier was applied for automatic classification. Biband, however,
[Table 5.] Areas of each tree species in supervised classification
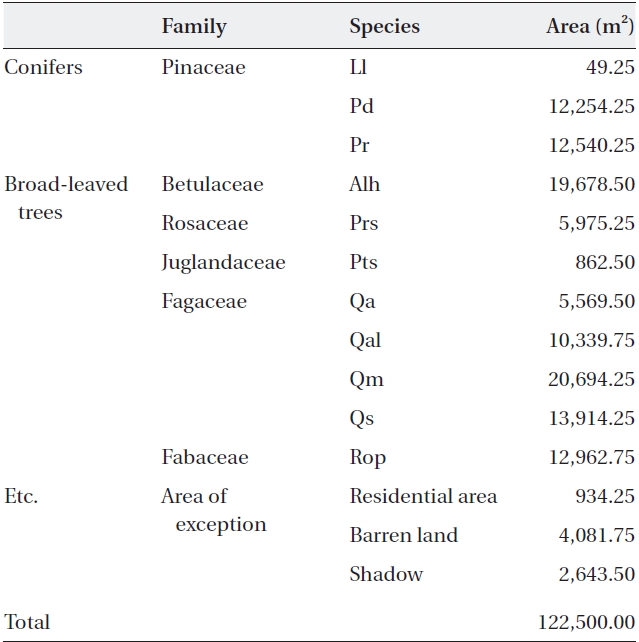
Areas of each tree species in supervised classification
was excluded from automatic classification in order to prevent potential errors because it failed to show normal distribution, despite optimal results in the statistical sig-nificance assessment.
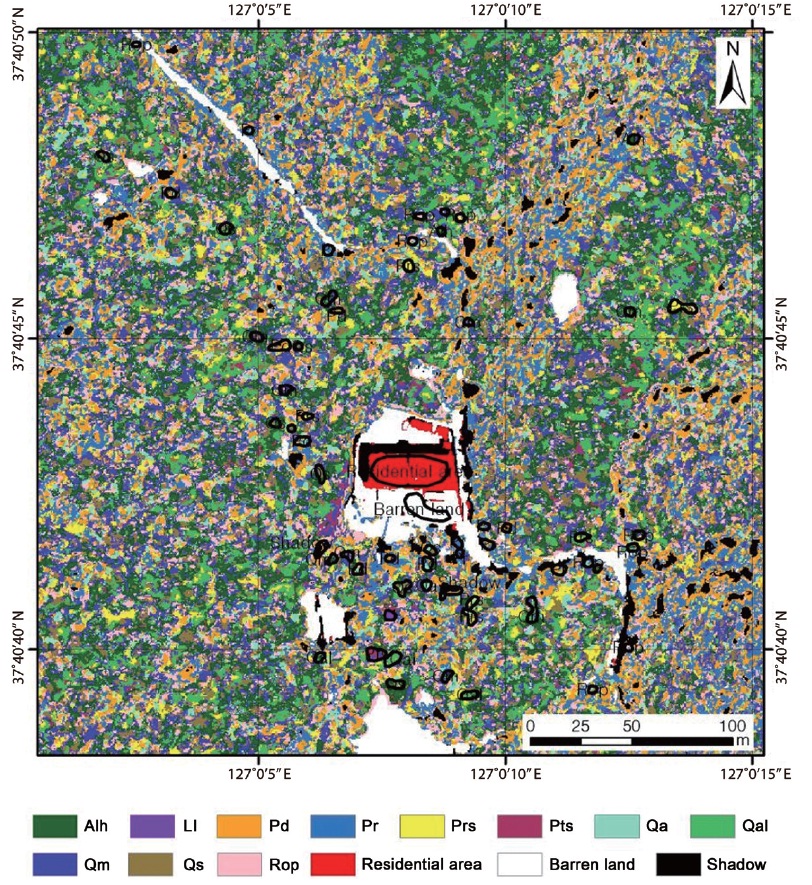
Results of the classification, as shown in Fig. 5, revealed that the
An accuracy assessment showed an overall accuracy of 74.1%. The three highest accuracy results were shown in
Using the results from a detailed vegetation survey, an area rich in tree species within the Bukhansan National Park was selected for tree species survey, QuickBird-2 image-based supervised classification, and accuracy as-sessment of the classification outcomes.
Results of the DNs value analysis of tree species showed that Band 4 and PAN images were useful for tree species classification using image bands. Conifers showed lower DNs values than broad-leaved trees in Band 4, with the exception of the
A statistical significance assessment of tree species spectral characteristics, based on Tukey’s test, showed similar spectral patterns among trees of the same genus, namely between
The study area for this research was limited to the Ui-
[Table 6.] Accuracy assessment of randomly selected pixels
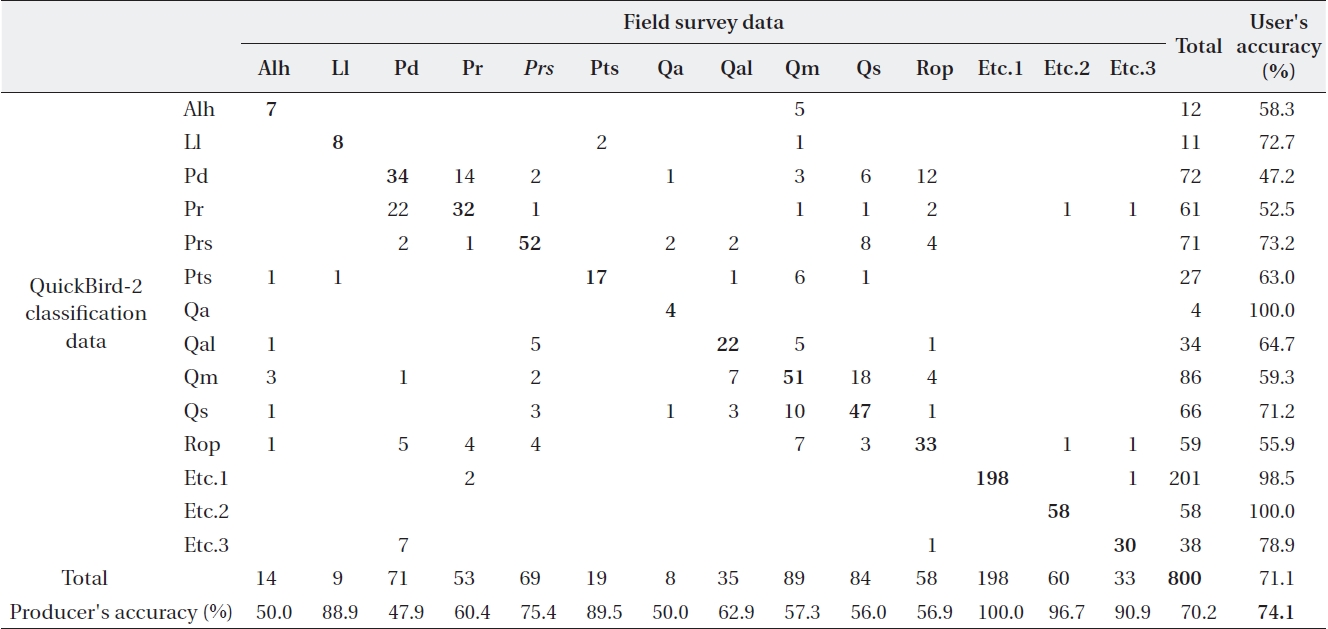
Accuracy assessment of randomly selected pixels
dong valley region and, thus, inevitable restrictions were imposed; a limited number of tree species, geographical signatures of the study area, and the season images were obtained, as variables in the study, and these were prone to affect the spectral characteristics of the tree species. Monthly or “all-season” image analysis in multiple areas is recommended for more reliable results.