Nutrient input and output in ecosystems is important for nutrient cycling. The rate of litterfall and decompo-sition as an important pathway for the transfer of litter mass and minerals to the soil surface in forest ecosys-tem has been quantified by many researchers (Gosz et al. 1973, Birk and Simpson 1980, Hobbie et al. 2006). Litter-fall is dominant among the aboveground components of nutrient input (Kim and Chang 1989, Shin et al. 2011), and litter production in forest ecosystems varies with commu-nity structure and nutrient conditions. Temperature, pre-cipitation, soil, light, and other environmental factors can also have an impact (Barbour et al. 1999). Litterfall gen-erally increases during succession and has been shown to peak at various times depending upon the region and forest type: 14 years in eastern Guatemala (Ewel 1976), 46 years in
Forest litter decomposition rates are known to be in-fluenced by macro- and microclimate variables (Edwards 1975, Insam 1990), as well as by the chemical composi-tion of the litter (Meentemeyer 1978, Melillo et al. 1982, Gallardo and Merino 1993, Rustad 1994, Laskowski et al.1995, Hobbie et al. 2006). On a global scale, rates of lit-ter decomposition are regulated by climate (Johansson et al. 1995). However, within a particular climatic region, litter chemistry was known to be the best indicator of decomposition rates (Taylor et al. 1991, Aerts 1996). Lit-ter lignin content is negatively related to mass loss and is positively correlated to the calcium content (Hobbie et al. 2006). Soil microbes biologically decompose most lit-ter and microclimate or microenvironmental conditions are also important factors for decomposition (Yavitt and Fahey 1986).
Decomposition rates are also related with succession. This rate was found to peak at 30 years in an
In a forest, litter production and decomposition are re-sponsible for the formation of the forest floor; this forma-tion is a long-term process that is indicative of the nutrient cycling rate (Johansson et al. 1995). Litter accumulates on the soil surface until litterfall equals litter decomposition; after which, the amount of litter accumulated on the soil surface oscillates around some mean steady-state value (Ewel 1976). Litter decomposition rates and forest floor characteristics yield information about the quality of lit-ter as well as the rates of nutrient cycling within an eco-system (Knoepp et al. 2000).
Ecosystem functional processes (e.g., productivity and decomposition) are generally known as important indica-tors of ecosystem stability or homeostasis (van Voris et al. 1980, Odum 1985, Rapport et al. 1985). Decomposition is a function of an ecosystem that includes a robust food chain supporting the desired biota, an adequate nutrient pool for desired organisms, and adequate nutrient cy-cling to perpetuate the ecosystem (Schaeffer et al. 1988). It is an important indicator of ecosystem stability involv-ing the interaction of vegetation, soil nutrient availabil-ity, micro- and macro-fauna, and microbial populations (Knoepp et al. 2000). If decomposition is impaired, the ecosystem is functionally impaired (Schaeffer et al. 1988). Decomposition rates can provide an accurate prediction of soil and site quality or productivity (Johansson 1994). Increasing rates of litter decomposition accelerate nutri-ent cycling rates within the site and indicates increased soil quality (Johansson et al. 1995). However, it is not easy to assess the status of nutrient dynamics based on pro-duction and decomposition without long-term monitor-ing. Gessner and Chauvet (2002) suggested a method for evaluating ecosystem health using a decomposition rate k (impacted)/k (reference) ratio in stream ecosystems. In the present study, another complementary approach for assessing ecological integrity of forest ecosystems is pro-posed, which compares decomposition rates calculated by litterbag methods and the mass balance on the forest floor along with real and the theoretical mass remains.
In general, littertraps and litterbags are used to measure litter input and output on the forest floor. However, these methods have inherent problems, including large varia-tion in litterfall from year to year, difficulties in account-ing for very small litter fragments, short experimental periods, and the accessibility of the litterbag to organism (Knutson 1997). To avoid these problems, Knutson (1997) estimated annual production and decomposition of litter by examining unconfined litter using the disappearance from a litter layer as a measure of decomposition. How-ever, it is still not easy to examine all unconfined litter, and many studies have used the litter amount in each lit-ter layer (e.g., Oi, Oe, Oa, and A horizon based on Brady and Weil 2008) to estimate decomposition rates in deciduous forests with the assumption that there was a steady state of litter input and output (Chang and Ko 1982, Chang and Kim 1983, Chang et al. 1987, Hobbie et al. 2006). However, decomposition rates estimated by the litterbag method and mass balance on the forest floor are based on differ-ent assumptions that do not often correlate.
For the litterbag method, decomposition rates can be estimated by an exponential decay model, with k being the parameter from the exponential equation:
Xt = X0 e-kt,
where X0 is the initial % weight; e the nature log constant; and k (1/y) the decomposition constant (Olson 1963, Swift et al. 1979). This can be converted to:
k = -1/t ln(Xt/X0).
In the forest floor, the decomposition rate can be esti-mated by mass balance assuming there is a steady state as follows (Olson 1963, Hobbie et al. 2006):
ki = L/F,
where L is the annual literfall organic mass, and F is the forest floor organic mass (Oi + Oe + Oa + A horizon organic mass). If litter dynamics in a forest floor are in a steady state, the k value should be the same or similar to the ki value. If the litterfall input on the forest floor is larger than the output, ki should be less than k.
Organic accumulation (OAcc) with continuous litterfall can be expressed by the equation:
OAcc = (L/k) (1 - e-kt),
in which the value of (1 - e-kt) is close to 1 when k is larger than 0.25 and t is longer than 30 years, and OAcc ? L/k. This OAcc is the theoretical organic accumulated mass on the forest floor at a steady state arrived at using current litter bag k values and current litterfall. This theoretical value can be compared to the actual organic mass on the forest floor (OMFF) to determine if current litter dynam-ics are faster, slower, or equal to those in recent decades over which the forest floor mass accumulated.
Here, I suggest a hypothesis: a comparison of k and ki will indicate the status of litter dynamics in forests. If k and ki or OMFF and OAcc are similar, then litter dynamics are assumed to be in equilibrium or a steady state. If the lit-ter bag-derived k values (indicative of current conditions) are smaller than ki calculated from actual forest floor data (integrated over past decades), then the OAcc estimated using current inputs and outputs will be greater than the OMFF actually measured, which means that, therefore, in the past, litter output has been relatively greater than litter input, as compared to that ratio currently. In con-trast, if k > ki, then the estimated OAcc will be less than the actual OMFF, and in the past, litter output has been relatively less than litter input, as compared to that ratio currently. Field data from forests on three well-conserved mountains that have been a part of the national parks in South Korea for more than 30 years are also presented to demonstrate how to apply this new approach. Loss or gain of litter mass would be expected to differentially af-fect germination and establishment of plants, soil inver-tebrates and vertebrates, and the exchange of CO2 with atmosphere, the carbon cycle, etc. (Schaeffer et al. 1988, Vitousek 1994, Knoepp et al. 2000, Gessner and Chauvet 2002). This study may play an important role in predict-ing litter-mass trajectories (steady state, increasing, or de-creasing forest floor organic matter) into the future.
I tried to find sites in a steady-state condition, which means that anthropogenic disturbances were not de-tected, and in the broad spectrum of sites, I tried to pro-vide enough variation in factors, such as slope, altitude, aspect, and dominant species, that determin forest floor mass, litterfall, and decomposition. Twenty-one sites on three mountains in the southwestern part of South Korea (Jirisan, Deokyusan, and Gyeryongsan) covering low to high altitudes and including representative forest species were selected (Table 1). Altitudes of the study sites ranged from 221 m a.s.l. in Gyeryongsan to 1,567 m a.s.l. in Deo-gyusan. Slope aspects of the study sites varied, and slopes ranged from 18-43°. Dominant species of trees in the sites were
The climate of the region is summer monsoonal. Mean annual precipitation was 1,400 mm in Jirisan; 1,270 mm in Deogyusan; and 1,350 mm in Gyeryongsan, and more than half of the precipitation falls between May and Au-gust. The mean annual temperature was 12.5℃ in Jirisan, 11.5℃ in Deogyusan, and 12.3℃ in Gyeryongsan. Soil types were silt loam or silt clay loam. Soil pH of the upper 5 cm ranged between 4 and 5 (Korea National Park Service 2002, 2004a, 2004b).
Rectangular litter traps with a 1-m2 internal surface area were used to intercept litterfall. The bottom of the traps was a 1-mm mesh stainless steel screen. The traps were fixed 1 m above the soil surface. Two traps in Jirisan and three each in Deogyusan and Gyeryongsan were placed at each site within 50 m × 50 m quadrats. Fallen litter was harvested in the 4th week of August and November in Jiri-san during 2001-2003, and the 4th week of February, 3rd week of April, and 4th week of May, July, September, and November in Deogyusan and Gyeryongsan during 2005-2008.
>
Litter decomposition experiments
Even though litter includes dead leaves, twigs, logs, fine roots, and soil microorganisms, dead leaf was the most abundant source of litter (Korea National Park Ser-vice 2002), and I used dead leaves as litter in this experi-ment. For each site, litter from the site for litterbags was obtained by collection of the litter on the Oi horizon of the forest floor in early November. The litter was mixed and air dried. Nylon litterbags measuring 20 cm × 20 cm with a mesh size of 1 mm were prepared. Litterbags were filled with 15 g of air-dried litter. The bags were anchored on the Oe layer of the forest floor with heavy gauge wire and covered with litter. Litterbags were randomly sampled in four replicates at each collection time (1, 6, 9, 12, 24, and 36 months) at each site. Samples of the initial litter and
[Table 1.] Characteristics of the study sites
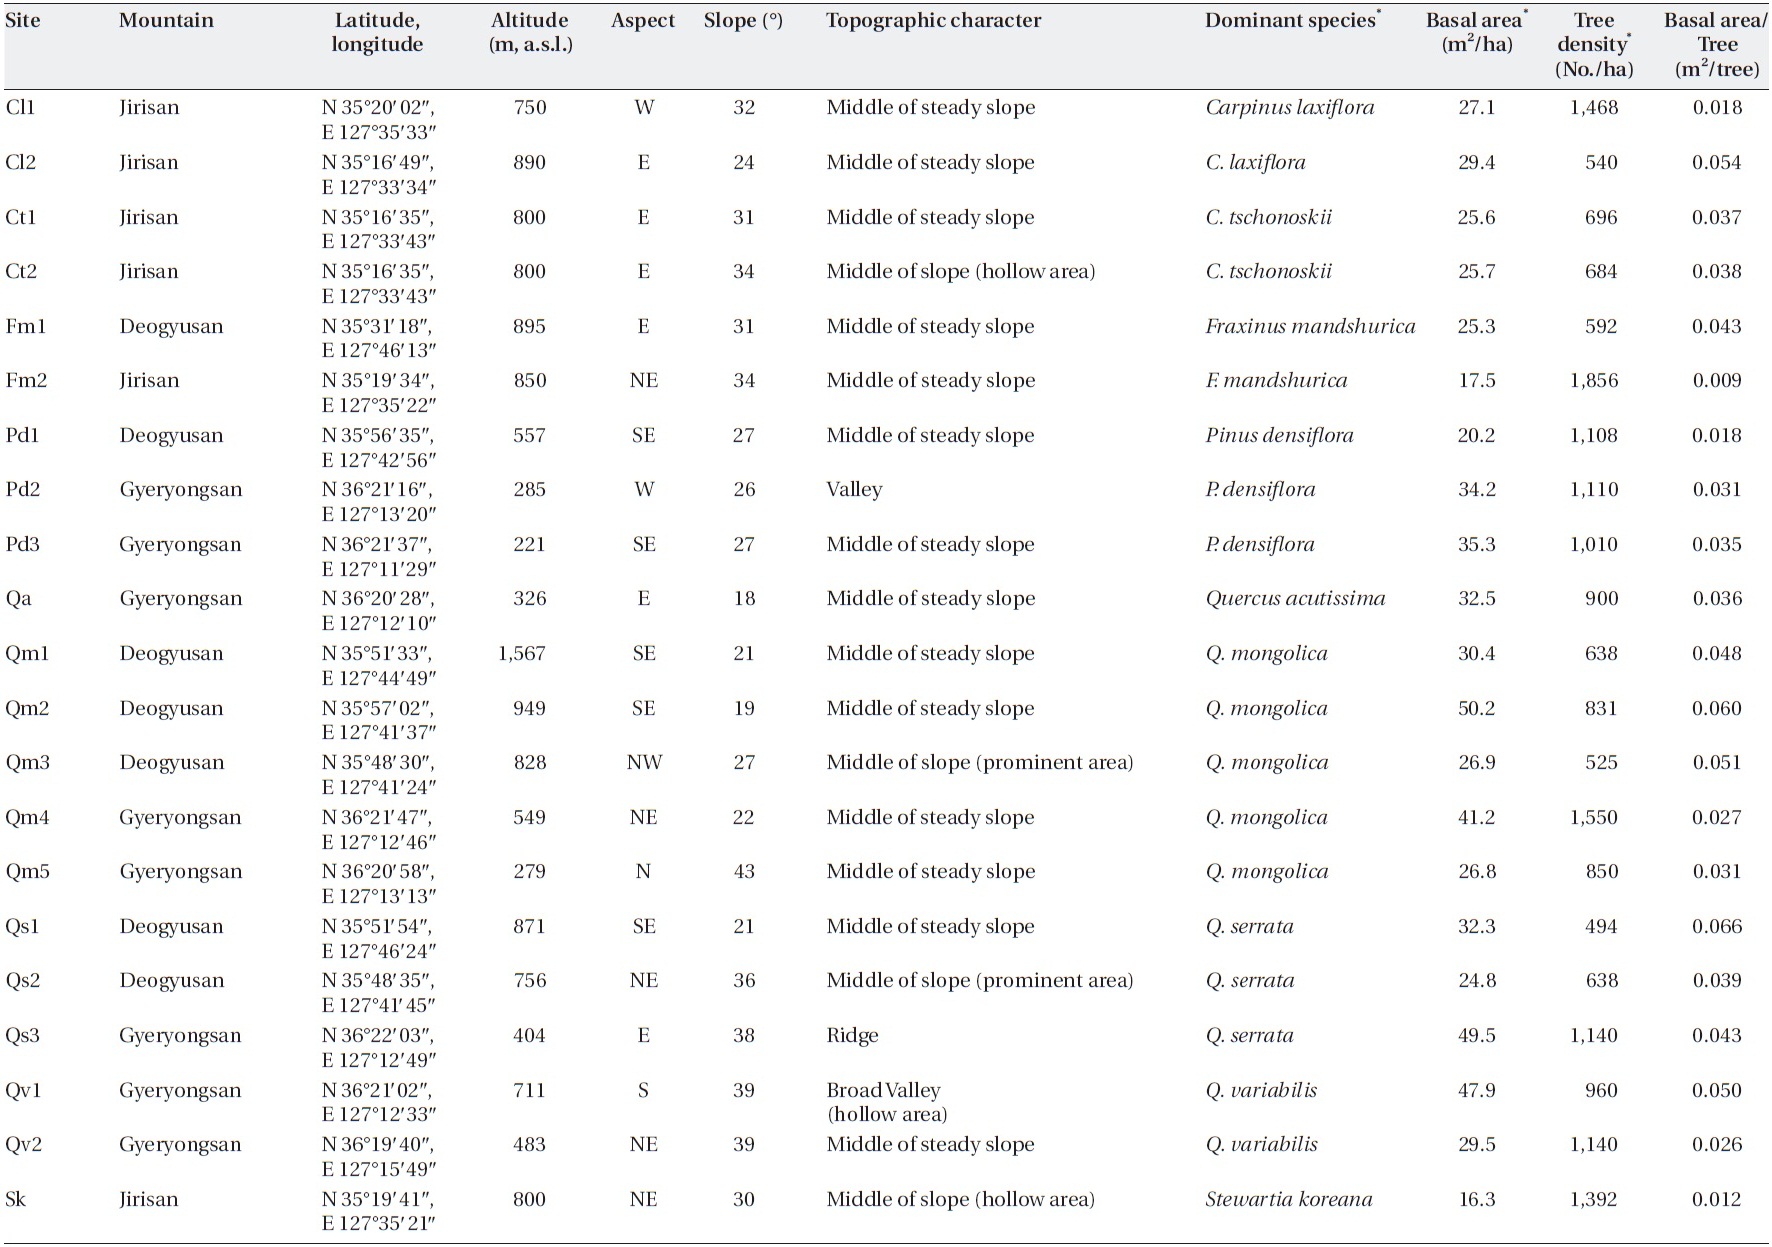
Characteristics of the study sites
all samples recovered from each site were ground in a Wi-ley Mill, passed through a #40 mesh screen, and analyzed for moisture content (dry for 24 h at 105℃) and ash-free weight (ignition for 4 h at 550℃).
>
Estimation of litter removal rate by mass balance
Litter was collected in two 20 cm × 20 cm quadrats on the forest floor in each 20 m × 20 m plot during the last week of November when almost all deciduous leaves have senesced in South Korea. Litter was divided into those on Oi (L) horizon and those on Oe (F), Oa (H), and A horizons (Coleman et al. 2004, Brady and Weil 2008). The collected litter was air dried and ground in a Willey Mill to be passed through a #40 mesh screen. Ground litter was ignited in a furnace at 550℃ for 4 h. The following calculations were performed with the ash-free mass.
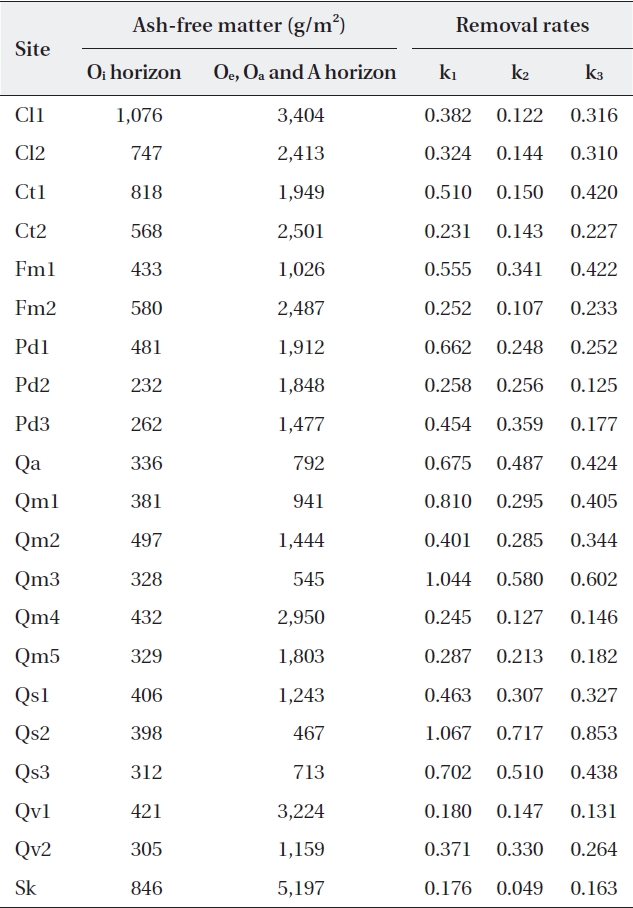
Hobbie et al. (2006) suggested calling the estimated de-composition rate by mass balance on the forest floor (ki) the “removal rate”; therefore I call ki (k1, k2, and k3) the “re-moval rate.” The removal rate, k1, on the forest floor was calculated assuming that there was a continuous litterfall

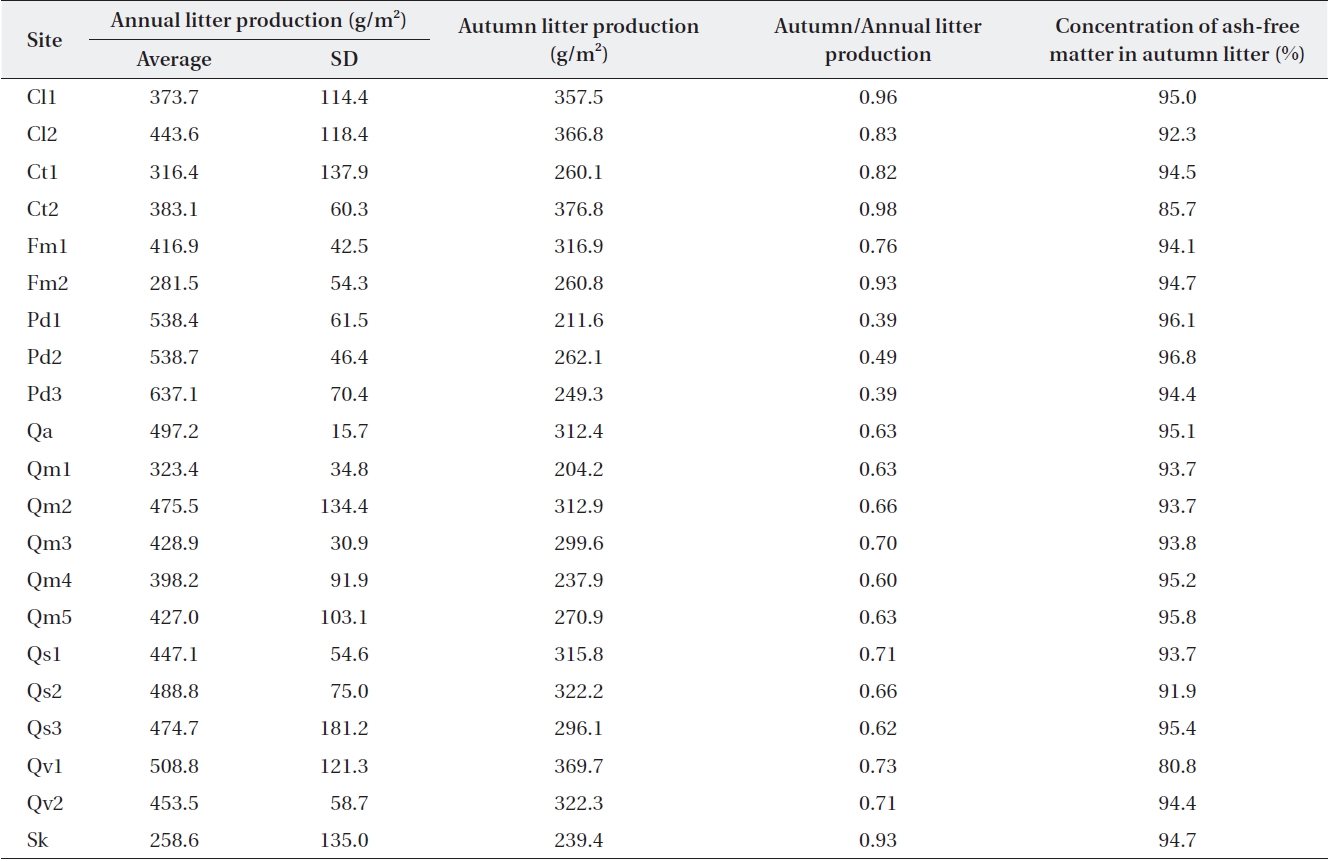
Average annual and autumn litter production over 3 y (2001-2003) in the Jirisan sites and over 4 y (2005-2008) in Deogyusan and Gyeryongsan sites
mass (L), following Olson (1963):
k1 = L/F,
where F is the forest floor mass at a steady state. Since litterfall was not fixed on the forest floor, litter mass on the forest floor was not the same as that collected in the littertrap. The ratio of annual litterfall to autumn litterfall was relatively constant in ecosystems where dominant species are the same (Table 2). Therefore, L was calcu-lated from the organic mass on the Oi horizon, and the autumn/annual litter production ratio in Table 2 can be represented with the equation:
L = Oi × (annual litterfall/autumn litterfall).
Since litterfall is relatively discrete in temperate forests, another removal rate (k2) was calculated using Olson’s equation for discrete autumn litterfall (Hobbie et al. 2006):
k2 = - ln(1 - Oi/T),
where T is the maximum forest floor organic mass (T = Oi + Oe + Oa + A). With this formula we can calculate the proportion of organic matter in the upper layer as com-pared to that in all layers and that minus 1 to get the value of the mass lost. For the comparison with other removal rate data from South Korea, k3 was calculated using the equation:
k3 = Oi/(Oe + Oa + A),
which is an adaptation of Olson’s exponential decompo-sition equation (Kim and Chang 1966, Chang and Kim 1983, Chang et al. 1987). If Oi mass of recently fallen litter is greater than the organic mass in all the other layers be-low it, then k is fast (perhaps even greater than 1 per year). If Oi is less than the accumulated mass in all the other lay-ers below it, then k is slower than in the example above.
All data on mass loss were converted to ash-free mass because we could not remove all soil particles from the decomposed litter and forest floor mass. Olson’s negative exponential decay model was used to calculate the litter-bag decay constant, and all regression analyses were done by MS Excel (MS Excel 2000; Microsoft Cooperation, Red-mond, WA, USA). Pearson’s correlation coefficients were also calculated using MS Excel. The theoretical organic matter remaining on the forest floor (TOM) was calcu-lated using the equation:
TOM = L/k.
I compared k, k1, k2, and k3 values to each other and also to the actual organic matter on the forest floor and TOM. The status of litter dynamics at each study site was deter-mined through this comparison.
Litterfall in Jirisan was collected only in August and November, and the ratios of autumn to annual litterfall in Deogyusan and Gyeryongsan were applied to the other months in order to obtain estimates of annual litterfall in the same or similar species stands. Annual litterfall in the litter traps (Table 2) ranged from 259 g/m2 at Sk in Jirisan to 637 g/m2 at Pd3 in Gyeryongsan (434 ± 91.6 g/m2). The amount of autumn litterfall was 39-49% of the annual lit-terfall in evergreen
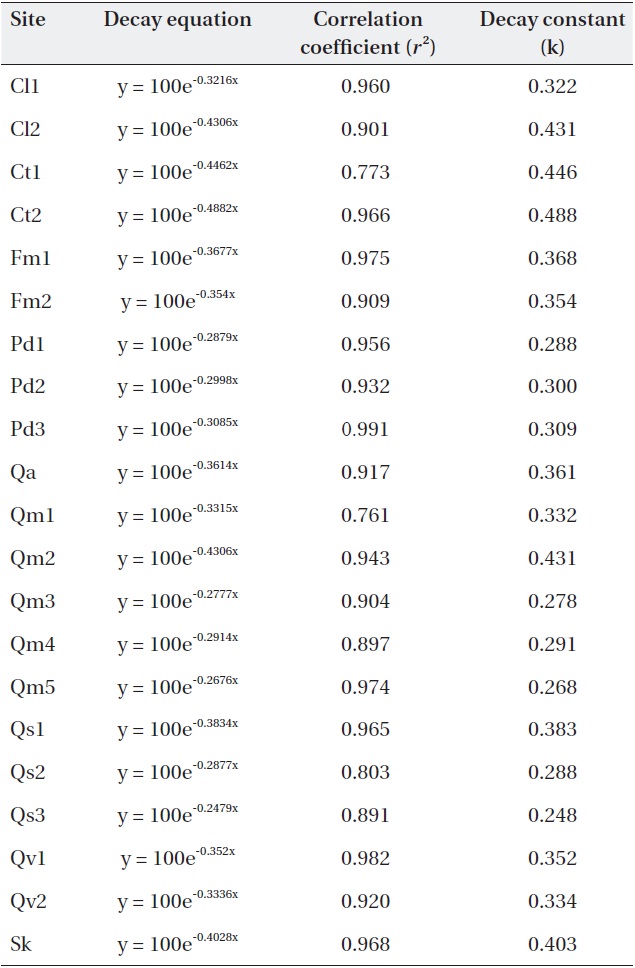
Negative exponential decay models provided accurate descriptions of the litterbag data (Table 3). All regres-sions were significant (
[Table 3.] Negative exponential models and decay constants (k; 1/y) of the study sites.

Negative exponential models and decay constants (k; 1/y) of the study sites.
>
Litter on the forest floor and removal rates
Ash-free mass ranged from 232 g/m2 to 1,076 g/m2 (485 ± 218.7 g/m2) for the Oi horizon, and from 467 g/m2 to 5,197 g/m2 (1,881 ± 1,152.0 g/m2) for the other (Oe, Oa, and A) horizons (Table 4). The litter amount of the Oi ho-rizon was not significantly related with autumn litterfall (correlation coefficient
[Table 4.] Litter on the forest floor and mass balance-derived constants at the study sites

Litter on the forest floor and mass balance-derived constants at the study sites
It is known that litter production in deciduous temper-ature forests shows discrete annual production in the au-tumn (Olson 1963). However, the present study found that about 30% of the annual litter production occurs during the other seasons (also Sharma and Ambasht 1987, Kim and Chang 1989). The amount of litterfall is highly variable according to time and space, and this variability should be estimated for comparison (Sharma and Ambasht 1987, Knutson 1997). Long-term data sets need to be used for making this type of estimate. This is highlighted by the finding in which the standard deviation for our three-year data from Jirisan ranged from 16% to 53% of the mean, and those of the four-year data from Deogyusan and Gy-eryongsan ranged from 3% to 38% of the mean.
When litter falls on the forest floor, it can move by wind or gravity. Movement depends on several factors, includ-ing the intensity and direction of wind, micro-topogra-phy, and density of shrubs (Lee and Cho 2000). Thus, the amount of litterfall produced in autumn as measured by the litter trap was different from the litter on the Oi hori-zon of the forest floor in late autumn. Comparison of an-nual litter production should be done on litter trap-based data because the litter amount on the Oi horizon differs according to micro-scale environments, and the litter amount on a forest floor at a specific site may not be rep-resentative of the whole forest ecosystem.
Hobbie et al. (2006) calculated k1 and k2 based on Ol-son’s models. They used annual litter production and lit-ter amount on the O horizons to calculate k1. To calculate k1 from mass balance estimates, the annual litter produc-tion data should be corrected with annual deposition data because the fallen litter does not remain fixed in any particular spot. This can be calculated with the equation L = Oi × (annual literfall/autumn litterfall). If the annual litterfall data is converted to annual deposited amounts, the conversion factor should be determined by compar-ing the autumn litterfall and litter amount in the Oi layer at the end of autumn. If the Oi data from autumn is con-verted to the annual deposited amounts, the conversion factor should be determined by comparing the autumn litterfall and annual litterfall. Knutson (1997) calculated a conversion factor in the deciduous forests of northeast Iowa as the ratio of litter mass in the quadrat to the litter-box on the forest floor, and the mean of conversion fac-tors from 1984 through 1993 was 1.5 (range, 1.32 to 1.75; SD, 0.150). In the present study, the latter conversion fac-tor was used, and the mean ratio of annual litterfall and autumn litterfall was 1.48 (range, 0.95 to 2.56; SD, 0.453).
Hobbie et al. (2006) suggested that calcium is respon-sible for the difference between k and k1, and found that litter calcium was significantly related to k2. However, this was not the case for this study because calcium in the soil was not correlated with the difference between k and k1 (Korea National Park Service 2002, 2004a, 2004b). The removal rates calculated by mass balance for many litter types were not always slower than the decay rates calcu-lated from litterbags.
Even though decomposition in the litterbags was mea-sured for only 2 or 3 years, the decay rate (k) may not change with time because it was calculated using a re-gression equation of exponential decrease. Therefore, the decay rates may not have slowed with time as the relative amount of recalcitrant materials in the litter increased, which was suggested by Hobbie et al. (2006). If the litter-bag decay constant (k) and mass balance removal rates (ki; k1, k2, and k3) are compared, k is unrelated to ki, as was previously described by Hobbie et al. (2006). However, there were significant relationships among the removal rates themselves. Regression equations were k2 = 0.5639k1 + 0.0119 (
>
Assessment of the state of litter dynamics
In this study, the decay rate and several types of re-moval rate were calculated. If litter dynamics on the forest floor were in a steady state, the decay rate (k) and removal rate (ki) should be similar. However, they were similar at some sites and different at others. Some difference might have resulted from the differences in methods because a smaller fraction than mesh size was assigned to decom-posed matter in litterbag method but the removed frac-tion at the site was only assigned to decomposed matter in mass balance estimates. Nevertheless, this difference is natural where the litter dynamics at the study site were not in equilibrium. Olson’s equation k1 = L/F assumes that there is a steady state between input and output. Kim and Chang (1966) also assumed the steady state of litter input and output to calculate k3. Thereafter, many studies were done in South Korea (Chang and Ko 1982, Chang and Kim 1983, Chang and Chung 1986), and Chang et al. (1987) presented a decay map for South Korea that reflects lati-tude, altitude, and dominant species. However, k and ki were not similar at many sites in the present study. This means that litter input and output was not in equilibrium at those sites. As mentioned earlier, the litterfall amount on the Oi horizon in autumn is not the same as the fallen amount in autumn at many sites because of micro-scale environmental differences, such as the location of the study site on a slope. This might be responsible for the difference between the decay rate and removal rate.
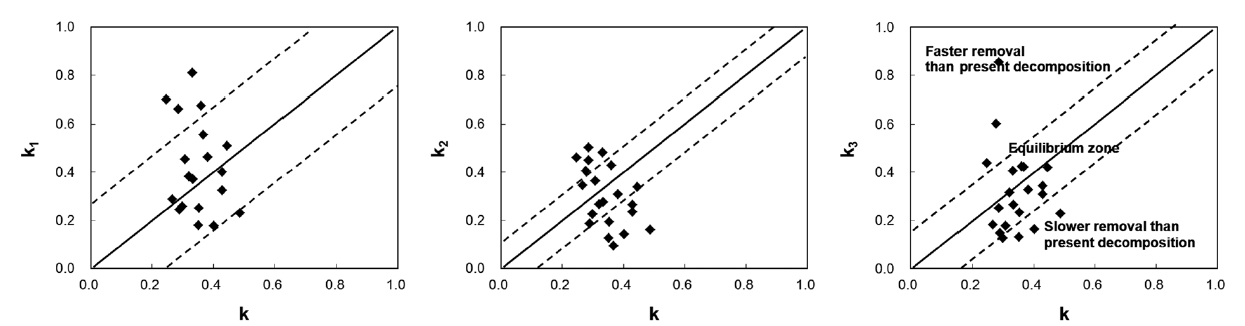
The use of a diagram showing the relationship between k and ki is suggested (Fig. 1). In the diagram, a diagonal line is drawn to indicate a 1:1 relationship, and two addi-tional lines are included on either side of the diagonal line to represent one SD of the k3 values. One SD of the annual litter fall was less than 38% of the mean for 4 years, and k3 closely represents the uncertainty of removal rates in the studied communities. If a site was between the two dot-ted lines, the litter dynamics on the forest floor would be defined operationally in equilibrium. However, this does not mean that they actually are. If a site was located in a faster removal zone, past long-term removal rates would be higher than the present decomposition rate. This might be true in old forests because these areas will tend to be inhabited by species resistant to decomposition with succession (Odum 1960, Kazakou et al. 2006, Cor-tez et al. 2007). Consistent species composition that has not changed remarkably might have resulted from lower input than output. If a site is located in a slower removal zone, the past long-term removal rate will be lower than the present decomposition rate. Litter removal in slower
removal zones will exceed the litter input, and a balance between removal and input will be achieved. From this analysis, the state of litter dynamics can be determined, and future changes can be predicted.
In the present study, all 21 sites contained well-con-served and stable ecosystems, and these should have been in equilibrium. However, only 14 sites were in equi-librium: four sites (Ct2, Pd2, Qv1, and Sk) were in a slower removal zone, and three sites (Qs2, Qs3, and Qm3) were in a faster removal zone. This was probably due to the loca-tion of the litter collection sites: four sites were in a valley, and three sites were on a ridge. Litter is blown by wind from ridges to valleys where it accumulates. This implies that litter should be collected at sites located in the mid-dle of steady slopes to calculate the mass balance (ki). This study also suggests that the range of variation of k3 in the equilibrium state is k ± 0.1743 in South Korea.
The other way to assess the state of litter dynamics on a forest floor is to compare the remaining mass on the forest floor with the theoretical mass remaining on the forest floor. Here, the theoretical mass remaining can be calculated based on Olson’s exponential decay equation: dm/dt = m0 e-kt. If the mass input is in equilibrium, the mass remaining in the equilibrium state is an integral of this equation at t = ∞; m = m0/k, where m0 is the annual input on the forest floor. The m0 can be the actual input at the litter collection site and can be calculated from the conversion factors that were used to calculate k1.
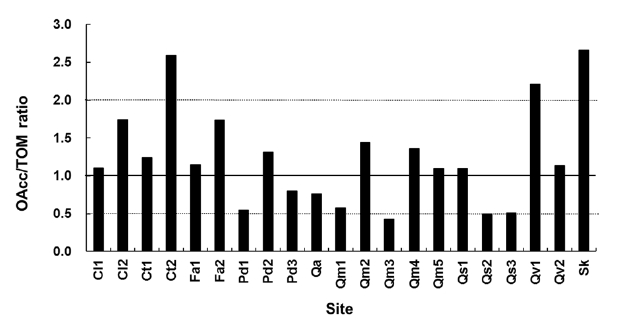
If the OAcc/TOM ratio at a site is larger than 1, then ac-cumulation would exceed decomposition. If the OAcc/TOM ratio were smaller than 1, the removal rate would be larger than the input rate. There are two possible mecha-nisms of higher accumulation than expected from the de-cay rate (k). One is the change in litter quality over time. The other is the larger input or production of litterfall than of decomposed or removal amounts. However, the
data in this study indicates that there should be a reason-able range of deviation of the OAcc/TOM ratio because of the annual variation in litterfall. The OAcc/TOM ratio in the equilibrium state based on the k3-k diagram ranged from 0.4 to 2.7 (Fig. 2). The Ct2 and Sk sites were in a hol-low area and have highest the OAcc/TOM ratios.
Even though decomposition is driven by the environ-ment on both regional and micro-site scales, the sub-strate quality of litter, the composition of the decomposer community (Parton et al. 1987, Aerts 1996, Cornelissen 1999), and the magnitude of species-driven differences may be much larger than previously thought and greater than climate-driven variations (Cornwell et al. 2008). Lit-ter quality changes with succession (Cornwell et al. 2008). In general, fast-growing, poorly-defended species of an-giosperms produce litter with a high decomposability; whereas, slower-growing, better-defended species pro-duce poor-quality litter with low decomposition rates (Cornelissen et al. 1999). Among the sites in the present study, Pd1, Pd2, and Pd3 were dominated by the gymno-sperm
In this study, the range of decay rates (k) among the sites was small, even though the sites were dominated by different species. However, the range of removal rates was relatively large. This does not reflect the difference in decomposition rates but rather differences in input and output on a small scale. The range of ash-free litter on the Oi horizon was large, but the input amount was not solely responsible for the OAcc/TOM ratio. Microenvironmental factors such as rock coverage, soil texture, moisture con-tent, and topography might be responsible for the input/output difference.
In conclusion, the present study shows that litterfall dynamics on the forest floor can be understood through the comparison of k and ki and the OAcc/TOM ratio. However, the mechanism of litter dynamics cannot be understood only through conventional experiments, and, therefore, further research on microenvironmental fac-tors that affect the litter output/input in different ecosys-tems is required.