Quercus aliena and Q. serrata are both occur as natural vegetation alongside natural freshwater bodies of the southern Korea Peninsula. Q. serrata dominates over Q. aliena as secondary forest vegetation in the present day. In order to explain these natural distributional traits of the oak species, we conducted some experiments with oak seedlings which treated with major important environmental resources, including light, moisture and nutrients, under controlled conditions. We then measured the ecological niche breadths and overlap from 15 eco-morphological characteristics. The ecological niche breadth of Q. aliena and Q. serrata were higher in terms of the nutrient factor applied, but was lower terms of light. The niche breadth of Q. serrata was wider than that of Q. aliena in light and moisture exposure. On the other hand, the niche breadth of Q. aliena was similar with that of Q. serrata in terms of the nutrient factor applied. These results imply that Q. serrata has a broader ecological distribution in over a wider variety of light and moisture environments than that of Q. alien. Ecological niche overlap between two oak species was the widest in terms of the light treatment factor applied, and narrowest in terms of moisture. This response pattern was also verified by cluster and principle component analysis. These results suggest competitive interactions between Q. serrata and Q. aliena seedlings may be higher for light resources than moisture or nutrient resources, and that Q. serrata is more shade tolerant than Q. aliena.
Ecological niche had been introduced by Grinnell (1917) who interpreted it as the ultimate distributional unit of a species in a spatial sense. Later, the ecological niche was used explaining the niche functional aspects when describing an organism’s place in its biotic environment in connection with its nutrition (Elton 1927). Hutchinson (1957) reported that niche is the sum of all the environmental factors acting on the organism, a region of an n-dimensional hypervolume. Ecological niche was also defined as the functional role or status of the organism within its community and ecosystem resulting from the organism’s structural adaptations, physiological responses, and specific behavior (Odum 1969).
Ecological niche has been divided into two categories, ecological niche breadth and ecological niche overlap. The niche breadth of a given species and for a given parameter is the range of environmental tolerance between the maximum and minimum of that parameter, under which the species may survive. It is the scope of tolerance and is dependent on the response of a species to the environmental factor which it describes. Species with small niche breadths refer to species with narrower distributions within nature, and smaller sizes of populations. whereas an organism with a larger niche breadth refers to its wider range in nature and larger size of populations owing to its adaptability to changing environments (Pianka 1983).
Ecological niche overlap means a similar response to an environmental factor or the utilization of the same natural resource by two or more species, and because competition intensity increases with higher niche overlap (Schoener 1970, Hanski 1978, Hulbert 1978, Yimin et al. 2006), intra- or interspecific competitions can be estimated and compared by ecological niche overlap (Abrams 1980).
In Korea, deciduous oak species dominate in the south and central regions (Kim et al. 1981).
However,
Over the past few years, only several studies based upon manipulative experiments for these two species’ ecological traits. Thus, in order to understand the ecological difference and similarity between these two oak species in the natural forest, it is essential to examine each of their ecological niches, based on experimental data obtained from several controlled environment treatments (Grime et al. 1998). Linking the observed distributions of species in their native ranges to ecological niches offers a framework for predicting species distributions (Albright et al. 2010). The object of this study is to clarify these ecological characteristics in order to explain the distribution of these two oak species. Thus, we conducted growth analysis and measured ecological niche breadth and overlap between
>
Collecting seeds of two oak species
The seeds of both oak species were collected from the foot of a mountain at Shingwan-dong, Gongju-city, Chungnam Province, with a geographic location of 127°07′ E to 36°27′ N, and an altitude of 27 m above sea level in October of 2009. The seeds were sorted according to similarity of size, and were then stored at 4℃ for approximately 6 months, until they were sown prior to the initiation of the experiment. Two acorns of each species were sown in each of 48 pots (diameter 23.5 cm, height 24 cm) filled with sterilized river bed sand in April, 2010, and the acorns germinated after 2-3 weeks.
>
Gradients of environmental factor
Three environmental factors, light, moisture and nutrient, were known to usually be the most important agents influencing the distribution of plants (Barbour et al. 1987). The seedlings of each species were treated with these three environmental factors, each consisting of 4 gradients. There were four replications of each treatment for each species, giving a total of 8 seedlings applied to each treatment, and an overall total of 96 seedlings.
The four gradients of the light factor treatment were as follows: L4 (high light) (100% of full light within the greenhouse, 787.75 ± 77.76 μ mol m-2 s-1), L3 (medium high) (50% of full light, 389 ± 45.66 μ mol m-2 s-1), L2 (medium low) (30% of full light, 156.2 ± 29.15 μ mol m-2 s-1), L1 (low alilight) (10% of full light, 76.8 ± 2.16 μ mol m-2 s-1). Light was controlled by varying the number of layers of shade cloth surrounding each treatment. Light intensity was determined with a portable LI-COR (Model 250A; Li-Cor, Lincoln, NE, USA) light meter once a day, and average values were calculated.
The four gradients of the water factor treatment were categorized as M4-M1 (mL water/plant), which was provided to the plants every 3-4 days: M4 (700 mL), M3 (500 mL), M2 (300 mL), M1 (100 mL). The reference volume of water was determined by calculating moisture carrying capacity (700 mL) of a pot, and the remaining gradients (M3-M1) were determined by reducing the volume of each by 200 mL, so as to cover a range of moisture conditions.
The nutrient treatment was also classified into four levels: N4 (15%: 127.5 mg NH4+ -N, 82.5 mg NO3-N), N3 (10%: 85 mg NH4+ -N, 55 mg NO3-N), N2 (5%: 42.5mg NH4+ -N, 27.5mg NO3-N), N1 (0%: none). Potting media in the nutrient experiment were fortified once only at the start of the experiment at rates of 15%, 10%, 5% and 0% fertilizer which containing an ammonium nitrogen content of below 170 mg/L, and nitrate nitrogen at a concentration of 110 mg/L (Bio-Best bed soil, Seminis) per 1 kg of sand.
>
Cultivation and measurements
The seedlings of
>
Ecological niche breadth and ecological niche overlap
The proportional response of plants for each treatment, and along each gradient was calculated as a proportion of the sum of responses over all states (e.g., the total leaf area of each treatment was expressed as a proportion of the total leaf area for that species as the sum of all four treatments). Niche breadths were calculated for each treatment and gradient combination as follows (Levins 1968):
B = 1/ Σ (Pi 2) S
B: niche breadth (Levins' B)
Pi: relative response of a given species to the whole gradients that is realized in gradient i
S: total number of gradients that is all treatments
Niche overlap, the equivalency of responses between two oak species was assessed by proportional similarity between pairs of two oak species. Proportional similarity (Schoener 1970) was calculated as:
PS = 1 ? 1/ 2Σ | Pij - Pih|
PS = proportional similarity (niche overlap)
Pij = relative response of species j in the i the gradient
Pih = relative response of species h in the j the gradient
We conducted cluster analysis and principal component analysis by STATISTICA 7 (Statsoft, Inc., Tulsa, OK, USA) in order to clarify overall tendency of growth responses of both species according to environmental resource factors. The cluster analysis was used in terms of unweighted pair-group average, following estimated Euclidean distance, and principle component analysis (PCA) used spearman’s correlation value of measured variables (Noh and Jeong 2002).
In niche breadth of
In niche breadth of
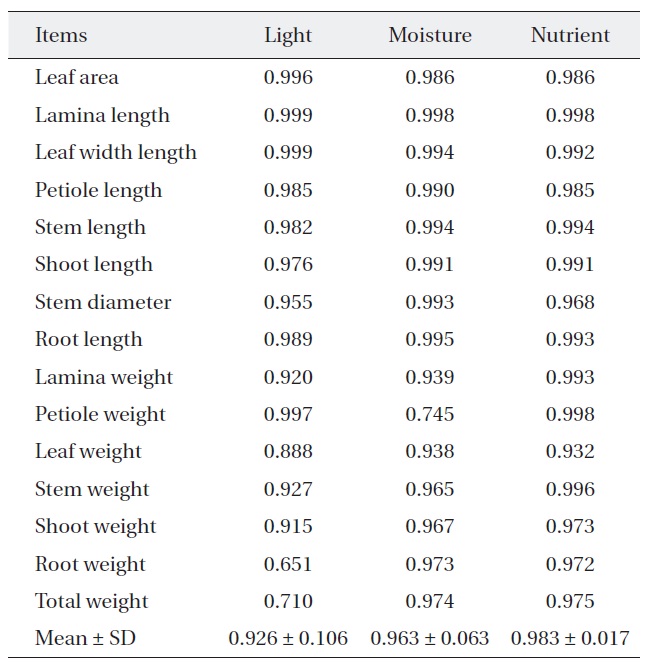
[Table 1.] Niche breadth of Quercus aliena along each environmental factor
Niche breadth of Quercus aliena along each environmental factor
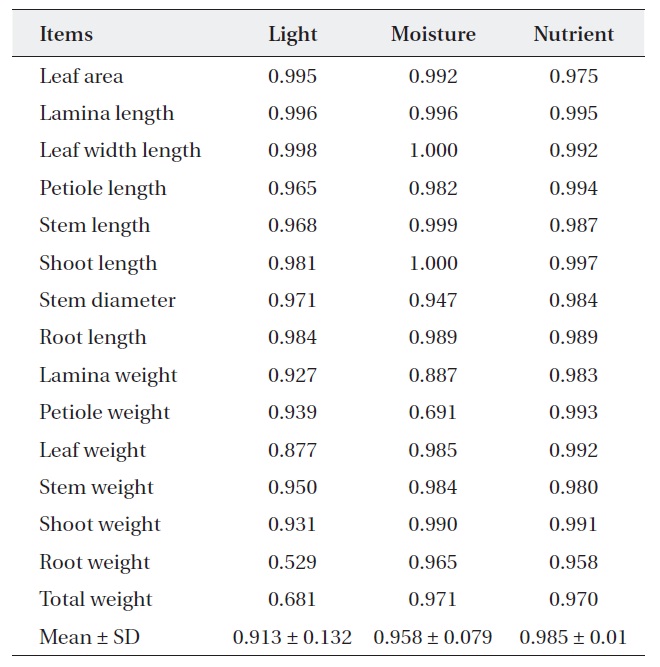
[Table 2.] Niche breadth of Quercus serrata along each environmental factor

Niche breadth of Quercus serrata along each environmental factor
treatments (Table 2). But, niche breadth of petiole weight, leaf weight, root weight and total weight was varied; nutrient (0.932-0.998) was wider than moisture (0.745-0.974) or light (0.651-0.997). Average niche breadth of
Ecological niche overlap between
For nutrient treatment, leaf area (0.894) and leaf weight (0.875) were relatively narrower, while the others were relatively wider (0.904-0.973). Lamina, petiole and total weight and stem diameter were shown to have a somewhat narrower overlap (0.826-0.897) between two oak species where moisture treatment. On the other hand, the rest of the characters showed a wider overlap (0.091-
[Table 3.] Niche overlap between Quercus aliena and Q. serrata along each environmental factor
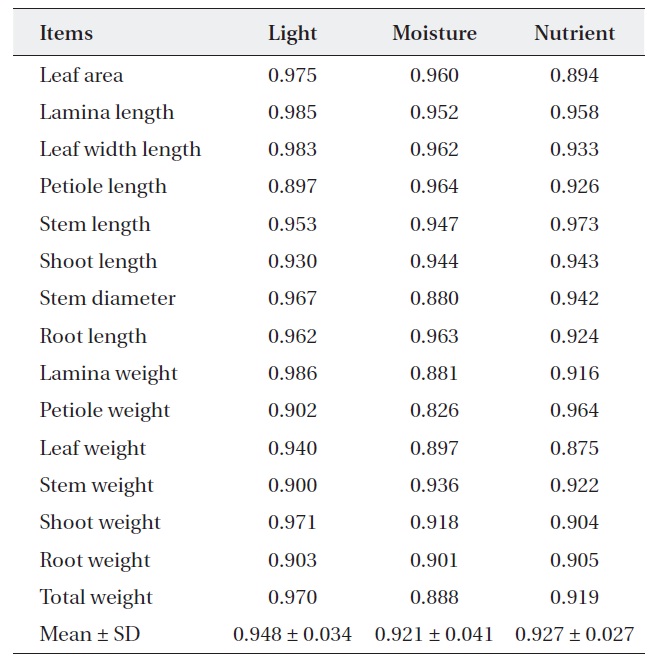
Niche overlap between Quercus aliena and Q. serrata along each environmental factor
0.964) (Table 3). These results mean that two oak species have also broader resource utilization in nutrient and moisture, but the extent of competition is less than light.
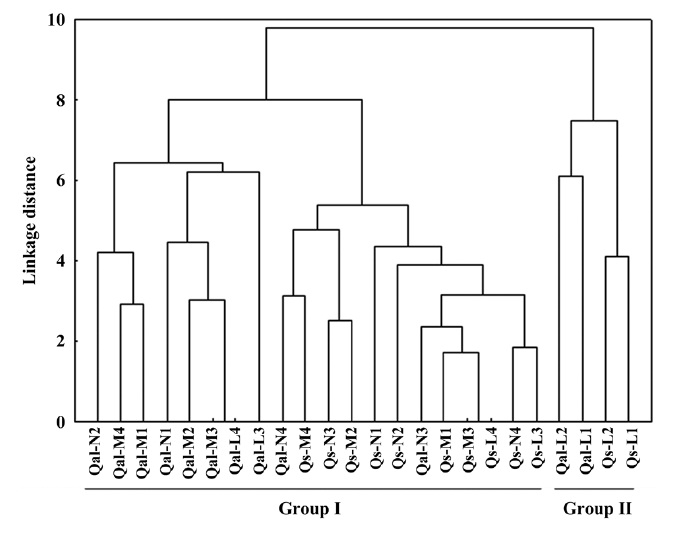
The environmental responses of two oak species was discriminated into two groups (Fig. 1). All the moisture and nutrient treatments, and light 3 level and 4 level of two species were clustered together in group I. Within
group I, the individual oaks were again divided into two sub groups: sub-group 1 (Qal-N2 to Qal-L3), sub-group 2 (Qal-N4 to Qs-L3). Qal-N4 and -N3 belonged to group of
>
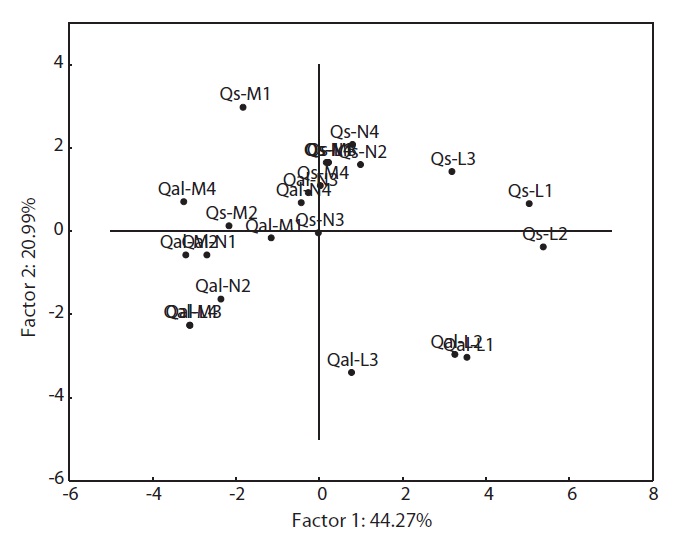
Principal component analysis
PCA was carried out on 15 eco-morphological variables (Fig. 2). Individuals of
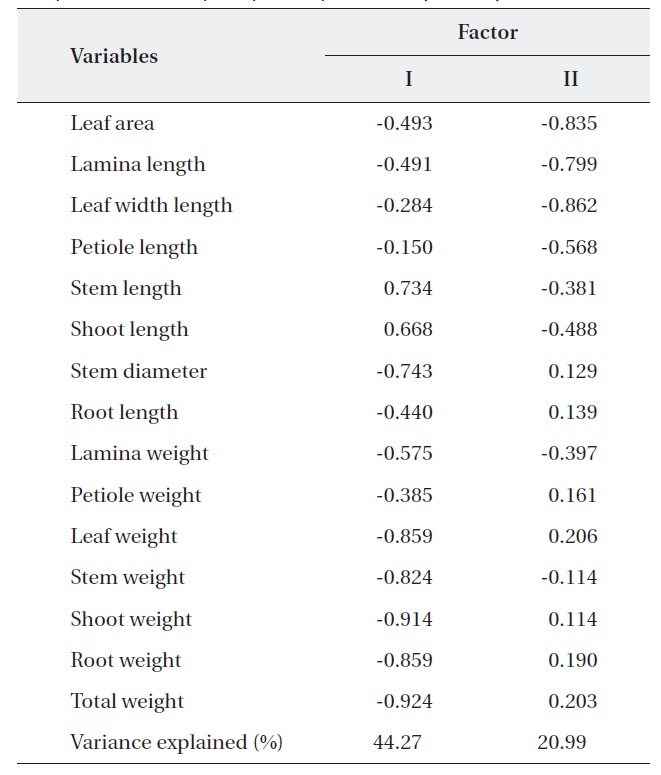
Correlation matrix of 15 variables with the first two principal component scores of principle component analysis analysis
The response of the two oak species to environmental resources was related with most of the measured characters rather, and more strongly related to a few dominant one. Within the similar habitats plant species display character convergence in terms of their physiology and life history (Cody and Mooney 1978, Walter 1985). Our results of the niche breadth of two oaks species were widest where nutrient treatments were concerned and narrowest where light treatment were concerned. Therefore, where any reasonable nutrient and moisture availability exists and in generally healthy natural conditions, light is the most influential factor for the two oaks species. According to Kim et al. (2008b), niche breadth of
In general, most early successional species have a relatively low shade tolerance and a broad ecological niche breadth in terms of light, due to their low light saturation point (Mandaak and Py?ek 2001). Also, the ecological niche breadth of early successional species is wider than that of late successional species (Lee and Bazzaz 1985). According to our study, the niche breadth of
We found that the ecological niche overlap of the two oak species was broader in terms of light conditions than in terms of water or nutrient availability (Table 3). Thus, competition between
Light is an important factor for early germination and seedling growth (Grime and Jeffrey 1965, Grime 1979, Canham et al. 1990, Gaudio et al. 2011, Jensen et al. 2012). Also, Hong and Nakagoshi (1998) reported that successful germination and sapling growth of oak in early successional stages is determined to a high degree by light conditions. We have discussed that
In terms of the results of cluster analysis, PCA compared well with clustering classification (Fig. 1). As Fig. 2 indicates, individuals of both oak species were found to be spatially overlapped in terms of those factors of axis I (-M and -N, L-1 and L-2) and to a lesser degree by those of axis II. The distinguishing characteristics of two oak species was related with axis II. Nutrient (-N) and moisture (-M) responses of the two oak species were closely located within the left group, and light levels (-L) except high light levels (L-3, L-4) were located on the right (Fig. 2). Based on the PCA, the ecological responses of the two oak species have similar patterns of cluster analysis (ex. Qal-N3, Qal- N4) in
The results of Table 4 validate the above results. The most correlation values with measured features (r < 0.5) means that the selected 15 variables were involved in ecological responses of both two oak species. These observations suggest that the configuration of the PCA of 24 individuals of
Finally, both oak species have narrower ecological niche breadths and a wide ecological niche overlap in relation to light resources, and the response pattern of the two oak species to the light factor was more pronounced than that for moisture or nutrient factors. These results mean that two oak species are clearly more influenced by light resources than water or nutrient resources.