Twitter can spread and share all kinds of information such as facts, opinions, and ideas in real time. In this paper, we empirically compare and analyze the topic categories in Twitter with all top 100 users in each of geographic region. We mainly consider the relationships among regions and selected four regions: Global, Seoul, Tokyo, and Beijing. Each of the top 100 users in Twitter is classified into a specific category and then statistical analysis is conducted. Among eight topic categories, the “Arts” category is the largest and the second is “Life”. The correlation between global and Seoul groups has the lowest value among the six pairs of relationships between regional groups, and this difference is statistically significant. We find that the Seoul, Tokyo, and Beijing regional Twitter groups, all in East Asia, have high topical similarity. Based on the correlation analysis, Seoul and Tokyo saliently show a sticky trend. The correlation coefficient presents very a strong positive correlation between Seoul and Tokyo. The correlation between the global group and the East Asian groups is relatively lower than that among the East Asian groups.
Twitter is the most popular micro-blogging and social media service and service in which it is possible to share information in real time. Twitter allows its users to send short messages to others and these messages are referred to as “tweets” and can be sent and retrieved through a variety of media. Twitter users are able to send short texts with mobile devices and “retweet” those messages to their followers. A great deal of information is shared across the globe via its real time network. Twitter can spread and share all kinds of information such as news, marketing, real time events, and even their ideas because the tweets are short and convenient.
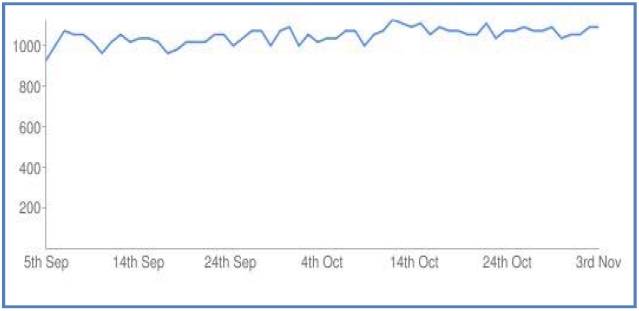
Twitter provides access to the thoughts, opinions, activities, and experiences of several hundred millions of twitter users in real time, with the option of sharing the user’s location. Fig. 1 shows the average number of tweets per second between September and November, 2010. As we can see from the figure, Twitter users send more than 1,000 tweets per second. Twitter as a new form of social network service has been widely adopted for personal and organizational purposes. This leads to dynamic new political, cultural and lifestyle trends. The popularity of Twitter has made this new social media service an attractive object of study. Many researchers have been investigating how these social media and data are used. This rich source of data is motivating a growing body of scientific study of user motivation and collaboration [1-5]. Some researchers have focused specifically on crisis management and collective problem solving in mass emergency events [6-9]. Recently, content analysis on Twitter has been carried out [10-18], and interest in this area has been increasing.
These studies include investigations of the characteristics of social networks, the role of real time sensors, analysis of tweets, and so on. However, the empirical analysis and topical comparison between countries of similar regions such as Seoul, Tokyo, and Beijing in the East Asian region are still in an early stage. Even though a great deal of information is shared via Twitter’s social network, little is known about who uses social networks and what topic categories they cover. Studies about regional similarity on Twitter in particular have not been published yet. In this study, we are interested in analyzing the regional topic variation in the content of the top Twitter, focusing on East Asia, specifically Seoul, Tokyo, and Beijing. We are motivated to investigate the feasibility of identifying regional similarities by statistical analysis.
In this paper, we empirically compare the trends in topics on Twitter with the top 100 users in each of the regions. To do this work, we collected the top 100 users in Twitter based on the number of followers. We thoroughly classified and analyzed them statistically. The rest of this paper is organized as follows. First, we present how we gathered data and what data were collected. Preliminary statistical analysis is also presented in section II. Next, each of the top 100 users in Twitter was categorized into specific categories. We introduce the statistical methods we used to analyze the data in this study. In section IV, we present the empirical comparison results focusing on regional similarities. Finally, we summarize our research and suggest some directions for future work in section V.
II. DATA PREPARATION AND PRELIMINARIES
We collected all of the top 100 Twitter users from each region, based on the largest number of followers. For the purpose of analysis by category, we considered regional relationships and selected four regions: Global, Seoul, Tokyo, and Beijing. We sometimes use the term East Asia for the 3 regions of Seoul, Tokyo, and Beijing. The total of all the top users of the four regions together is 400 people [19]. We analyzethe collected dataset for the purpose of understanding the basic statistics of the dataset in Twitter. These preliminary statistical analyses are shown in Figs. 2, 3, and Table 1.
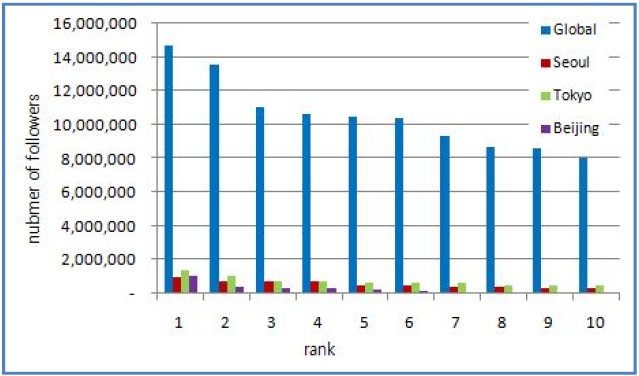
According to our investigation, as of October 20, 2011, Lady Gaga of the Global group had 14,694,619 followers. In Korea, 960,464 Twitter users follow Lee Oisoo. Lady Gaga had 15 times as many followers as Lee Oisoo did. More generally, the Global group has a large difference in number of followers compared to the East Asian groups as shown in Fig. 2.
[Table 1.] Statistics of top 10 Twitter users
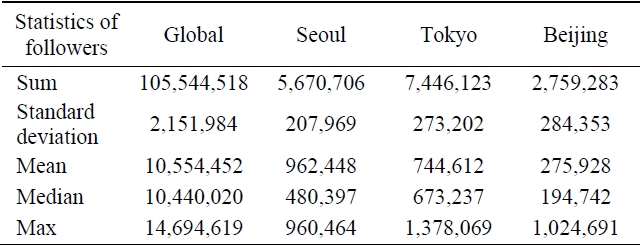
Statistics of top 10 Twitter users
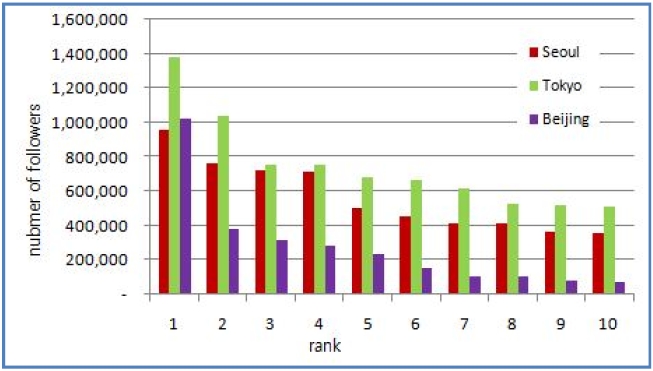
A comparison for East Asia on a smaller scale is needed. Fig. 3 shows the three major regions in East Asia in more detail. The statistics for the top 10 Twitter users are shown in Table 1. The number of followers in the US-centric Global group has significant differences from the other regions of Seoul, Tokyo, and Beijing.
We categorize topics by assigning a topic to a category and adopt a statistical method to analyze data by topic categories.
As shown in Table 2, we categorized topics by assigning a topic to category. Each of the top 100 users of Twitter was classified into a specific category. Basically, we use the classification of browsing interests in Twitter and adjusted some categories based on our own judgment. For example, music and art are classified separately in Twitter. However, in this study, music is classified as part of Arts since it is included in the arts conceived more broadly. First, we examined the topic words each user used in their biography. Next, we focused on the topic words that are classified into a category. In some cases, there were vague and difficult to determine. The results of this work are shown in Table 2.
[Table 2.] Specific topics in each category
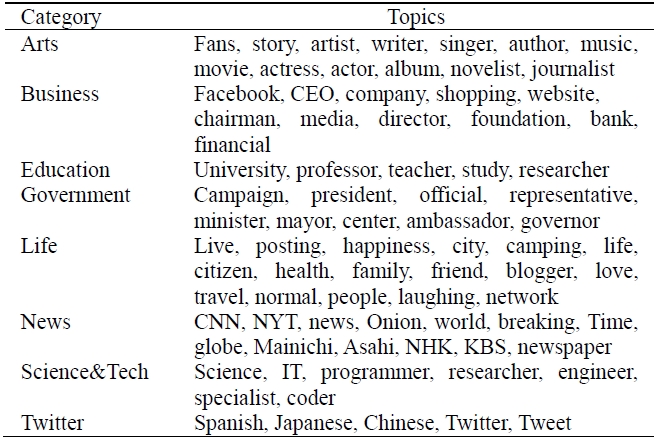
Specific topics in each category
>
B. Statistical Method for Analysis
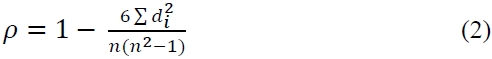
Correlations are useful because they can indicate a predictive relationship that can be exploited in practice. To analyze the categorized data for all of the top 100 users in each region, we used the Spearman’s rank correlation coefficient, which is defined as the Pearson correlation coefficient between the ranked variables. The
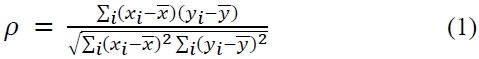
Tied values are assigned a rank equal to the average of their positions in the ascending order of the values. In applications where ties are known to be absent, a simpler procedure can be used to calculate
There are several other numerical measures that quantify the extent of statistical dependence between pairs of observations. It is common to regard these rank correlation coefficients as alternatives to Pearson's coefficient, used either to reduce the amount of calculation or to make the coefficient less sensitive to non-normality in distributions [21, 22].
IV. COMPARISON BETWEEN REGIONS
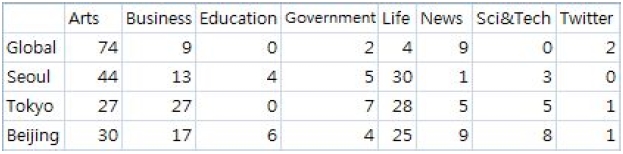
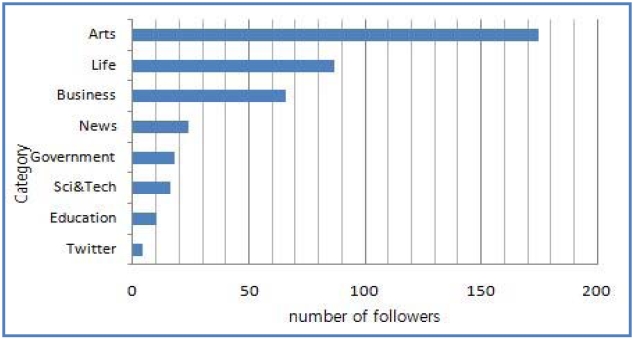
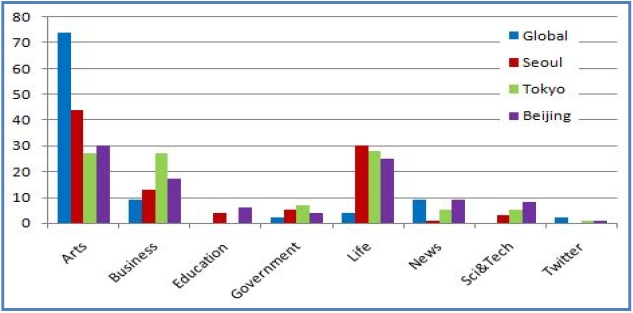
As we have stated, the purpose of this study is to compare the topic categories between regions in order to understand the regional similarity and thus help make better use of Twitter as an information source to find leading trends. In this section we compare and analyze the full set of data as described in section II. To do this work, we classify each of the followers into 8 categories by their acting region as shown in Table 3. Table 3 shows the sum of the followers for 8 divided categories. The category Arts is commonly strong among all of the investigated regions. Particularly, Arts is very high in Global but relatively lower in Tokyo.
[Table 3.] Comparison among Global, Seoul, Tokyo, and Beijing

Comparison among Global, Seoul, Tokyo, and Beijing
>
A. Distribution of Topic Categories by Global, Seoul, Tokyo, and Beijing Groups
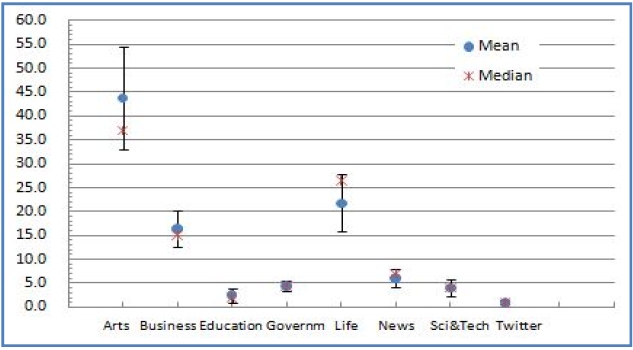
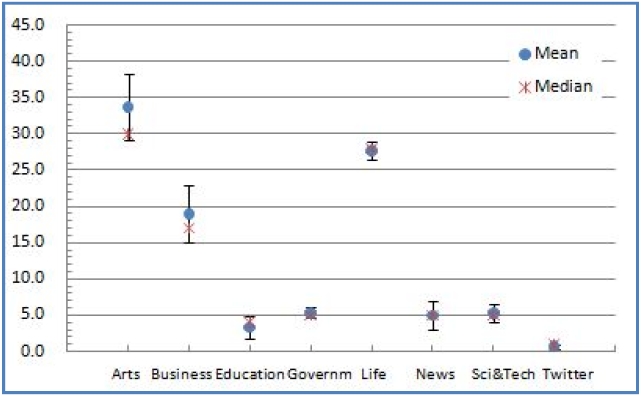
Many of the top 100 Twitter users are concentrated in a single category, as shown in Fig. 4. The most famous users in Twitter almost all belong to the Arts category. The Arts is a strong category in Twitter. In the Arts category in each of Seoul, Tokyo, and Beijing, the number of top users is almost same. On the other hand, as can be seen in Fig. 5, many famous top 100 users are classified into the Life category in Seoul, Tokyo, and Beijing. Fig. 6 presents the distribution of categories of the top 100 Twitter users by region. The statistics in Fig. 6 include the mean, median, and standard deviation for 8 topic categories. The vertical bars in Fig. 6 show standard deviations. In the Arts and Life categories, the standard deviation is larger than in any of the other categories. In the Arts category, this is due to the larger number of top 100 users from the Global group relative to the other groups, and in the Life category, it is due to the relatively small total number of users classified into this category.
>
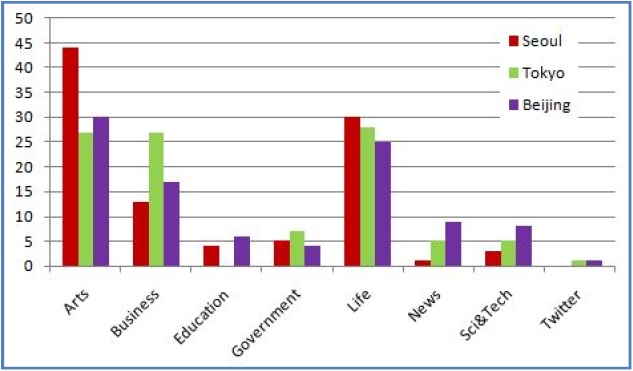
B. Comparison of Topic Categories by East Asia: Seoul, Tokyo, and Beijing
We are interested in finding categorical similarities among Seoul, Tokyo, and Beijing. To observe this in detail, Fig. 7 shows the number of top 100 users for the different categories in Seoul, Tokyo, and Beijing, but not the Global group. Here we can see some of the differences in the Arts category: Seoul is a little higher than the other two regions. This means that the number of followers in Seoul is larger than that in Tokyo and Beijing with regard to the arts. However, when compared to the Global representation in the Arts category, the representation in Seoul is not significant. These differences need to be analyzed in greater detail by using a correlation coefficient to measure the regional similarity. As can be seen in Fig. 8, the total number of standard deviations is decreased and each category becomes sticky. We found significant similarities in the values of the standard deviation for topic categories. When we limit the analysis to East Asia, regional similarity is revealed according to topic categories as shown in Fig. 8. This means that our statistical analyses are performed only for East Asia.
>
C. Correlation Analysis between the Global, Seoul, Tokyo, and Beijing Groups
Table 4 shows the correlation coefficients between the Global, Seoul, Tokyo, and Beijing groups; these values are calculated by the definition of the Spearman correlation coefficient. The correlation coefficient between the Global and Seoul groups is
[Table 4.] The correlation between Global, Seoul, Tokyo, and Beijing
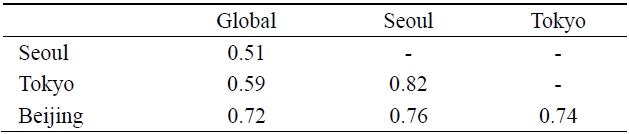
The correlation between Global, Seoul, Tokyo, and Beijing
The highest value in Table 4 is
We can say that the regional similarity for categories is high among East Asian countries based on the statistical results. Particularly, the correlation between Seoul and Tokyo is very high for topic categories on Twitter. The correlation between Global and East Asia is relatively lower than the correlation among the three East Asian groups.
Twitter is a micro-blogging service that has quickly organized a social networking service that can be used to obtain facts, opinions, and ideas, and even generate collectiveness in real time. The popularity of this social media has attracted the attention of many researchers. Among these studies, some have carried out content analysis of Twitter.
In this paper, we empirically compared and analyzed the categorical trends of Twitter with all of the top 100 users in each of four geographic regions. We thoroughly classified the specific topics into broader categories and analyzed their characteristics with statistical methods. To analyze the categories, we mainly considered their regional relationship and selected four regions: Global, Seoul, Tokyo, and Beijing. In the preliminary investigation, the number of followers of the top 10 Twitter users differed greatly by regional group, with a large difference between the US-centric Global group and the East Asian groups. The Seoul, Tokyo, and Beijing groups, but not the Global group, had a similar number of followers of their top 10 Twitter users. Our purpose was the analysis of the top 100 Twitter users in each of the regions. Based on the overall sums for each topic, the Arts category was the largest and the second ranking category was Life. In this case, the standard deviation between the Global group and East Asian groups was slightly larger than those among the other categories. When we observed only East Asia in more detail, then the standard deviations decreased; therefore, each category become similar. The correlation between the Global and Seoul groups was the lowest value among the six relationships. However, it was still statistically significant. This study found that Seoul, Tokyo, and Beijing, all of East Asia, have a high regional similarity in terms of topic categories in Twitter. Based on the correlation analysis, Seoul and Tokyo showed a particularly sticky trend. In the statistics, the correlation coefficient showed a very strong positive correlation between Seoul and Tokyo. The correlation between the Global group and the groups of East Asia was relatively lower than the correlation among the East Asian groups.