

Thedenoising of a natural image corrupted by Gaussian noise is a long established problem in signal or image processing. Today the research is focus on the wavelet domain, especially using the wavelet threshold method. In this paper, a wavelet-based image denoising modified adaptive thresholding method is proposed. The proposed method computes thethreshold adaptively based on the scale level and adaptively estimates wavelet coefficients by using a modified thresholding function that considers the dependency between the parent coefficient and child coefficient and the soft thresholding function at different scales. Experimental results show that the proposed method provides high peak signal-to-noise ratio results and preserves the detailed information of the original image well, resulting in a superior quality image.
The denoising of a natural image corrupted by additive white Gaussian noise (AWGN) is a classical problem in the signal processing community. The corruption of an image by noise is common during its acquisition or transmission. The aim of denoising is to remove the noise while keeping the signal featuresas much as possible. Traditional algorithms, such as the standard median (SM) filter and mean filter (MF) perform image denoising in the spatial domain [1-4,11]. In recent years, wavelet transform-based image denoising algorithms have shown remarkable success.
In 1992, Donoho and Johnstone [5] presented a method named wavelet shrinkage, and showed its obvious efficiency for signal denoising and inverse problem solving. In this method, a discrete wavelet transform (DWT) is performed on the noisy signal first. Then with a preset threshold, coefficients with a magnitude smaller than the threshold are set to zero while those with a larger magnitude are kept and used to estimate the noiseless coefficients. Finally, an inverse discrete wavelet transform (IDWT) reconstructs the signal from the estimated coefficients. Later, Donoho [7] proposed a sample thresholding rule that sets all the coefficients smaller than the universal threshold to zero and shrinks the rest of the coefficientsby the threshold (soft thresholding) or leaves them with out change (hard thresholding). Donoho and Johnstone [6] also presented a thresholding method using Stein's risk estimator called Sure Shrink. Sendur and Selesnick [8, 9] proposed BiShrink for denoising. The BiShrinkage function indicates that the estimated wavelet coefficients dependon the parent coefficients.
In this paper, a modified wavelet based image denoising thresholding method is proposed. A modified thresholding function considering the inter scale dependency between the parent coefficient and child coefficient and conventional soft thresholding function are adaptively used to estimate coefficients in different scales. Then the peak signal to noise ratio (PSNR) is used as a standard evaluation of the results of denoising the images; experimental results show that our proposed method gives a higher PSNR and with fewer visual artifacts compared with other methods.
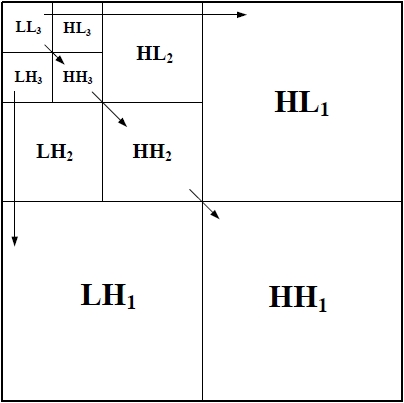
Fig. 1 illustrates the sub-band regions of the two dimensional (2D) critically sampled wavelet transformat level 3, which can be label as HH
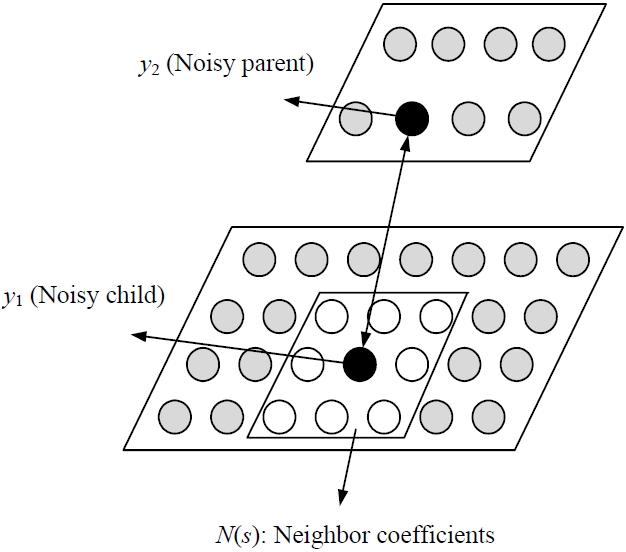
The wavelet coefficients of the
III. TRADITIONAL WAVELET SHRINKAGE
Wavelet thresholding is a simple non-linear technique that operates on one wavelet coefficient at a time. The most popular thresholding methods are soft thresholding and hard thresholding. They are given by (1) and (2), respectively. Soft thresholding is a continuous function while hard thresholding is a discontinuous function which causes some artifacts in a denoised image. Therefore, the soft thresholding method is preferred over hard thresholding [4-7].
Where
VisuShrink is thresholding by applying the universal threshold (
Where
Another well-known method for threshold selection is SureShrink, which is based on the method of Stein’s unbiased risk estimator (SURE) [6]. It is a sub-band adaptive threshold technique. A separate threshold is computed for each sub-band based on Stein’s unbiased risk estimator as follows:
Where #(·) means the number satisfying the condition and “?” means the lesser value of the two parameters.
Then the SureShrink threshold
Where
SureShrink is alocal thresholding method having different thresholds for different levels. SureShrink follows the soft thresholding rule.
In [8] is proposed a Laplace bivariate model for the wavelet coefficients of the useful component of the input image and a bivariate Gaussian model for the wavelet coefficients of the noise. The model captures the inter scale dependence between a wavelet coefficient and its parent. Then Sendur and Selesnick [8, 9] proposed BiShrink for denoising according to this model. BiShrink is a simple non-linear shrinkage function for wavelet denoising, which generalizes the soft thresholding approach of Donoho and Johnstone [5] and it depends on both the coefficient and its parent, yielding improved results for wavelet-based image denoising.
Let
Where
The BiShrink formula is given by
Here σ is the marginal variance for each wavelet coefficient. (
In this paper, an efficient wavelet based image denoising thresholding method is proposed. The proposed method computes the threshold adaptively based on scale level and uses a modified thresholding function which considers the inter scale dependency between parent coefficient and child coefficient and traditional soft thresholding function to estimate the coefficients located in different scales.
For scales
Firstly, proposed method computes the threshold value for this scale using the marginal variance and the neighborhood variance. The marginal variance for the
Our method also tries to estimate the marginal variance σ2 for the
Where
Using (10) and (11), the parent coefficient marginal variance σ
Then, the threshold for scales
Here
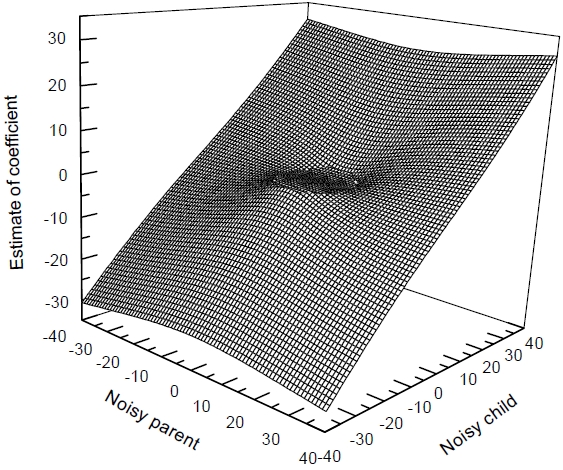
Secondly, a modified thresholding method is proposed to estimate these noisy coefficients. In order to improve the denoising results, our method tries to reduce the fixed-bias, but it cannot be reduced to zero. The expression of the proposed thresholding function is as follows:
Fig. 3 shows the plot of our modified thresholding function. Our results clearly show that the estimated value should depend on the parent value.
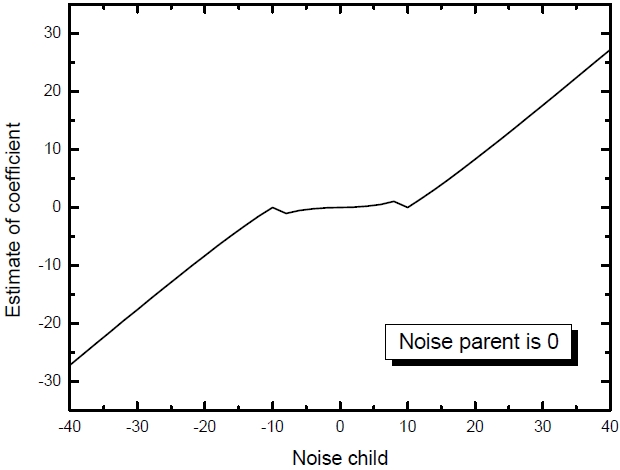
In order to show clearly our proposed thresholding function, the relationship between the noisy child and estimated coefficient by a 2D figure when the noisy parent is 0 is plotted in Fig. 4.
For the coarsest scale
Here, σ
Where
Next, using the soft thresholding function expressed as (1) to estimate the coefficients at scale
Thus, the finally estimated coefficient ? can be summarized as follows:
V. EXPERIMENTAL RESULT ANALYSES
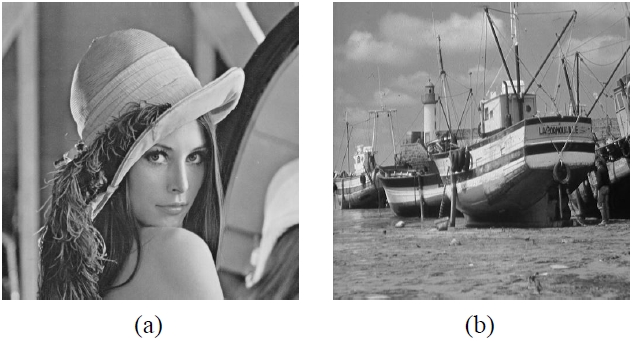
To verify the validity of the proposed method, it is compared with the Mean filter [12], VisuShrink that chooses the universal soft thresholding denoising technique, SureShrink, and BiShrink. The wavelet transform used in all the wavelet domain methods is Db8 in 3-level (
The performance of the estimators is measured by using the classical PSNR.
Where
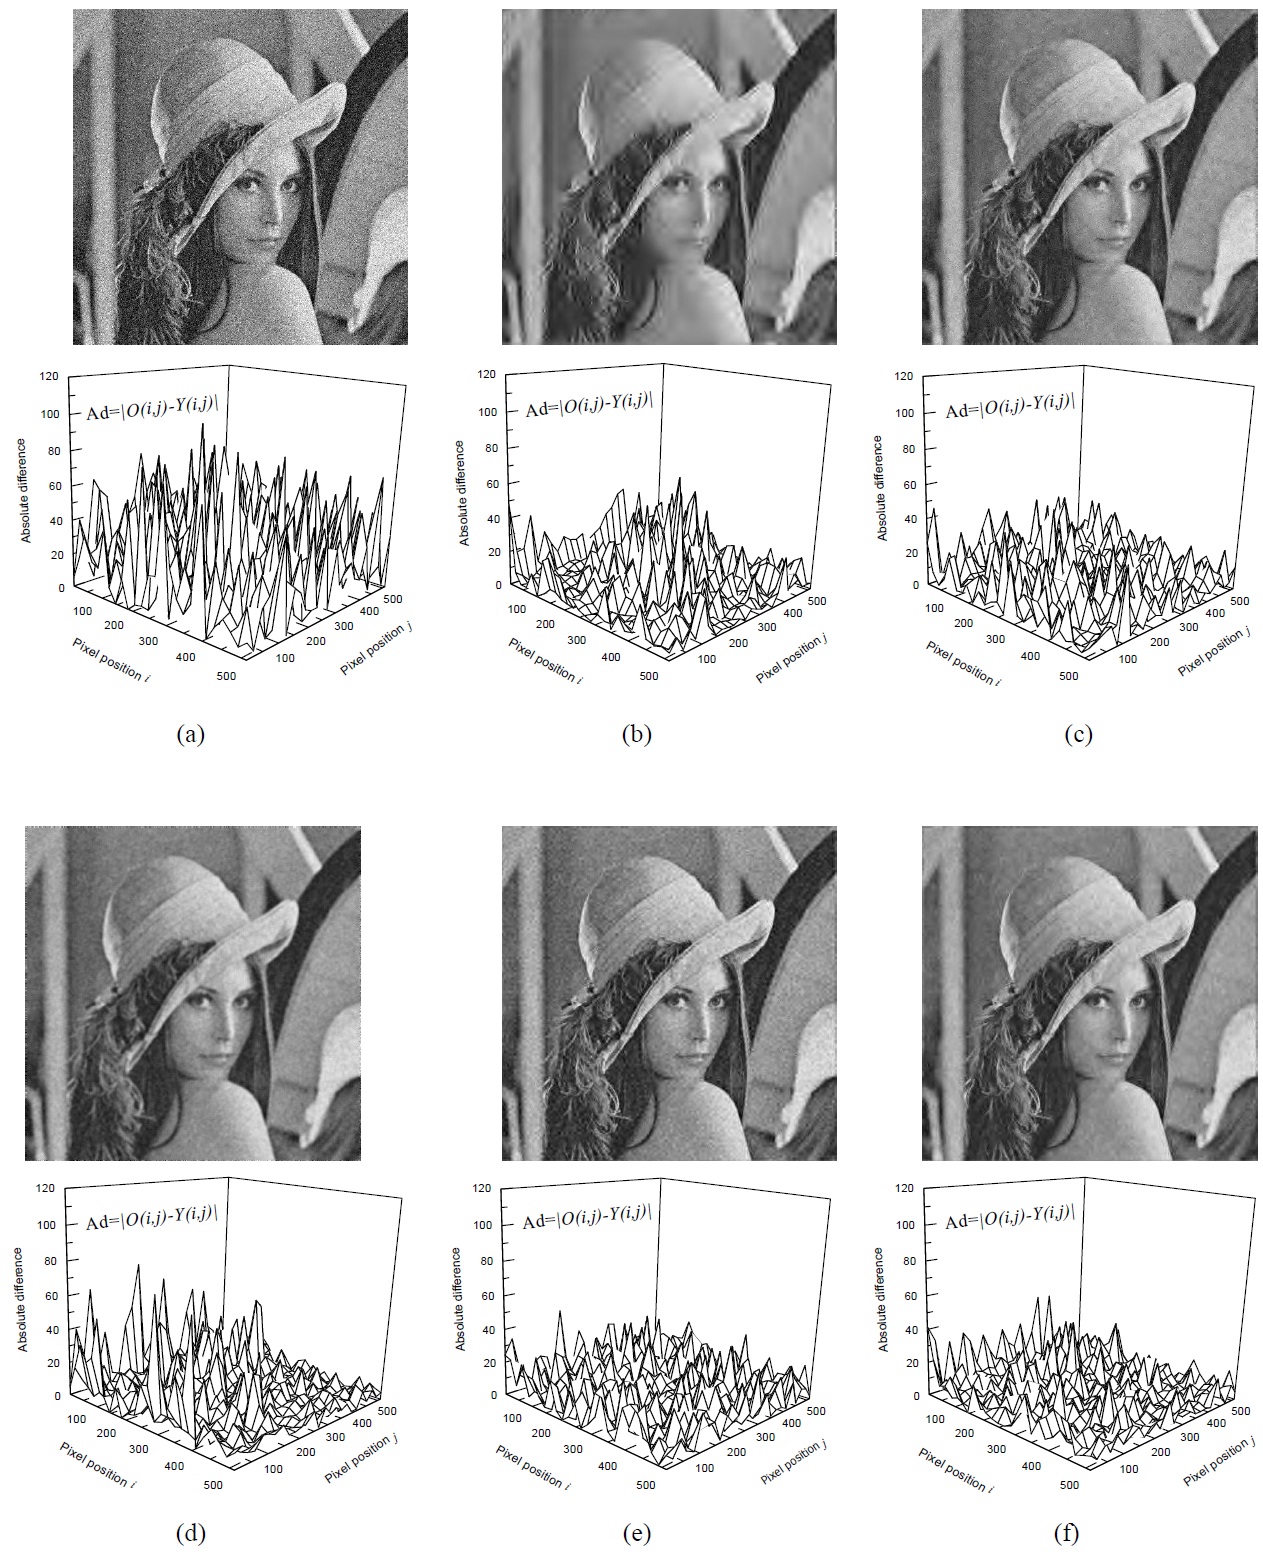
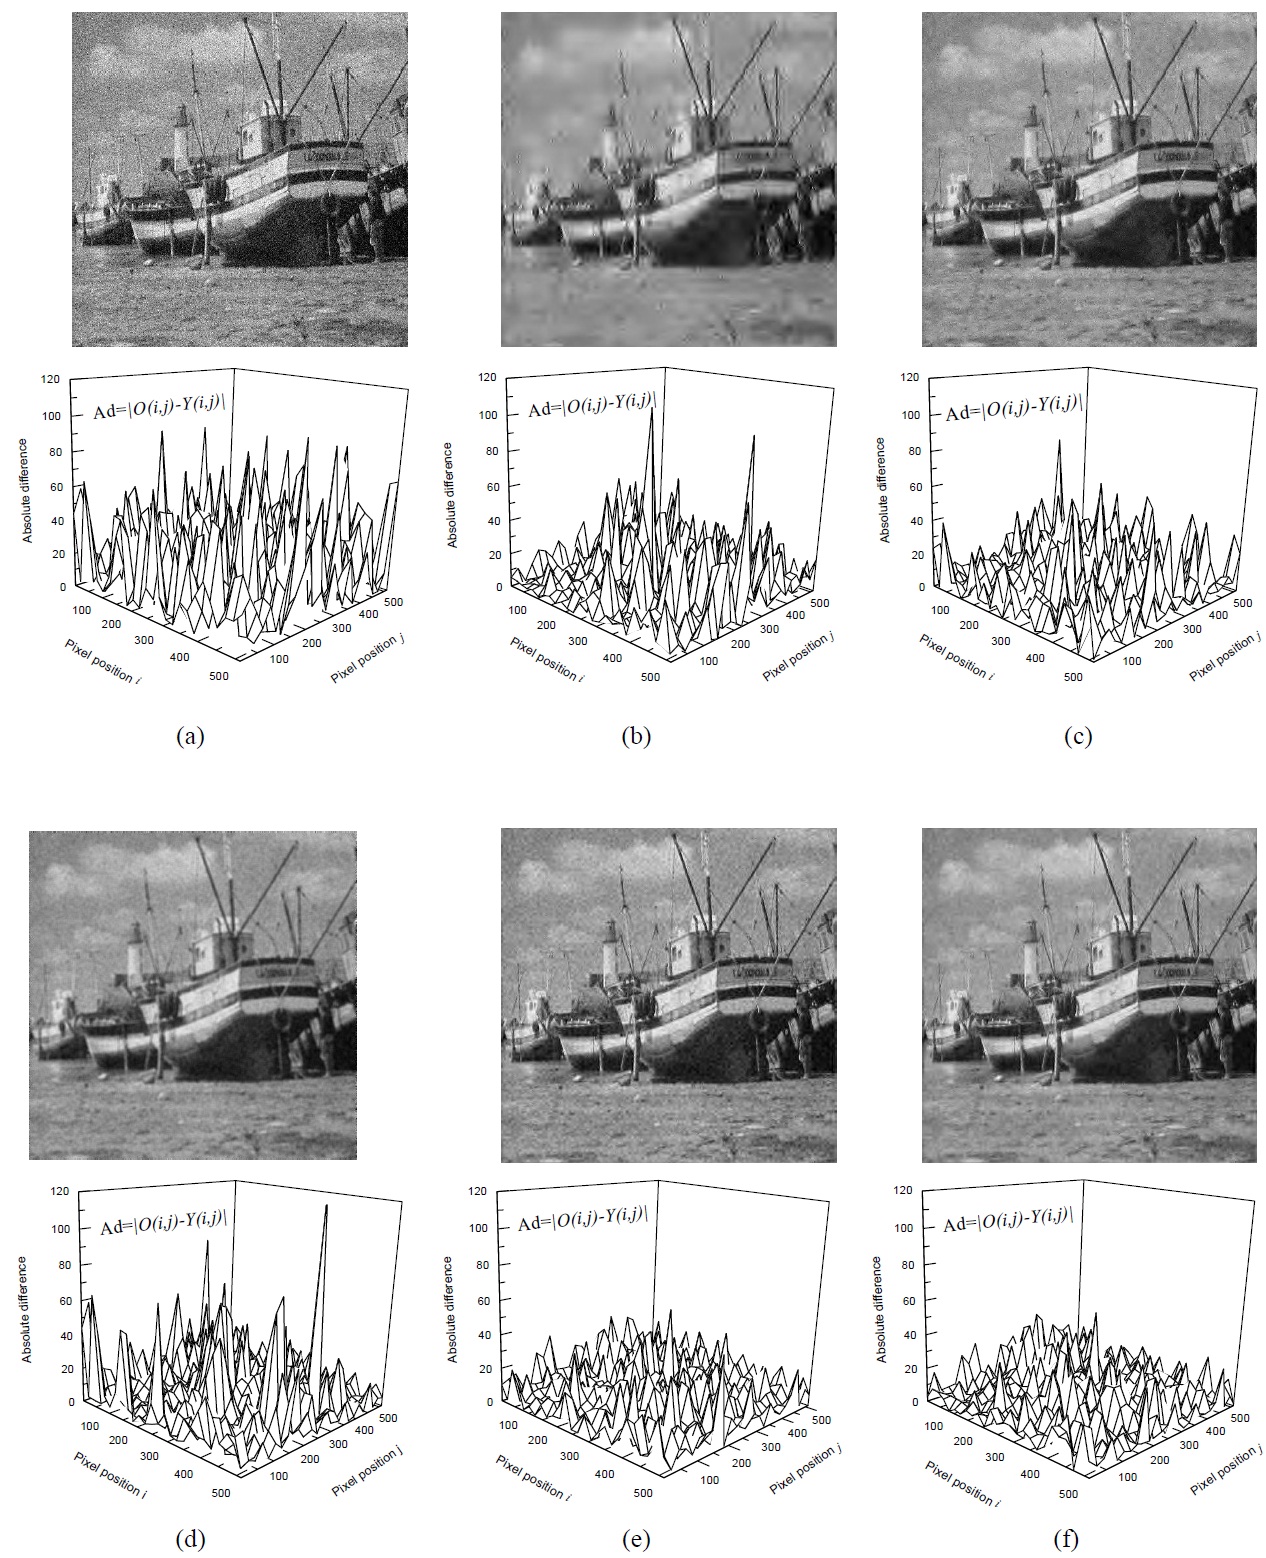
Figs. 6 and 7 show the visual results of the simulation for
[Table 1.] Denoisingresults (PSNRs) of different methods for Lenaand boat.

Denoisingresults (PSNRs) of different methods for Lenaand boat.
subjective visual quality comparison, where the standard deviation of the noise added to the original images is 30. In order to compare the results more clearly, the distribution map of the absolute difference between the original image and the processed image is denoted as
Figs. 6a and 7aare the noisy images that was corrupted by AWGN with σ=30. Figs. 6b-f and 7b-f show the results of the restoration by VisuShrink, SureShrink, Mean filter, BiShrink, and the proposed method, respectively. As shown in Figs. 6 and 7, the distribution map of absolute difference demonstrates the results especially well.
The image that VisuShrink produces is too smooth while the SureShrink and MF methods leave more noise remaining. BiShrink and our method are considerably superior to VisuShrink and SureShrink. However, BiShrink produces more disturbing artifacts than our method. Our method also retains more textural details of the Lena and Boat images.
A performance comparison of the proposed method in terms of PSNR with other reported methods is shown in Table 1. These methods were tested using different noise levels of 15, 20, 25, and 30. It is obvious that the proposed method almost consistently produces the highest PSNRs for the two test images in all noise levels.
For instance, when the test image Lena was corrupted by AWGN with a standard deviation σ=30, the PSNR values after being processed by VisuShrink, SureShrink, Mean filter, and BiShrink were 25.70 dB, 25.49 dB, 27.79 dB, and 27.92 dB, respectively. However, the PSNR value of the proposed method was 28.98 dB.
In this paper, an efficient wavelet based image denoising adaptive thresholding method is proposed. The proposed method selects the threshold adaptively based on scale levels so that it leads to improved results. We also proposed a modified thresholding function that considered the dependency between the parent coefficient and child coefficient.
Performance of the proposed algorithm is measured by applying the PSNR and the proposed method provides high PSNR results. Our method also shows the good quality of restoring images that are compared with the VisuShrink, SureShrink, BiShrink, and Mean filter. Furthermore, our proposed algorithm can retain edges and details, while eliminating most of the noise.
