Graphene is a monolayer of carbon that forms a two-dimensional hexagonal sp2 hybridized structure. Since the discovery of exfoliated free-standing graphene from bulk graphite using the “scotch tape” method, graphene has attracted much attention not only in fundamental research fields but also in various application fields due to its outstanding and unique electronic and mechanical properties [1-4]. In particular, it has the potential to serve as a key component in energy storage devices such as fuel cells and as a substitute for indium tin oxide in transparent conducting electrodes.
Considerable effort has been made thus far to prepare graphene, and various methods have been reported, including mechanical exfoliation of graphite using scotch tape [1], chemically exfoliated graphene oxide and reduced graphene oxide (rGO) [5,6], exfoliation of graphite in organic solvents or acid without any oxidation process [7-10], the growth of a large-area graphene layer on metal using chemical vapor deposition (CVD) [11-13], and epitaxial growth on a SiC substrate [14,15]. While large-area or the scalable production of high-quality graphene has not been realized to date, CVD and chemical exfoliation methods are promising in terms of mass production for real applications [16,17].
The physical properties of graphene oxide, such as the electrical properties, band gap energy, transparency, optical properties, and surface charge, can be determined by the type and quantity of the functional groups on the graphene oxide sheets. Moreover, the size of the graphene oxide sheets is affected by the degree of oxidation of the graphite; functional groups and defect sites, which are increased by a high degree of oxidation, can lead to a breakdown of the graphene oxide sheets during the exfoliation process. Furthermore, functional groups such as epoxy and hydroxyl groups on the basal plane of graphene oxide can act as nucleation sites for the growth of inorganic materials such as TiO2, silica, and nanocrystals of Ni, Co, and Fe, which show different sizes and shapes according to the degree of oxidation of the graphene oxide substrate [18-20]. Therefore, control of graphite oxidation is necessary for various applications of graphene oxide sheets. It was recently reported that graphene oxide sheets with different oxygen content amounts can be prepared simply by changing the starting graphite, oxidation time, and amount of oxidant, providing variation in the size distribution, electrical conductivity, and energy band gap [21-24]. However, no correlation between the properties or size of graphene oxide sheets and the oxidation temperature has been reported thus far.
Herein, we synthesized graphene oxide sheets at different oxidation temperatures using the modified Hummers’ method and investigated their carbon-to-oxygen (C/O) ratios, size distributions, surface charges, and optical properties. The C/O atomic ratio was 1.18 at 35℃, 1.24 at 27℃ and 1.26 at 20℃. This means that more functional groups including oxygen are introduced in the graphene oxide sheet at higher temperatures. After exfoliation, the average lateral size of the graphene oxide sheets was 12.4 μm at 20℃, 10.8 μm at 27℃, and 8.3 μm at 35℃. Furthermore, we show that the surface charge and optical properties of the graphene oxide sheets are related to the degree of oxidation.
Natural graphite having an average particle size of 74 μm was purchased from Bay Carbon (Bay City, MI, USA). Chemical reagents used for the synthesis of graphite oxide (GO), including phosphorus pentoxide (P2O5) and potassium permanganate (KMnO4), were purchased from Sigma-Aldrich. Sulfuric acid (H2SO4) was obtained from Merck Chemicals (Darmstadt, Germany).
GO was prepared from purified natural graphite (SP-1, Bay Carbon) by the modified Hummers’ method [25]. The graphite powder (20 g) was put into an 80℃ solution of concentrated H2SO4 (30 mL), K2S2O8 (10 g) and P2O5 (10 g). The resultant dark blue mixture was thermally isolated and allowed to cool to room temperature over a period of 6 h. The mixture was then carefully diluted with distilled water, filtered, and washed on the filter until the rinse water pH became neutral. The product was dried in air at ambient temperatures overnight. This pre-oxidized graphite was then subjected to oxidation by the Hummers’ method. The pre-oxidized graphite powder (20 g) was put into cold concentrated H2SO4 (460 mL). KMnO4 (60 g) was added gradually while stirring and cooling the mixture, during which the temperature of the mixture was not allowed to reach 20℃. The mixture was then stirred at 35℃ for 2 h, and distilled water (920 mL) was added. The oxidation temperature was changed to 20℃ and 27℃ for the other samples. After 15 min, the reaction was terminated by the addition of a large amount of distilled water (2.8 L) and a 30% H2O2 solution (50 mL), after which the color of the mixture changed to bright yellow. The mixture was filtered and washed with a 1:10 HCl solution (5 L) in order to remove metal ions. The GO product was suspended in distilled water to give a viscous, brown dispersion, which was subjected to dialysis to remove metal ions and acids completely. All GO suspensions, obtained under different oxidation temperatures, were very stable in water. Exfoliation of the above GO to graphene oxide was carried out by dilution of the GO dispersion (3.5 mL) with deionized water (35 mL) followed by vigorous stirring at 15 000 rpm with a homogenizer for 15 min. The resulting homogeneous yellow-brown sol, of which the concentration was 0.3 mg/mL, was stable for at least a few months.
2.3. Measurements and characterization
The average size and morphology of the graphene oxide sheets were measured by scanning electron microscopy (SEM; FEI, USA) and atomic force microscopy (AFM; Veeco, USA). To measure the degree of oxidation of the GO, the element contents were calculated for carbon, hydrogen, oxygen, nitrogen and sulphur by an element analyzer, a Flash 2000 device (Thermo Scientific, The Netherlands). UV/Vis absorption spectra of the graphene oxide solution samples were measured by a Cary 5000 (Varian, USA) in a range of 200-800 nm, and the surface charges (zeta potential) of the samples were measured by the Nano ZS system (Malvern, UK) in a range of pH 2.5-10.
3.1. Degree of oxidation of graphite
The degree of oxidation of graphite at different temperatures was estimated by an elemental analysis of the final GO samples. The contents of each element and the C/O atomic ratio for the GO samples are summarized in Table 1. The oxygen contents of GO were 44.55 wt% at 20℃, 47.16 wt% at 27℃ , and 49.92 wt% at 35℃, indicating that more functional groups including oxygen were generated on the graphene oxide sheets at high temperatures. The degree of oxidation is directly related to the C/O atomic ratio based on the carbon and oxygen contents. The C/O ratio of GO was calculated to be 1.18 at 35℃ , which is the oxidation temperature used during the normal modified Hummers’ method. However, the C/O ratio of the other GO samples was 1.24 at 27℃ and 1.26 at 20℃. As the oxidation temperature was increased, the C/O atomic ratio decreased. This result is due to the formation of more functional groups during the oxidation process at higher temperatures.
[Table 1.] Element analysis of GO samples obtained at different oxidation temperatures
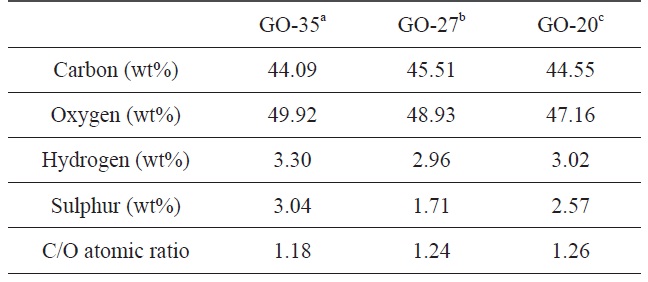
Element analysis of GO samples obtained at different oxidation temperatures
3.2. Size distribution of graphene oxide sheets
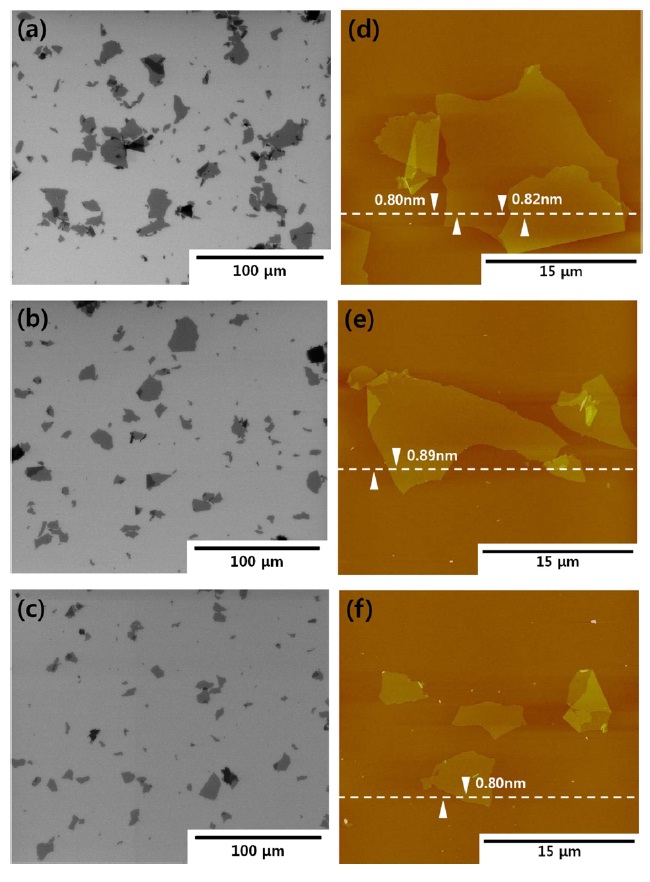
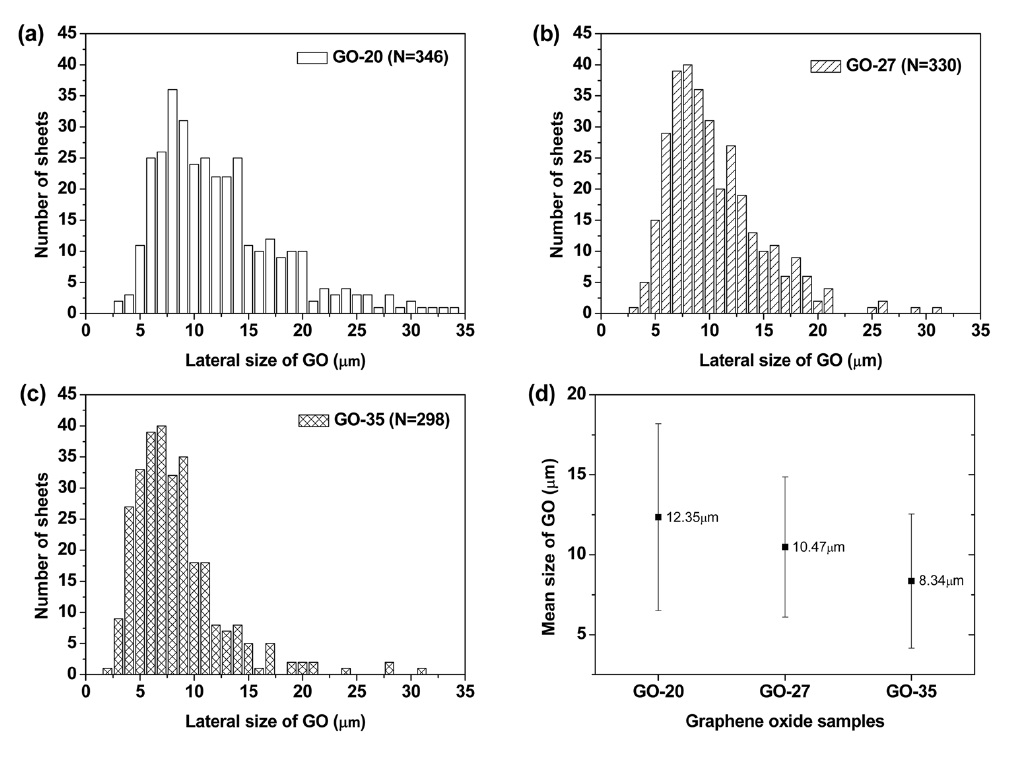
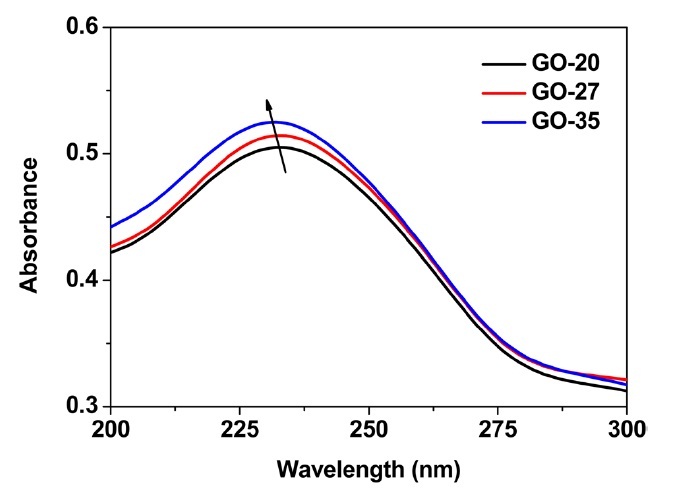
Figs. 1a-f exhibit SEM and AFM images of graphene oxide sheets obtained at different oxidation temperatures. The AFM height profiles in Figs. 1d-f show that the exfoliated graphene oxide sheets are single layers with a thickness of 0.8-0.9 nm. The size distribution of the graphene oxide sheets, with more than 300 sheets for each sample, is shown in Figs. 2a-c. It was obtained by measuring the size of the graphene oxide sheets in the SEM images. The average size of the graphene oxide sheets was calculated to be 12.4 μm at 20℃, 10.8 μm at 27℃ , and 8.3 μm at 35℃, as shown in Fig. 2d. The smaller size of the graphene oxide sheets at a higher temperature is attributed to the generation of more functional groups and defect sites during the oxidation process. Additionally, π-conjugation may be reduced due to the decrease in the sheet size by the functional groups and defect sites. The change of the π-conjugation was investigated by UV/Vis absorption spectroscopy. According to the results, the band at 233 nm in the case of graphene oxide at 20℃ (mild oxidation) shifts slightly to a shorter wavelength in the case of graphene oxide at 35℃ (Fig. 3). The blue shift for highly oxidized graphene oxide is due to the reduced π-π conjugated domain size as a result of the increased functional groups and defect sites within the graphene oxide sheets [23,24].
3.3. Comparison of the surface charge via zetapotential measurement
The reactivity of nano-sized materials is closely related to their size, shape, and surface properties. In the case of gra-
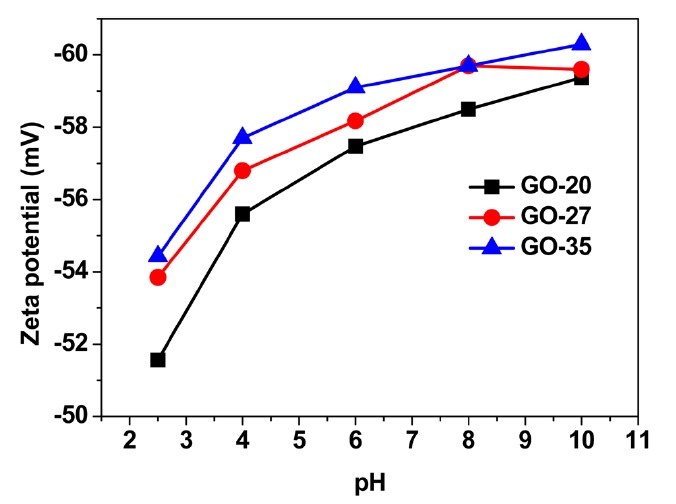
phene oxide, surface properties such as the surface charge may depend upon the quantity and type of functional groups on the graphene oxide surface. During the oxidation process, functional groups (mainly the epoxy group on the basal plane and hydroxyl and carboxylic groups at the edge side) are introduced to the graphene oxide sheets. The functional groups at the edges of the graphene oxide sheets can weakly develop negative charges in the solution due to deprotonation, yielding a hydrophilic nature. Negatively charged graphene oxide sheets were investigated by zeta potential measurements. Fig. 4 shows that the zeta potential values of the graphene oxide sheets increase with the oxidation temperature in a wide range of pH values, from 2.5-10 in this case. The graphene oxide suspension sample obtained at 35℃ showed the highest negative value at all pH levels. Given these results, it is considered that the graphene oxide sheets obtained at 35℃ possess more functional groups with negative charges. This result is consistent with the results gained with the average size and C/O ratio of the present GO samples.
We successfully controlled the size and physical properties, specifically the optical properties and surface charge, of graphene oxide sheets by changing the oxidation temperature by means of the modified Hummers’ method. From SEM images of graphene oxide sheets prepared under different oxidation temperatures, the average size was 12.4 μm at 20℃, 10.5 μm at 27℃, and 8.3 μm at 35℃. As the oxidation temperature was increased, the oxygen content increased. Thus, the C/O atomic ratio decreased due to the creation of more functional groups and additional defect sites at high oxidation temperatures. Furthermore, the band at 233 nm in the UV-Vis absorption spectra was slightly blue-shifted, indicating a reduced π-conjugated domain size. According to zeta potential measurements, a highly oxidized graphene oxide suspension at 35℃ revealed the highest negative values. These results indicate that the size and physicochemical characteristics of graphene oxide sheets can be tuned by the degree of oxidation. Therefore, this study demonstrates the tunability of the properties of graphene oxide and rGO, a feature that is necessary for actual applications.