Activated carbons (ACs) are well known for their expanded surface areas and large total pore volumes [1]. This is why they show large adsorption capacities from both gaseous and liquid phases [2]. ACs are widely used in decolorization, deodorization, filtration and purification [3,4]. ACs have also been used as catalyst support and battery capacitors [5]. Recently, ACs have been used in gas storage for natural gas vehicles [6] and more recently in hydrogen storage [7]. The conventional methods for synthesis of ACs are physical and chemical activation of carbon rich precursors. By physical activation with CO2, steam, or air, it is possible to obtain ACs with surface area SBET values up to about 1800 m2g-1 and pore volumes up to 1.3 mL g-1 [8]. Chemical activation with ZnCl2, H3PO4, and NaOH/KOH yields ACs with SBET values approaching 3000 m2g-1 and with total pore volumes higher than 2.5 mL g-1 [9].
Agricultural byproducts are used as precursors for the preparation of ACs in order to reduce the expenses of their production. Rice husk (RH) is a large scale agricultural waste that has practically no commercial application.
Dyes are extensively used, especially in several industries. The discharge of effluents from these industries is a major source of color in water resources [10]. Dyes are generally undegradable and are harmful to flora and fauna; some of these dyes have been reported to be carcinogenic and mutagenic [11]. Colored water inhibits solar radiation into the water surface, leading to a significant reduction in photosynthesis. Treatments of colored water discharged from dyeing processes, including flocculation, precipitation, photochemical oxidation, ozonation, and adsorption have been investigated [12-15]. Because of the significant amount of organics in dye molecules, most of the conventional treatment methods fail to recover the dyes from the effluents [16]. However, adsorption has been recognized as one of the best methods for the removal of dyes from water and wastewater [17,18]. Among many adsorbents, AC is a prominent adsorbent for the removal of dyes from colored effluents [19].
This article reports the preparation of low-cost ACs from RH using phosphoric acid, sodium

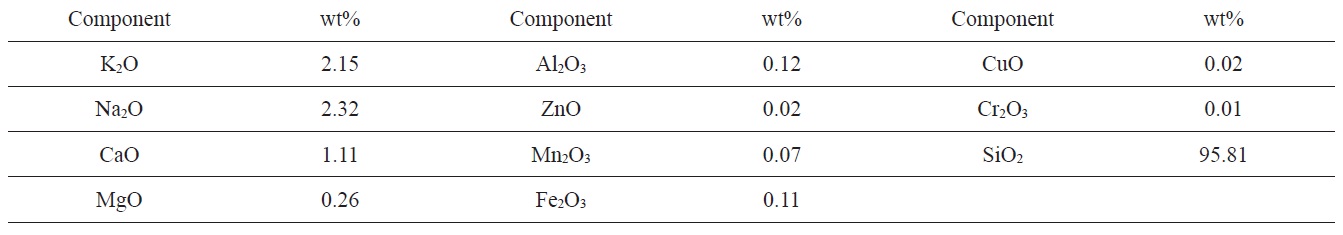
Elemental composition of ash component of RH by inductively coupled plasma atomic emission spectroscopy (ICP-OES)
hydroxide, and steam activation. This paper is occupied with the determination of textural properties and the chemistry of the surface of the carbons and their roles in the removal of cationic dye (methylene blue, MB) and anionic dye (acid green 25, AG). The kinetics and equilibrium adsorption of these hazardous materials from their aqueous solution is the main object of the present work.
RH from the rice mill of El-Mansoura City (Egypt) was used as raw material. RH was first washed with distilled water to remove dust and other adhering impurities, and then dried at 383 K for 48 h. Finally, the dried product was ground and sieved to different particle sizes. This study focused on the size fraction 0.3-0.5 mm. The RH used contained about 22 wt% lignin, 42 wt% cellulose and 20 wt% of hemicelluloses. The moisture content of as received RH was about 5.2%. Ash content was 18.6 wt%. The elemental composition of the ash was previously determined in our laboratory as shown in Table 1.
Two carbonization products C and LC were prepared; the former was obtained by the carbonization of dried RH, whereas the latter was obtained by carbonization of dried RH pre-leached with hydrofluoric acid, HF. Leaching was done at room temperature using 25% analytical grade HF. The acid solution volume to mass ratio was 2.5:1. The slurry was stirred for 30 min, and then the solid was separated and washed with distilled water until neutralization and then oven dried at 383 K for 24 h. Dried RH and dried HFleached RH were calcined separately in absence of air in batch process using a stainless steel reactor at a rate of 10 Kmin-1 from room temperature up to 773 K, followed by soaking at this final temperature for 3 h. An A-K-type thermocouple and a digital temperature controller were used to set and control the sample temperature.
Steam AC (SLC) was obtained by gasifying a portion of LC carbon with a mixture of nitrogen and steam at 1173 K to burn off = 29 wt%. After this, sample LC pre-carbonized at 773 K was contained in a stainless steel tube (40 cm length and 4 cm internal diameter) positioned vertically in a tubular muffle furnace. The entering gas mixture was passed through the “LC” bed, which was supported on a fine chromel screen. The flow rate was sufficient to keep the sample “Jiggling.” Details on steam activation have been reported elsewhere [20].
An activated sample (PLC) was prepared by soaking LC in 50 wt% analytical grade phosphoric acid at room temperature for 3 days. The acid solution volume to the solid mass was 3:1. The slurry was occasionally stirred; the solid was then separated and heated gradually in absence of air in a stainless steel reactor at a rate of heating = 10 Kmin-1 up to 773 K; it was then maintained at this temperature for 3 h. After cooling, the carbonized mass was washed thoroughly with distilled water until the washing attained a PH value of 6.0, at which point the washed material was dried. Details of the method are reported elsewhere [21].
Two additional ACs, NC and NLC, were prepared by soaking the carbonization products C and LC, respectively, in the presence of substantial weight of analytical rade NaOH, dissolved in the least amount of water for 48 h (carbon: solid NaOH = 1:3 w\w). The paste was then dried. Thereafter, the dried product was calcined at 1123 K at a rate of 10 Kmin-1, and by maintaining the maximum temperature for 2 h. After cooling to room
temperature, the activated product was ground and sieved, and the fraction of size 0.3-0.5 mm was washed with doubly distilled water and dried at 383 K for use in adsorption and analytical investigations. Details of the apparatus and the experimental methods are reported elsewhere [22].
2.2.1. Low temperature adsorption of nitrogen
The textural properties (surface area and porosity) of the ACs were investigated using a volumetric apparatus of conventional type. The adsorbent was degassed at 473 K under reduced pressure of 10-5 torr for 8 h prior to adsorption measurements. The adsorption of N2 at 77 K was followed until near saturation, i.e., until a relative pressure = P/P0 > 0.95 < 1.
2.2.2. Scanning electron microscopy
Scanning electron microscopy (SEM): micrographs of SLC, PLC, and NLC were obtained using a SEM (JEOL, model 6400). Prior to the analysis, the samples were dried at 110℃ for 4 h. A thin layer of gold was coated on the samples for charge dissipation.
2.2.3. Surface functional group determination
Fourier transform infrared (FTIR) spectroscopy: FTIR spectra were recorded between 4000 and 400 cm-1 using a Mattson 5000 FTIR spectrometer. Discs were prepared by first mixing 1 mg dried carbon sample with 500 mg of KBr (Merck for spectroscopy) in an agate mortar and then pressing the resulting mixture at 5 tonne/cm2 for 5 min and 10 tonne/cm2 for 5 min under vacuum.
2.2.4. Determination of pH of the slurry
Zero point five gram of carbon sample was shaken with 25 mL (CO2 free distilled water); then, the pH of the filtrate was measured.
2.2.5. Determination of PHPZC
Initially, 50 mL of NaCl was placed in several closed Erlenmeyer flasks. The PH within each flask was adjusted to a value between 2-12 by adding either HCl (0.1 M) or NaOH (0.1 M). Then, 0.15 g was added to each flask, the flasks were agitated for 48 h, and the final PH was then measured. The PHPZC is defined as the point where the curve PHfinal vs. PHinitial crosses the line pHfinal = pHinitial [23].
2.2.6. Selective neutralization analysis
Acid and basic functional groups on the AC surface were determined by the method proposed by Boehm [24]. Solutions of NaHCO3 (0.05 N), Na2CO3 (0.05 N), NaOH (0.05 N and 0.15 N) and HCl (0.05 N) were prepared using CO2-free distilled water. A 25 mL volume of these solutions was added to vials containing 0.25 g of AC. These samples were shaken until equilibrium. When equilibrium was reached the carbon was separated from the solution by filtration. The excess of base or acid was determined by back titration using (HCl 0.05 and 0.15 N) and NaOH (0.05 N) solutions [25].
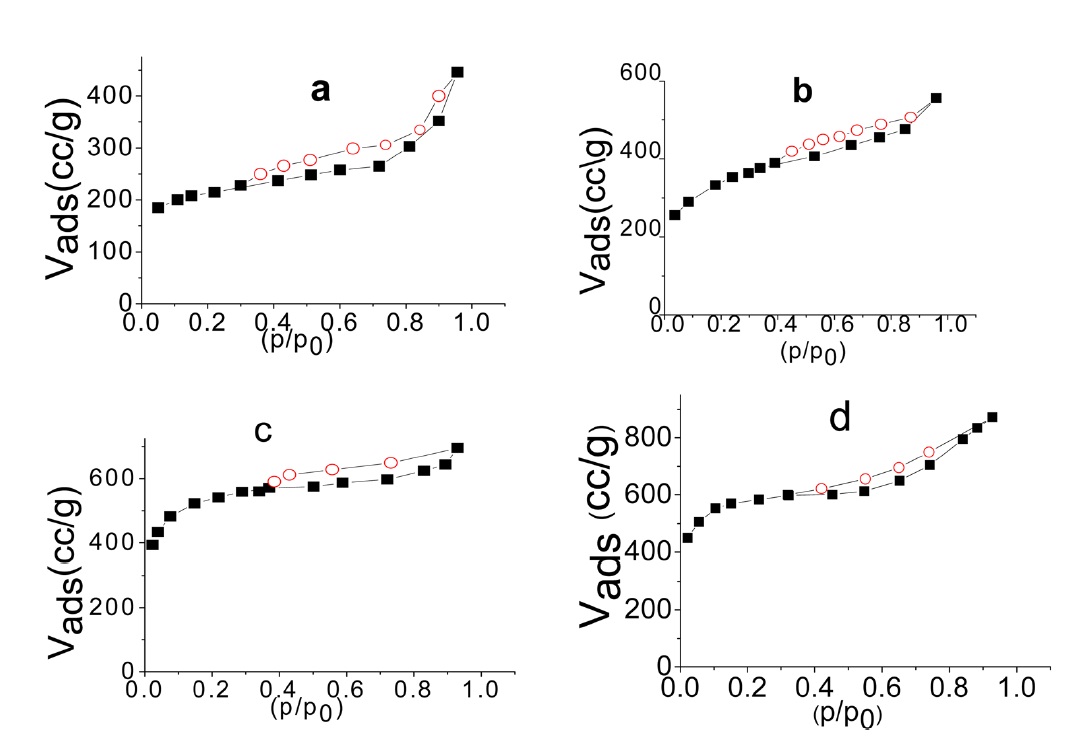
The nitrogen adsorption-desorption isotherms at 77 K of SLC, PLC, NC, and NLC are shown in Fig. 1. The isotherms show the characteristics of type I and type II of the Brunauer, Deming, Deming and Teller (BDDT) classification [26]. The isotherms exhibit a steep initial part and a well developed knee bend at P/P0 = 0.1-0.2. The narrow closed hysteresis loop exhibited by the investigated sorbent may be taken as evidence of capillary condensation in the micropores [27]. The conventional
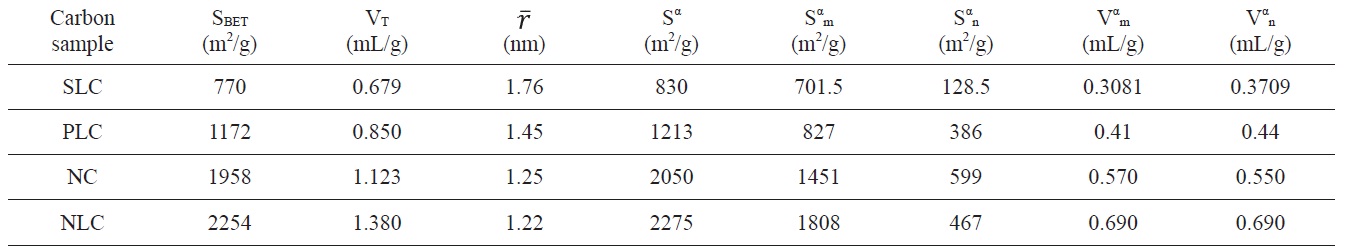
Textural properties of the investigated carbons as determined from nitrogen adsorption at 77 K
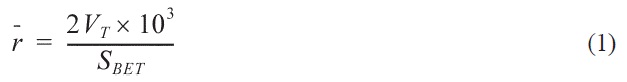
Brunauer-Emmett-Teller (BET) equation [28] was applied to determine the BET surface area SBET (m2/g) of each carbon. The total pore volume VT (mL/g) of each carbon was also calculated from the volume of nitrogen adsorbed near saturation, i.e. at P/ P0 = 0.95. Another textural parameter, i.e., the mean pore radius

(nm), was calculated from the relationship:
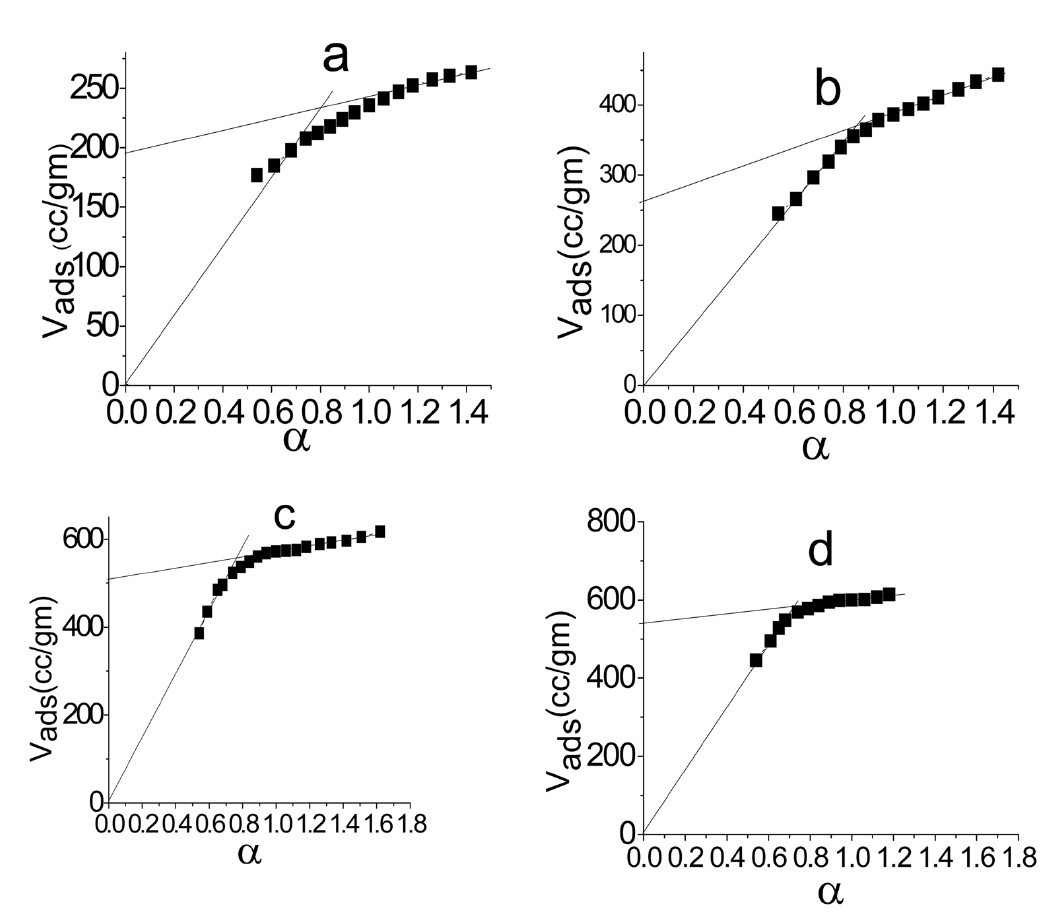
The α method of using [29] was also used to determine the total surface area Sα (m2/g) of each carbon, taking the standard data for the adsorption of N2 at 77 K on non-porous carbon as a reference [30]. The α method allows the determination of the volumes of micropores and of non micropores, Vαm and Vn α, respectively, and also the surface located in these types of pores, i.e. Sαm and Sn α.
Fig. 2 shows the α plot of nitrogen adsorbed at 77 K.
Inspection of Table 2 reveals that (i) The SBET values are comparable to their corresponding values determined from the α-method with a difference not exceeding 7.7% . (ii) The mean pore radius of the sorbents investigated is less than 1.8 nm. Thus suggests the existence of both micro and non micropores. Evidently, the values of Vmα and Vn α are comparable, particularly for chemically ACs. The SLC showed the lowest surface area, but showed the
largest mean pore radius. This might be ascribed to the slight pore widening brought about by the erosion of the pore walls during gasification with steam to a burn off = 29%. More pronounced effects on the porosity are perhaps expected upon gasification with oxidizing gases to higher burn off. (iii) The surface located in the micropores was higher than that located in non micropores; this was found to be true for all the carbons investigated.
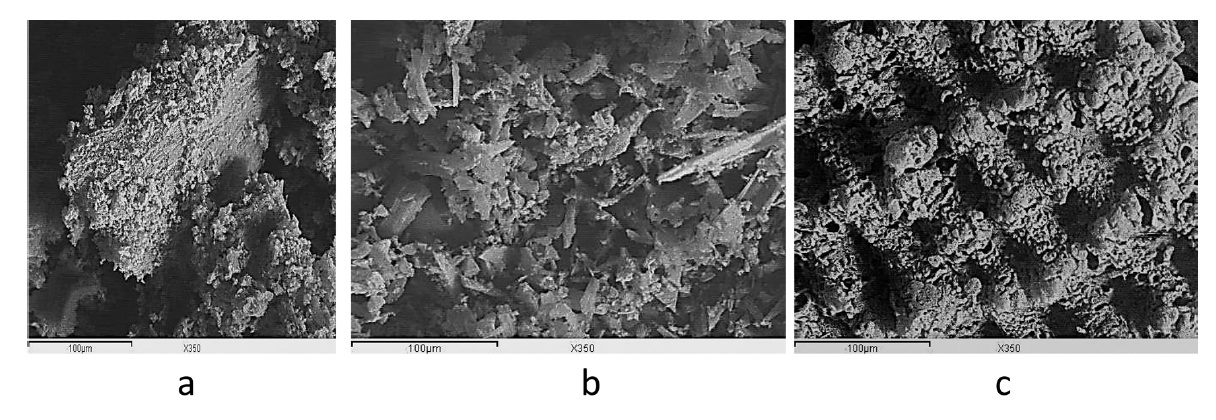
SEM: the SEM images in Fig. 3 show that ACs have an irregular shape and size with no definite morphology; this situation may be ascribed to the preliminary treatments, which include crushing, impregnation, carbonization, and activation at different temperatures. The SEM micrographs obtained at a magnification of 350x clearly indicate the porous structure of the ACs.
3.2. Chemistry of the carbon surfaces
The chemistry of the carbon surface is attributed to the ex-
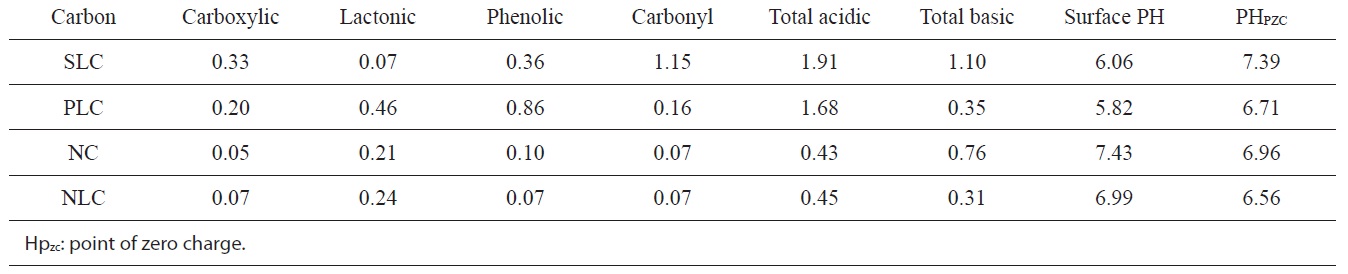
[Table 3.] Functional groups (meq/g), surface pH, and PHPZC of the investigated carbons

Functional groups (meq/g), surface pH, and PHPZC of the investigated carbons
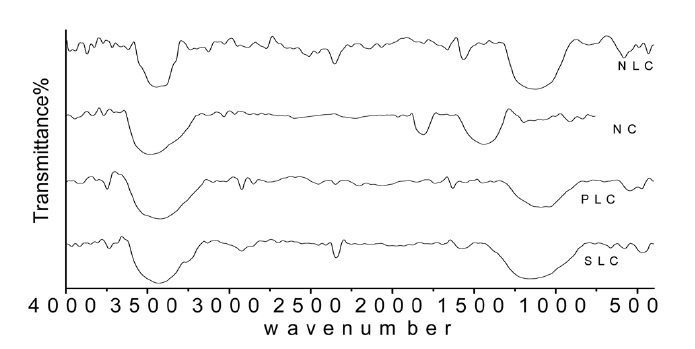
istence of carbon-oxygen groups of acidic or basic character depending on the carbonization temperature, the condition and methods of carbonization, and the activation. The infrared spectra in Fig. 4 give information on the chemical structure of the ACs. All the carbon samples show a wide band at about 3250- 3425 cm-1 due to the O-H stretching mode of the hexagonal group and adsorbed water. The sample shows absorption bands due to aliphatic C-H near 2800-2950 cm-1 [31]. Bands around 2322-2390 cm-1 may be assigned to C=O stretching in the ketone group [32]. The very small peak near 1700 cm-1 is assigned to C= O stretching vibrations of ketones, aldehydes, lactones, or carboxyl groups. The weak intensity of this peak indicates that the prepared ACs contain small amounts of carboxyl group. The bands near 1600 are due to C= C stretching vibration in the aromatic ring [33]. A broad band between 1250 and 1100 cm-1 is observed; this band may be assigned to C-O stretching in acids, alcohols, phenols, and esters. The appearance of bands at 900- 1300 cm-1 could be also due to phosphorous species resulting from phosphoric acid activation [34].
Although this analysis can’t be considered as quantitative, it can give information on the carbon-oxygen groups on the surface of AC prepared in the present work.
The pH of the aqueous slurry of the carbon material provides convenient indicators of the surface groups on the carbons. The PH values of the slurries of SLC, PLC, NC, and NLC were found to be 6.06, 5.82, 7.43, and 6.99 respectively. This may be taken as evidence that acid functional groups slightly predominate on the surface of SLC and PLC, whereas the base functional groups very slightly predominate on the surface of NC. On the other hand, the level of acid functional groups is equivalent to that of the basic functional groups on the surface of NLC. The
chemistry of the surface of the ACs is better determined from their base neutralization capacities (meq/g). NaHCO3 neutralizes carboxylic groups, whereas those groups that are neutralized by Na2CO3 but not by NaHCO3 were believed to be lactones. The weakly acidic groups neutralized by NaOH but not by Na2CO3 were postulated to be phenols. Neutralization with 0.15 N NaOH was assumed to determine all the acidic functional groups on the surface, including carbonyl groups.
The functional groups on the surfaces of the ACs are listed in Table 3, expressed as (meq/g).
3.3. Adsorption of MB and AG25 dyes from their aqueous solutions
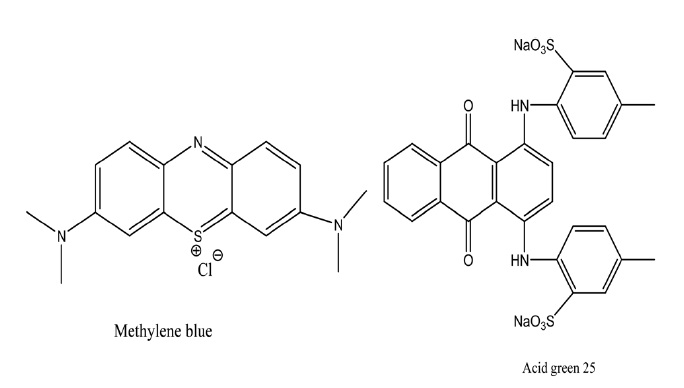
Fig. 5 shows the chemical structure of MB (C16H18ClN3S.2H2O) and of AG (C28H2ON2Na2O8S2). MB and AG were obtained from Sigma-Aldrich. The molecular wt of MB is 319.9 an its λmax is 663 nm; the molecular wt of AG is 622.59 and its λ max is 642 nm.
3.3.1. Effect of dye solution pH
Adsorption from solution depends on both the pH, particularly when the solute is charged, and also on the contact time between the solid adsorbent and the adsorption solution. Preliminary experiments have been carried out to determine the effect of pH on the amount of dye adsorbed at 298 K when a contact time of 48 h is allowed in order to ensure the attainment of equilibrium conditions.
A series of five 250 mL conical flasks filled with 200 mL of the
dye solution of initial concentration 400 mg/L were used. The initial pH values of the adsorption solution were adjusted at 2, 4, 6, 8, and 10 using HCl, and NaOH. Then, 0.2 g of the carbon sample was added to each flask. The mixtures were agitated at a speed of 100 rpm using a themostatted water bath shaker (Kottermann Labortechnik). The procedure was repeated for the other carbons. After equilibrium the flasks were removed from the shaker and the equilibrium concentrations were determined using the equation:
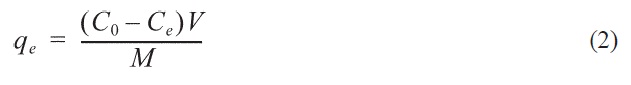
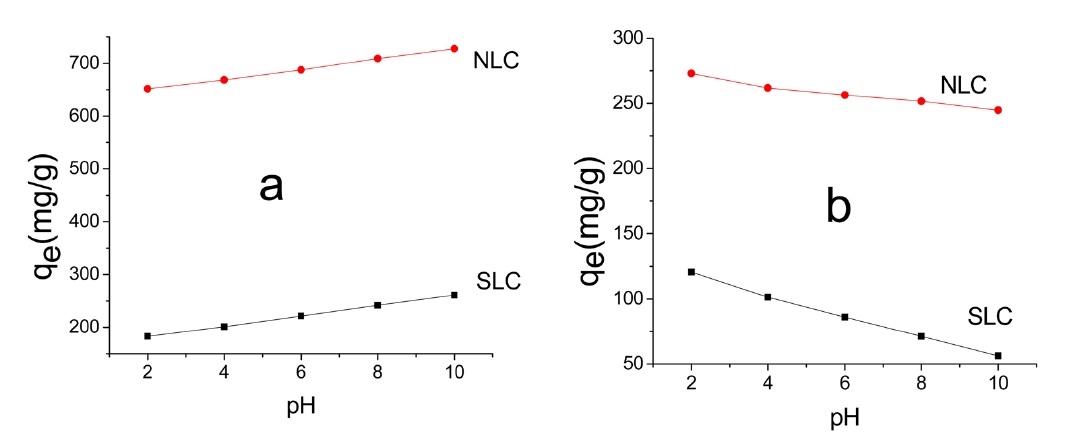
where C0 and Ce are the initial and equilibrium concentrations (mg/L), respectively, V is the volume of adsorption solution (L), and M is the mass of carbon (g). Fig. 6 depicts the change of qe (MB) and (AG) with the initial pH of the solution.
Fig. 6 shows that qe is pH dependant. However, the trend is not the same for the two dyes. Thus in the case of MB adsorption, qe increased with the increase of initial pH, whereas for AG qe decreased with the increase of initial pH. AC may be regarded as being composed of amphoteric solids because of the existence of both negatively and positively charged sites on the surface when it is placed in aqueous solution; which type of site dominates depends on the solution pH. When the surface of the carbon is negatively charged (pH > pHpzc), it can attract cationic dye molecules such as MB from solution. This explains the increase of qe of MB with the increase of dye solution pH from 2 to 10. The decrease of qe of AG25 with the increase of solution pH from 2 to 10 may be ascribed to the high concentration of negatively charged-OH ions and the repulsion between the negatively charged adsorbent and the anionic dye molecules. Also, at high pH values no more exchangeable anions exist on the surface of the adsorbent [35,36], considering the value of qe at some intermediate initial pH values, i.e., at an initial dye solution of pH 6-7. Evidently, qe values are between 70 and 80% of the maximum qe. However, it is still preferable to remove dyes from their aqueous solution by their adsorption at neutral pH, using ACs. This is simple, convenient, and cost-saving.
3.3.2. Batch equilibrium and kinetic studies
Adsorption experiments were carried out by adding a fixed amount of adsorbent (0.25 g) to a series of 250 mL conical flasks filled with 200 mL diluted solutions of 50-500 mg/L. The flasks
were then sealed and placed in water bath shaker and were shaken at 100 rpm for the required adsorption time at 298, 308, and 318 K and neutral pH. The flasks were then removed from the shaker and the equilibrium concentrations were measured. The amount of dye adsorbed at equilibrium qe (mg/g) by the carbon sample was calculated from Eq. (2).
The procedure of kinetic measurements at 298 K was identical to the equilibrium procedures, except for the contact time. Samples from the adsorption solution were taken at different time intervals and the concentrations of the dye in the sample were similarly measured.
All the absorption measurements were carried out using a Unicam 5625 Uv/Vis spectrophotometer.
The amount of dye adsorbed at time t, qt (mg/g) was calculated using:
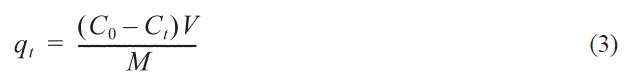
where C0 and Ct (mg/L) are the initial concentration and the concentration of the dye adsorption solution at time t; V and M have been previously defined.
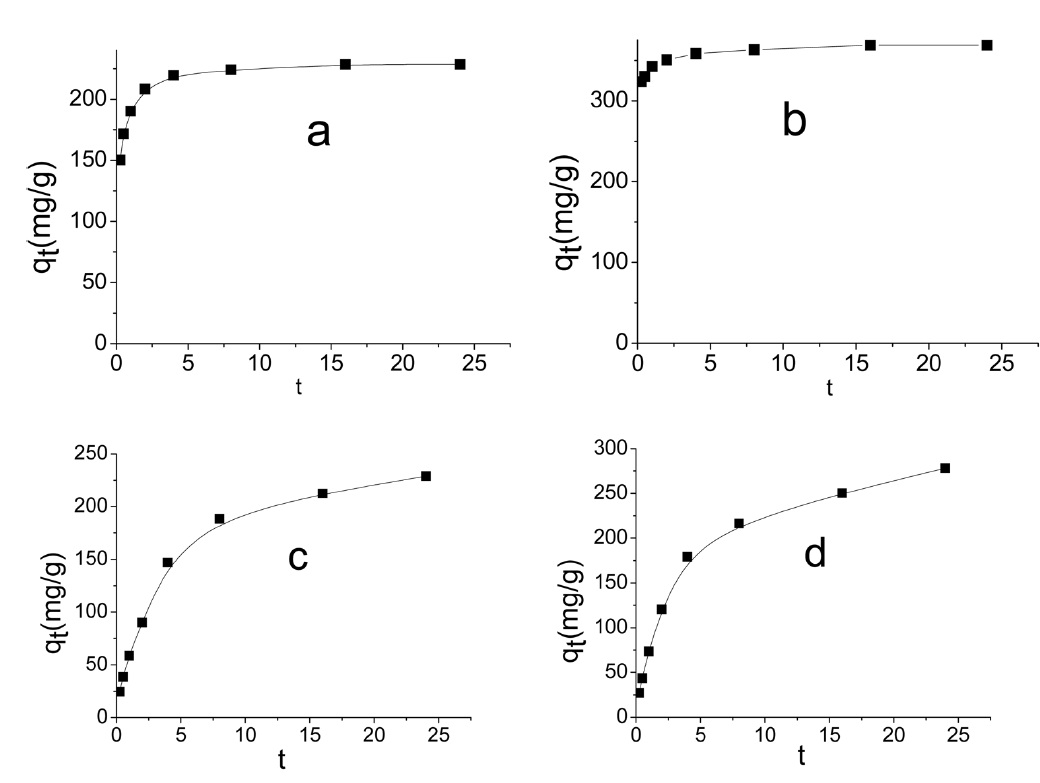
Representative adsorption curves of MB and AG are shown in Fig. 7.
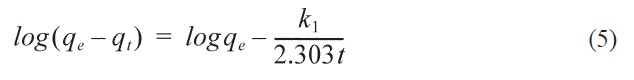
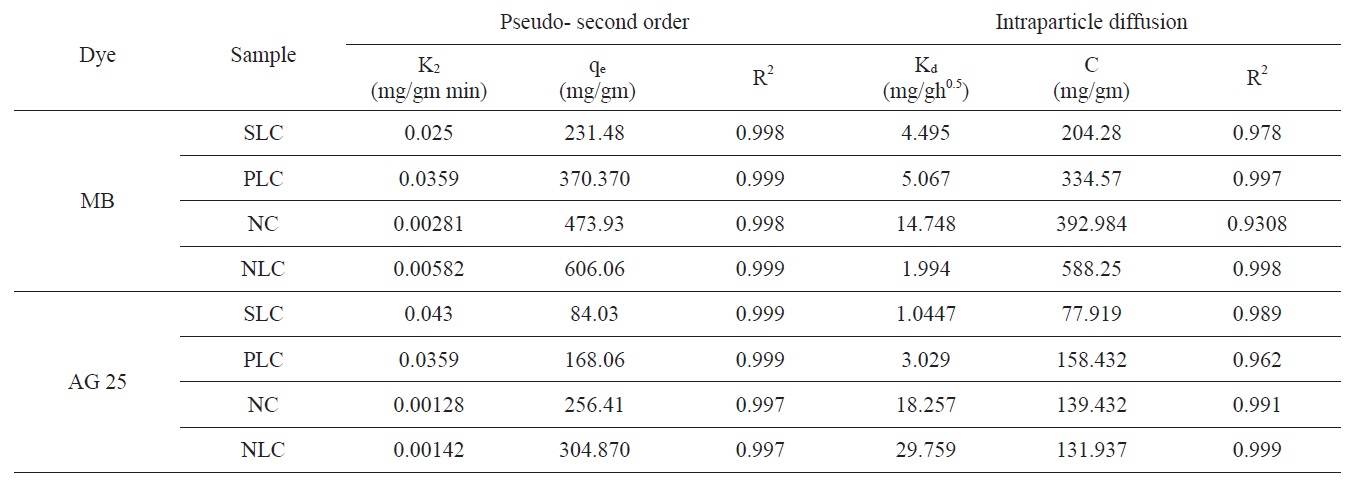
The kinetic models, used in order to investigate the mechanism of adsorption, were the pseudo first order, the pseudo- second order and the intraparticle diffusion models. The differential form of the pseudo- first order model of adsorption can be expressed as [37]:
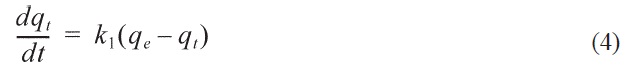
where qe and qt (mg/gm) are the amounts of dye adsorbed at equilibrium and at time t, respectively, and k is the equilibrium constant (min-1).
Integration is performed for Eq. (4) and by applying the initial conditions qt = 0 at t = 0
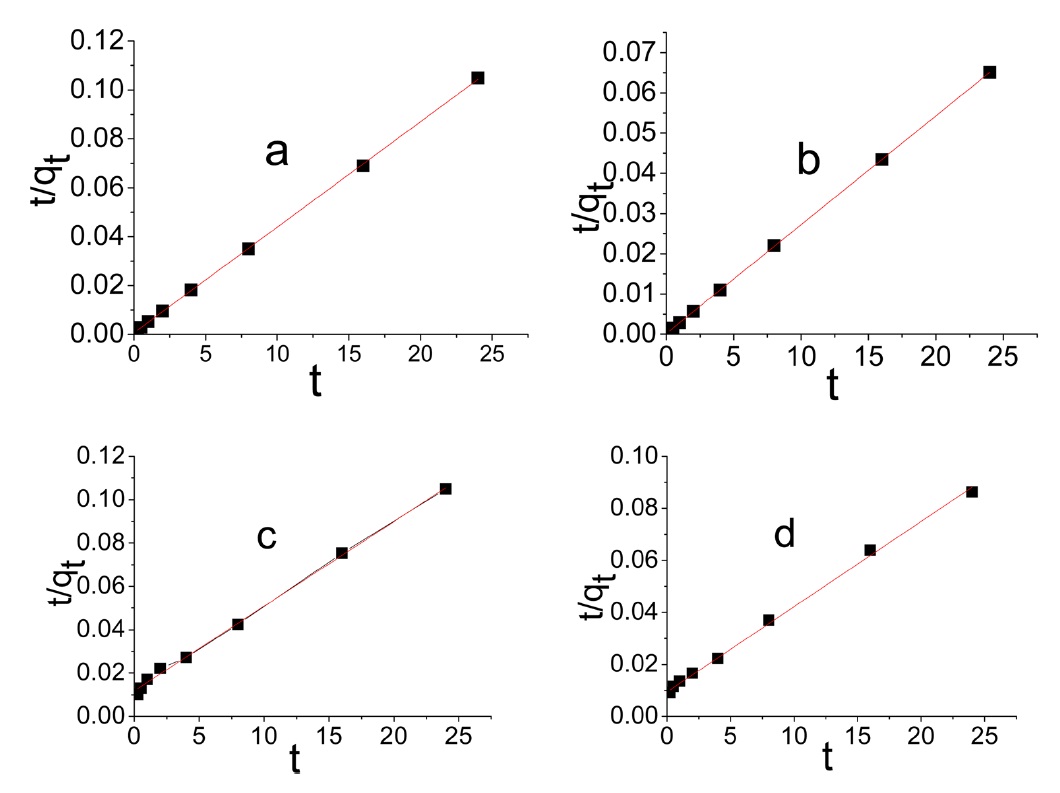
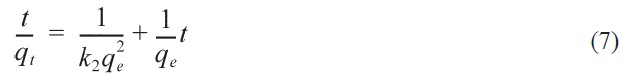
The differential form of the pseudo- second order reaction equation may be written as [38]
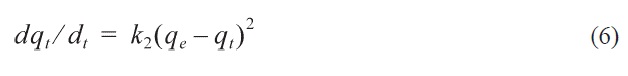
where
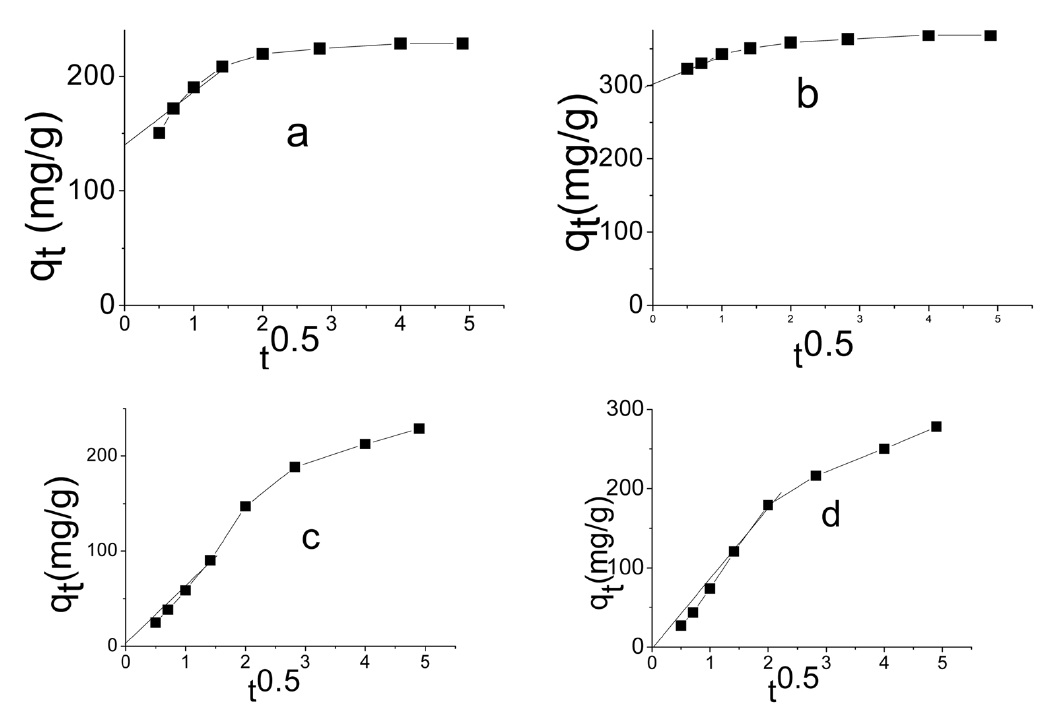
The intraparticle diffusion model was first proposed by Weber and Morris [39], who concluded that the uptake was proportional to the square root of the contact time during the course of adsorption, i.e.,
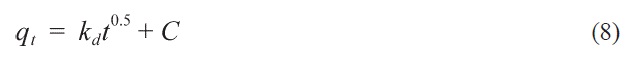
where Kd is the rate constant of the intraparticle transport (mg/ gh0.5). The value of Kd is obtained from the slope of the straight line where C is the intercept.
Evidently the application of the pseudo-first order model to the kinetic adsorption curve of MB and AG gave qe values that were significantly lower than the corresponding experimental ones. Also, the values of the correlation coefficient R2 were rela-
tively low compared with those obtained when the pseudo second order model was considered, as shown in Fig. 8.
Intraparticle diffusion model: according to the intraparticle diffusion model, multilinearity may be obtained when qt is plotted versus t0.5, as shown in Fig. 9. This indicates that more than one step occurred. Evidently, two steps could be present in the current investigation. The first sharper portion stands for the external surface adsorption. The second portion was the gradual adsorption, referring to the intraparticle diffusion controlled adsorption process. If the lines don't pass through the origin, the
[Table 4.] Kinetic parameters for adsorption of methylene blue and acid green 25
Kinetic parameters for adsorption of methylene blue and acid green 25
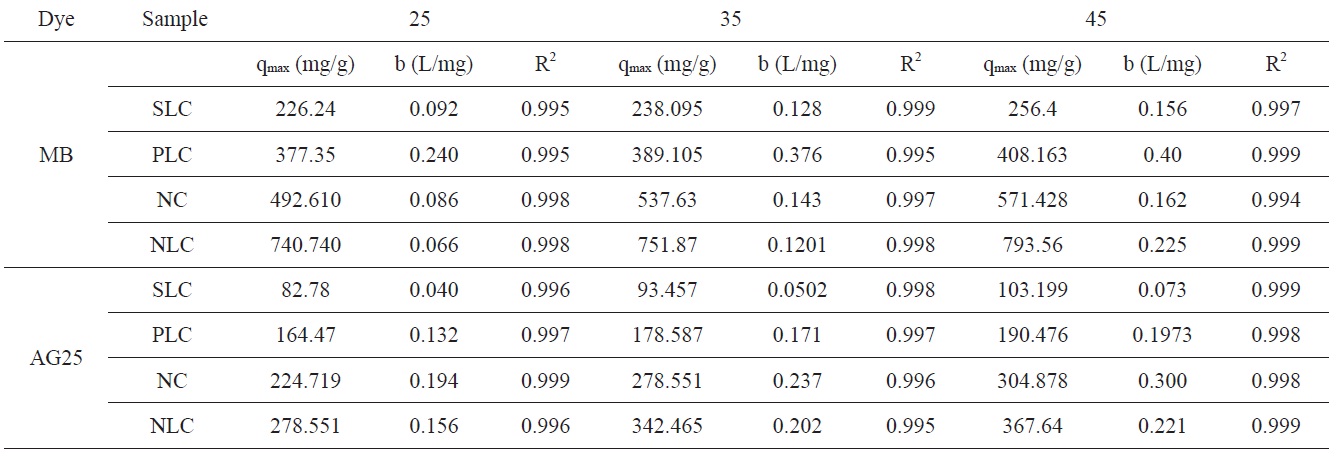
[Table 5.] Langmuir isotherm constants for adsorption of MB and AG 25 onto activated carbons

Langmuir isotherm constants for adsorption of MB and AG 25 onto activated carbons
intraparticle diffusion is not the only rate limiting step and this indicates the effect of film diffusion (boundary layer diffusion) on the adsorption of dyes. A high value of C indicates the increase of the thickness of the boundary layer and consequently its pronounced effect, as can be seen in Table 4.
3.3.3. Equilibrium adsorption isotherm
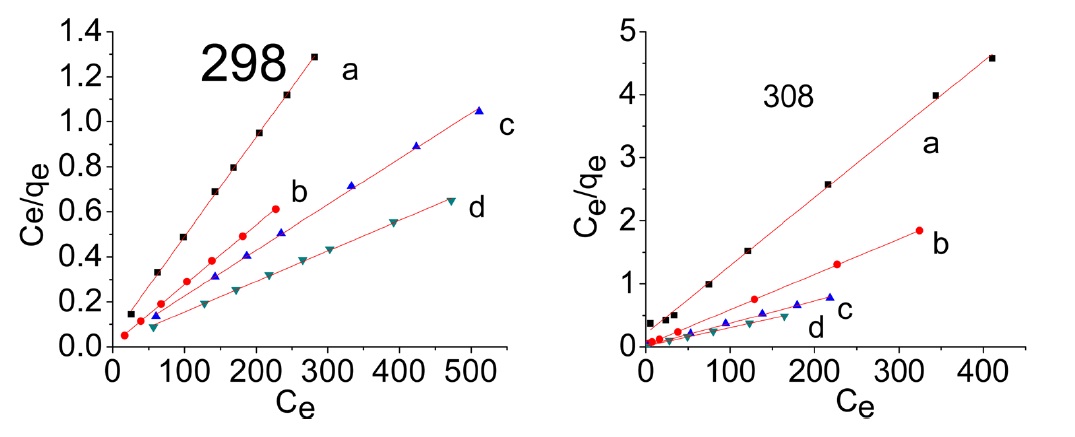
The isotherm data were obtained by plotting the amount of dye adsorbed on the solid (mg/g) against the remaining concentration of dye in the solution (mg/L). The Langmuir adsorption isotherm [40] assumes that adsorption occurs at specific homogenous sites within the adsorbent and makes the estimation of adsorption capacities under various condition a simple task.
The model can be written as
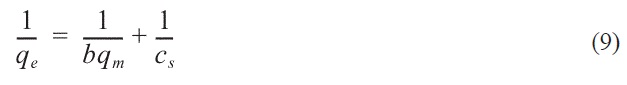
where qe is the equilibrium dye concentration on the adsorbent (mg g-1), Ce is the equilibrium dye concentration in the solution (mg dm-3), and qm is the maximum adsorption capacity (mg g-1). The Langmuir adsorption model is based on the formation of only a monolayer. Based on this, qm is frequently considered to be the monolayer capacity and can be designated qmon (mg g-1); b (L mg-1) is known as the Langmuir constant and is related to the heat of adsorption. The linear form of the Langmuir isotherm equation can be represented as the following:
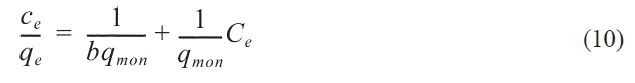
The plots of Ce/qe versus Ce for the adsorption of methylene blue onto AC give a straight line of slope = (1/qmon) and an intercept = (1/bqmon)
The Langmuir isotherm parameters for adsorption of MB and AG 25 are listed in Table 5.
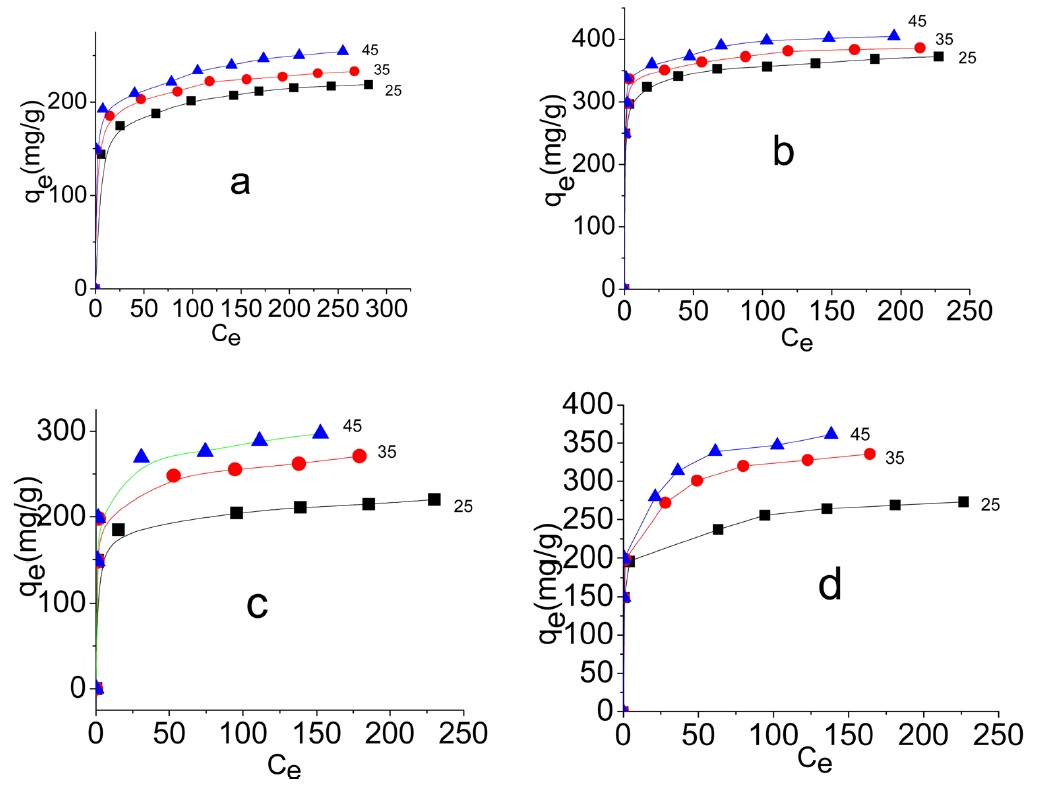
Representative equilibrium adsorption isotherms of MB and AG measured at 298, 308, and 318 K on the investigated ACs are shown in Fig. 10 and their linear plots are shown in Fig. 11; these linear plots indicate that the adsorption of both dyes by
the investigated adsorbents could be representated adequately by the Langmuir model:
3.3.4. Effect of temperature
Fig. 10 shows that adsorption of MB and AG increases with the increase of adsorption temperature from 298 to 318 K. Evidently, the increase of adsorption with temperature at low equilibrium concentration was less pronounced. The increase of adsorption with increase of temperature indicates that the adsorption of MB and AG by the investigated ACs is an endothermic process. This isn't surprising to the authors because the dye molecules are relatively bulky and the pore diameters of the adsorbent are of small
. It has been previously mentioned in this paper that the pore radii of the investigated carbons lie between 1.76 and 1.22 nm. The rise of adsorption temperature probably enhanced the diffusion of dye molecules to the adsorption sites at the surfaces inside the pores [41].
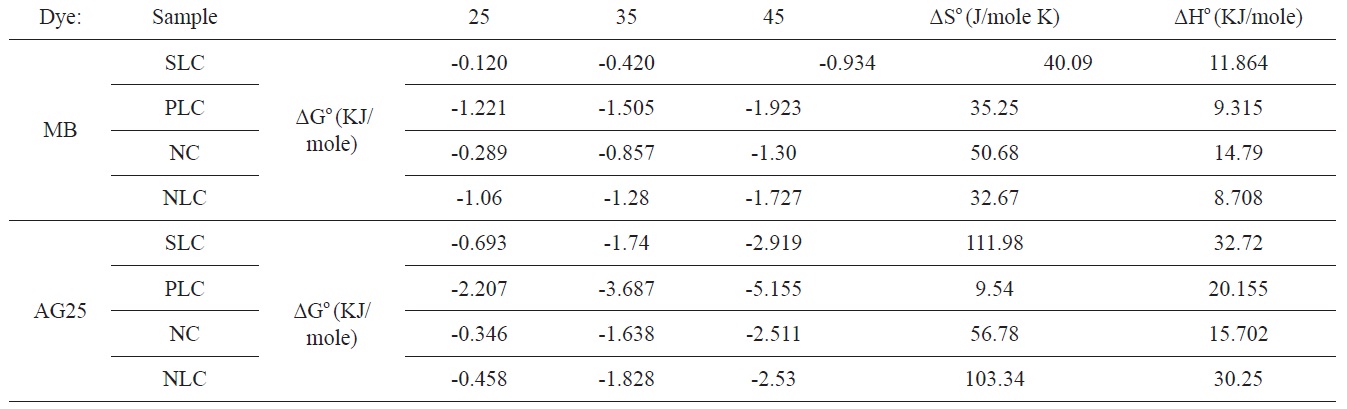
3.3.5. Thermodynamic parameters
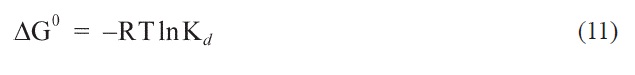
The change in standard free energy (ΔGο) of adsorption was calculated from Eq. (11). In this equation,
[Table 6.] Thermodynamic parameters for adsorption of MB and AG on activated carbons
Thermodynamic parameters for adsorption of MB and AG on activated carbons
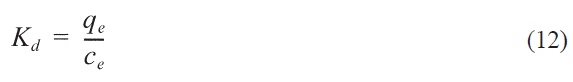
[41] where qe and Ce are the equilibrium concentrations of dye ion on adsorbent (mg/gm) and in solution (mg/L), respectively. Standard enthalpy (ΔHο) and entropy (ΔSο) of adsorption could be estimated from the Van't Hoff equation:
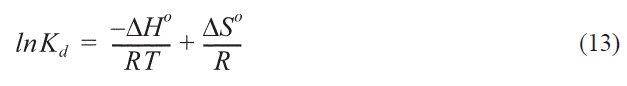
The slope and intercept of the Van't hoff plot are equal to
The values of ΔGο, ΔHο, and ΔSο are shown in Table 6.
The positive value for enthalpy change indicates that the sorption is endothermic in nature. This is also observed from the increase of the sorption capacity with temperature. The negative values of ΔGο indicate the spontaneous nature of the adsorption process; the value of ΔGο is > 0.12 < 5.16 KJ/mole, i.e., it is a value that is consistent with the electrostatic interaction between the adsorption sites and the adsorbing ions (physical adsorption).
The most important mechanism for adsorption of dyes is mainly between oxygen free Lewis basic sites, which are related to delocalized π electrons on the basal planes of the AC, and the free electrons of the dye molecule resulting from several aromatic rings and double bonds.
ACs of expanded surface area, well developed micropore structure, and large total pore volume were prepared from RH, a residue of agricultural activity. The textural properties of RHbased ACs depend on the methods and conditions of carbonization and activation, and on the activating agent used. NaOHACs exhibited the highest adsorption capacities for MB and AG; these carbons showed the highest surface areas and also the highest pore volumes. The pore size of the sorbent and the bulkiness of the dye molecule determined the dye uptake. Dye adsorption was found to be pH dependant whether the dye is of basic or acid type. The adsorption of MB and AG followed pseudo-second order kinetics and the adsorption was controlled by intraparticle diffusion and the boundary layer effect. The adsorption was found to be spontaneous, endothermic, and of a physical nature.