

Recently, conductive polymer nanocomposites have attracted much attention owing to their variety of possible applications, such as in electronic devices, magnetic shielding, polymer electrolyte membranes, and gas sensors as well as their anti-static application potential [1-3]. Conductive nanocomposites consisting of conductive fillers and an insulating polymer exhibit electrical conductivity when the amount of conductive filler exceeds a certain critical point. This is known as the percolation threshold effect. As conductive fillers, carbon-based fillers, i.e., carbon black, carbon fiber, carbon nanotubes or graphite, are generally used to obtain a lower percolation threshold and to improve the physical, thermal, and electrical properties of polymers [4-7].
Carbon nanotubes (CNTs), which have small dimensions and a high aspect ratio, have been studied as conductive fillers in conjunction with various polymers due to their remarkable mechanical and electrical properties [8-10]. However, the high cost of CNTs limits their range of practical applicability. In response to this, expanded graphite (EG) produced by the exfoliation of natural graphite, offering excellent electrical conductivity of roughly 104 S/cm, has been used as an affordable conductive filler. The high aspect ratio and large surface area of EG facilitate the formation of a conductive network at lower content, as compared with conventional conductive fillers such as metal powders, carbon blacks, and carbon fibers. While polymer nanocomposites based on EG have been reported, the inherently limited conductivity of EG restricts the attainable conductivity of conductive polymer nanocomposites [11-13].
Among the various polymers developed to date, poly(ethylene terephthalate) (PET) is one of the most widely used thermoplastics, offering many excellent physical properties, such as good thermal stability, strong chemical resistance, and low permeability. In addition, it can be easily prepared in diverse forms, such as fibers, films, and moldings. However, whereas many studies have assessed the physical properties and electrical conductivity of PET/CNT nanocomposites, there has been limited work in the area of PET/co-carbon fillers [14].
Therefore, in the present study, EG and multi-walled CNTs (MWCNTs) were applied as co-conductive fillers and the effects of the MWCNTs on the electrical and mechanical properties of EG/PET nanocomposites were ascertained.
2.1. Materials and sample preparation
The natural graphite (purity >99%, <45 μm) was supplied by Aldrich (USA). MWCNTs produced by a chemical vapor deposition process were obtained from Nanosolution Co. (Korea). The MWCNTs had apurity level that exceeded 95 wt% and average diameters ranging from 10 to25 nm. The PET was supplied by SK Chem. (Korea).
The EG was produced by chemical oxidation using sulfuric acid and nitric acid and a rapid heat-treatment at 1000℃ for 90 s. To purify the raw MWCNTs, pristine MWCNTs were acid-treated by hydrochloric acid. The MWCNTs were immersed in hydrochloric acid under sonication for 2 h and then washed using deionized water until they reached pH 7.0, after which they were dried at 100℃. Finally, the MWCNTs were reacted with 75 wt.% hydrogen peroxide for 12 h at 90℃ and then washed and dried at 100℃.
The nanocomposites were prepared by a melt mixing method using a Brabendermixer (World Enersys, Korea). PET pellets were kneaded with a dual spindle kneader at 280℃ for 15 min. Two wt% of EG was added and kneaded at 280℃ for 30 min. MWCNTs were then added, at 0.5, 1.0, 1.5, and 2.0 wt%, to the EG/PET mixtures and this was kneaded at 280℃ for 1 h. After cooling, the mixtures were hot-pressed into a mold at 210℃. Each composition used to prepare the nanocomposites is listed in Table 1.
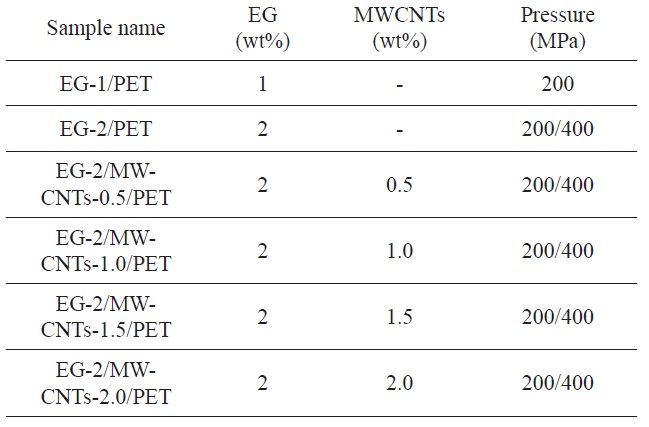
The abbreviations of the nanocomposites prepared with a different weight ratios of co-carbon filler
The morphologies of the EG/PET and EG/MWCNTs/PET were observed using transmission electron microscopy (TEM, FE-TEM 2006; JEOL, Japan) and scanning electron microscopy (SEM, JEOL S-4200; HITACHI, Japan). The structures of the EG, MWCNTs, EG/PET and EG/MWCNT/PET samples were determined by X-ray diffraction (XRD, DMAX 2200V; RIGAKU, Japan) analyses at 40 kv and 40 mA using Cu Kα radiation. The XRD patterns were obtained in a 2θ range between 2? and 70? at a scanning rate of 2?/min. The tensile strength of the EG/MWCNT/PET samples was measured using a universal testing machine (UTM, LR5K; LLOYD, UK). Each sample was tested at a crosshead speed of 2 mm/min at room temperature. The electrical conductivity of the EG/MWCNT/PET samples was measured at room temperature using a four-point probe digital multi-meter (MCP-T610; Mitsubishi Chem., Japan).
Rapid heat treatment of acid-treated graphite at high temperatures causes it to expand due to the escape of the H2SO4 intercalated into the graphite interlayer. This occurs according to the following reaction [14]:
In previous work [15], after the expansion caused by the heat treatment, the EG has worm-like appearance with a large interlayer distance. It has a loose and porous vermicular structure. In addition, the MWCNTs are disentangled after the acid treatment.
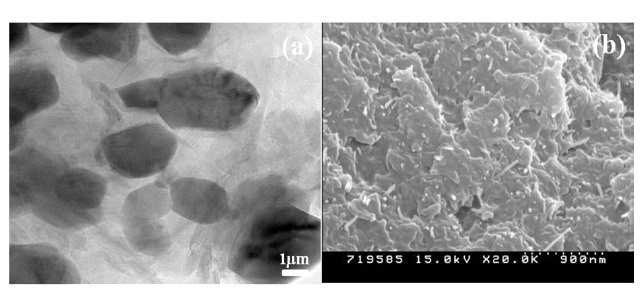
The morphologies of the EG/PET and EG/MWCNT/PET samples are shown in Fig. 1. In the TEM image of the EG/PET, the black particles including solid lines and white domains are considered to be the EG and the PET matrix, respectively. The EG is exfoliated by the intensive shear force as it is processed, resulting in a plate-like form similar to graphite nanosheets. The graphite nanosheets are disorderedly dispersed in the PET matrix, leading to aprimarily conductive network. Also, smaller EG particles are produced by the intensive shear force and become embedded in the PET matrix. The SEM image of a EG/ MWCNT/PET sample indicates that the MWCNTs are well dispersed and embedded throughout the EG/PET, as shown in Fig. 1b. Also, the MWCNTs are interconnected between the EG lay-
ers and form an additional conductive network. These conductive networks result in an easy electron transfer by the more electrically conductive pathway, presenting a synergistic effect of the co-carbon fillers with respect to the improvement of the electrical conductivity of the PET [16].
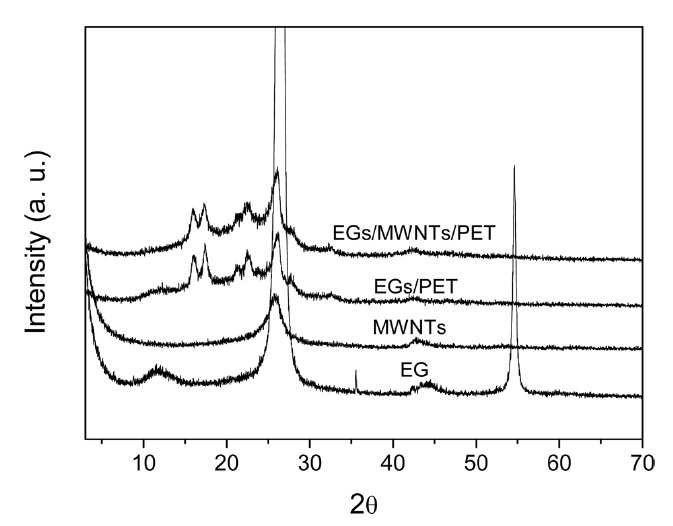
Fig. 2 shows XRD patterns of EG, MWCNTs, EG/PET, and EG/MWCNT/PET samples. The EG and MWCNTs show a sharp graphite diffraction (002) peak at approximately 2θ = 26? . Additionally, the EG shows a small diffraction (001) peak at 2θ = 12?. However, the EG/PET and EG/MWCNT/PET samples show a very small intense peak at 2θ = 26?, similar to the MWCNTs, while a diffraction (001) peak is not observed. The crystalline peaks of PET were noted at 2θ = 16?, 2θ = 17? , and 2θ = 22?. These results indicate that the EG is exfoliated by the intercalation of PET in the EG layers during the melt mixing process, resulting in a decrease of the intensity of the crystalline peak of the EG. Moreover, the weak EG peak overlaps the MWCNT peak [17].
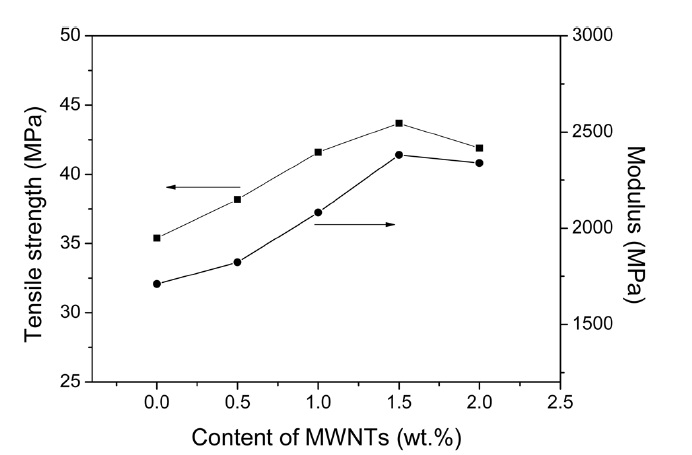
Fig. 3 shows the tensile strengths and moduli of the EG/PET as a function of the MWCNT content. The tensile strength levels and moduli of the EG/PET are significantly improved by increasing the MWCNT content. The maximum values of the tensile strengths and moduli arise at 1.5 wt% MWCNT loading. These values are approximately 25% and 40% higher, respectively, than those of the EG/PET. It is clear that well-dispersed MWCNTs in EG/PET serve as effective reinforcement via the strong intermolecular interaction between the MWCNTs and the PET matrix. Above 1.5 wt% MWCNTs, the mechanical properties of the nanocomposites decrease due to the accumulation of the MWCNTs. The formation of aggregates of MWCNTs leads to weak interaction between the MWCNTs and the PET matrix [18].
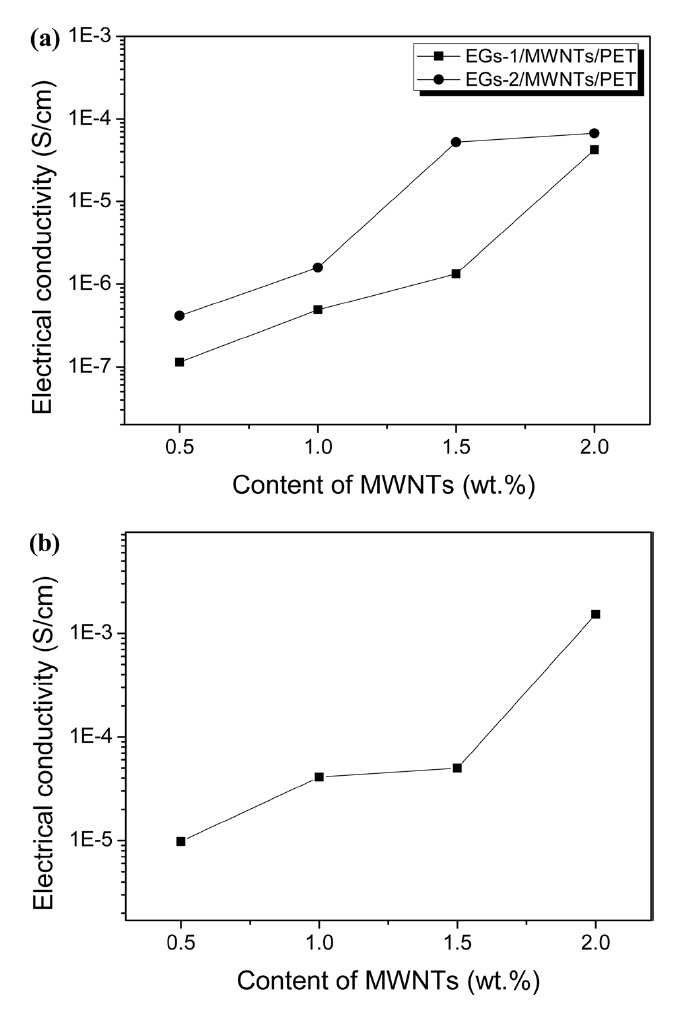
The electrical conductivity is a critical parameter with which to qualify conductive polymer composites. It is influenced by the filler content, filler type, and dispersion of the filler. In this work, EG and MWCNTs are used as co-conductive fillers to obtain conductive polymer composites with a low filler content. Fig. 4a shows the electrical conductivity of the PET as a function of the EG/MWCNT ratio. When EG is used alone as
a conductive filler, the electrical conductivity of the PET is not detectable (within the limits of the equipment). However, the electrical conductivity of the PET remarkably increased with the addition of MWCNTs and is dependent on the EG content when the amount of MWNTs is constant. This suggests that the exfoliated EG primarily formed a rough conductive network, after which MWCNTs, which have a high aspect ratio, were interconnected in disordered EG layers. This causes the formation of a densely conductive network, leading to the improved electrical conductivity of the nanocomposites via the interaction between the EG and the MWCNTs [19,20]. Fig. 4b shows the electrical conductivity of a EG/MWCNT/PET sample prepared at a compression of 400 MPa so as to create nanocomposites under identical conditions. These nanocomposites have higher electrical conductivity levels compared to the nanocomposites prepared at 200 MPa (Fig. 4a). This is due to the enhanced formation of a continuous and more condensed conductive network of both the EG and MWCNTs within the PET matrix [21].
In this study, EG and MWCNTs were used as co-carbon fillers to improve the electrical properties of PET. The effects of the MWCNTs on the electrical and mechanical properties of EG/PET were then determined. The co-carbon fillers were well dispersed in the PET matrix by the melt mixing method. After mixing, the interconnected co-carbon fillers formed a dense conductive network with a low filler content, indicating that the large-dimension EG formed primarily a conductive network, after which the MWCNTs caused the formation of a dense conductive network. Indeed, the electrical conductivity of the EG/ PET was significantly increased with an addition of MWCNTs. This was as result of abridging effect of MWCNTs, which have good conductivity and a high aspect ratio.

