Decoction is an extraction method that involves boiling with dissolved chemicals, herbs or plant material, which may include stems, roots, bark, and rhizomes [1]. Traditional decoction procedures require considerable time and laborious effort, so herb extractors based on electrical energy have been popularized by most medical clinics and hospitals that practice Korean medicine. Electrical extractors have many advantages such as convenience and lower demands in terms The capacity to control the extraction method (pressurized or non-pressurized) and the extraction time are further strengths of electrical extractors, and can improve the extraction efficiency. Despite these advantages, however, possible problems with electrical extractors may include unnecessary extraction, degeneration, or decomposition of chemical compounds. Unlike steam vapor methods, toxic substances might also persist with pressurized extraction methods because they cannot be released from the extractor. The boiling point of water is also increased under pressurized conditions. Thus, the necessity to use pressurized methods has become a subject of interest.
Several studies have reported a relationship between the extraction conditions and the composition of the decoction, including a higher solubility of effective components in Hunaglian jiedu decoctions [2] and a decrease in the level of Yinqiaosan ingredients with increased extraction time [3]. However, no studies of the overall relationship between extraction method (pressurized or non-pressurized), extraction time, and decoction composition are available in the published literature.
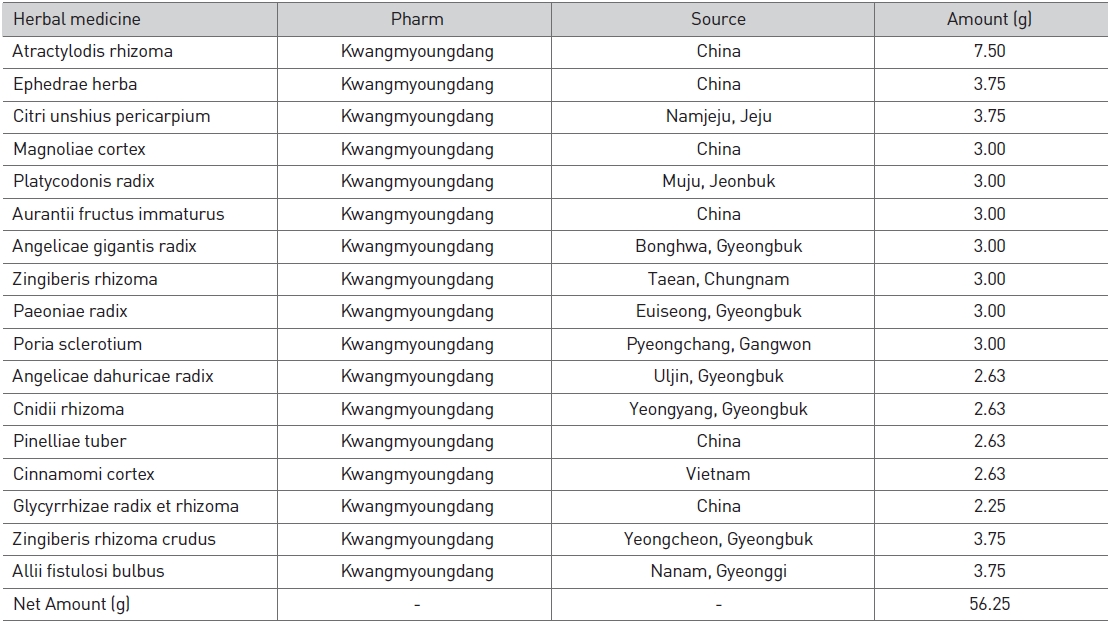
Ojeok-san (Wuji-san in Chinese) is composed of 17 herbal medicines, i.e., Atractylodis rhizoma, Ephedrae herba, Citri-unshius pericarpium, Magnoliae cortex, Platycodonis radix, Aurantii fructus immaturus, Angelicae gigantis radix, Zingiberis rhizoma, Paeoniae radix, Poria sclerotium, Angelicae dahuricae radix, Cnidii rhizoma, Pinelliae tuber, Cinnamomi cortex, Glycyrrhizae radix et rhizoma, Zingiberis rhizoma crudus, and Allii fistulosi bulbus. In Korea, Ojeok-san is ranked first in terms of Oriental Health Treatment medicated days and medical expenses by 56 Prescription [4]. It is also the fifth most frequently prescribed herbal formula [5] and the main herbal medicine preparation provided in Korean medical clinics [6], which means it is the most frequently used disease treatment in a number of Korean medical institutes.
In the present study, we prepared different decoctions of Ojeok -san by using pressurized or non-pressurized extraction methods for extraction times of 60, 120, and 180 mins. Each decoction was analyzed to determine the extract yield, the total soluble solid content, the hydrogen ion concentration (pH), and the reference compound content.
2.1. Reagents and herbal materials
HPLC (high performance liquid chromatography)-grade methanol, ethanol, acetonitrile, and water were purchased from J. T. Baker Inc. (Phillipsburg, NJ, USA). GR grade acetic acid was obtained from Junsei (Tokyo, Japan). Standard compounds of albiflorin (98.0%), paeoniflorin (99.0%) liquiritin (98.0%), cinnamaldehyde (98.0%), glycyrrhizin (99.0%), naringin (≥ 99%), and gingerol (98.0%) were purchased from Wako Pure Chemical Industries Ltd (Osaka, Japan). Neohesperidin (≥ 90.0%) and ferulic acid (99.0%) were obtained from Sigma-Aldrich (St. Louis, MO, USA). Hesperidin (≥ 98%) and nodakenin (99.0%) were purchased from Chengdu Biopurity Phytochemicals Ltd (Chengdu, China) and NPC BioTech (Geumsan, Korea), respectively.
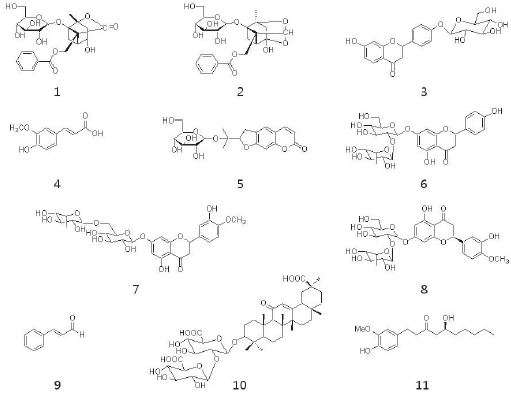
The chemical structures of the standard compounds are shown in Fig. 1. The herbal medicines composing Ojeok-san were purchased from a local herbal market (Kwangmyoungdang Pharms, Ulsan, Korea), and it was prepared according to a published method found in the literature [7], as shown in Table 1. Voucher specimens (No. 201203) were deposited with the Basic Herbal Medicine Research Group in Korea Institute of Oriental Medicine.
2.2. Preparation of standard solutions
Accurately weighed standard compounds were dissolved in methanol to produce stock solutions at concentrations of 1 mg/ mL. Each stock solution containing a standard compound was diluted to produce working solutions, which were used to construct calibration curves.
2.3. Preparation of Ojeok-san decoctions
The decoction was prepared using a method similar to that used in medical institutes of Korean medicine. Thus, the herbal medicines that constitute Ojeok-san were mixed and extracted at 100℃ in water by using a superspeed vacuum herb extractor (Cosmos 660, Kyungseo Machine, Korea). We used a formula weight of 1125 g, which corresponded to one formula set ( ‘Je’ in Korean), i.e., 20 times a single dose. The extraction was performed using pressurized and non-pressurized methods for 60, 120, or 180 mins. We packaged 120 mL of each decoction in retort pouches by using an automatic packaging machine (MH 205 Tower, Kyungseo Machine, Korea). We regulated the extraction water to make the final volumes of the decoctions around 3800 mL to produce 30 pouches. Each decoction was filtered through a 0.2 ㎛ syringe filter (SmartPorⓡ; Woongki Science, Korea) prior to HPLC injection.
2.4. Measurements of the yield, total soluble solid content, and hydrogen ion concentration (pH)
We concentrated 100 mL of each decoction by using a freezedrier (Ilshin, Korea). The weight of each freeze-dried decoction was converted to a percentage of the formula used for a single extraction. The total soluble solid content was measured using a refractometer (Pal-
2.5. Chromatographic conditions
Chemical compounds were analyzed using an HPLC system (LC-20A; Shimadzu, Japan) equipped with a solvent delivery unit (LC-20AT), autosampler (SIL-20AC), column oven (CTO-20A), photo-diode array detector (SPD-M20A), and degasser (DGU- 20A3). The acquired data were processed using the LabSolutions software (Ver. 5.3; Shimadzu, Japan). Compounds was separated on a Gemini C18 column (4.6 mm × 250 mm, 5 μm; Phenomenex, USA) at 40℃. The flow rate was 1.0 mL/min, and the injection volume was 10 μL. The mobile phase consisted of water containing 1.0% acetic acid (A) and acetonitrile containing 1.0% acetic acid (B), with the following elution gradient: 0-20 mins, 15-25% B; 20-40 mins, 25-55% B; 40-45 mins, 55-100% B. Each compound was quantified at its maximum wavelength in the UV spectrum (230, 254, 280, 320, and 330 nm, respectively).
All experiments were performed at least three times. Twotailed
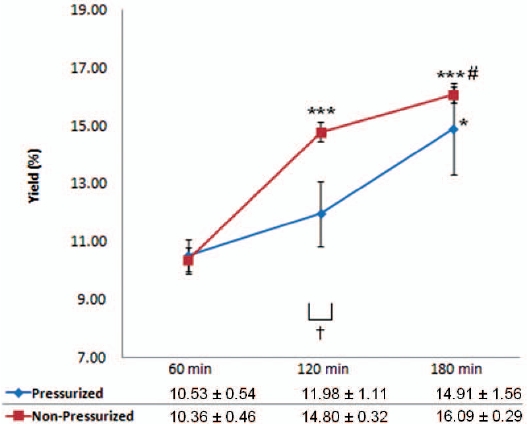
3.1. Yields of Ojeok-san decoctions for various extraction methods and extraction times
There were significant increases in the yields of decoctions extracted using the non-pressurized method at 120 mins and 180 mins compared with 60 mins (42.86 and 55.31%, respectively) while there was also a significant increase at 180 mins compared with 120 mins (8.72%). For pressurized extraction, the yield increased with increasing extraction time, but the increased decoction yield was only significant at 120 mins when compared with 60 mins (13.77%). Non-pressurized extraction produced significantly higher extraction yields (23.54%) compared with pressurized extraction at 120 mins. The yield was increased as the extraction time was increased, especially for the nonpressurized method (Fig. 2).
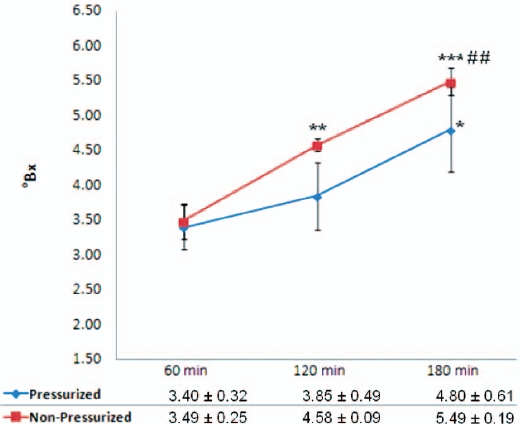
There was a significant increase in the total soluble solid content of decoctions extracted using the non-pressurized method at 120 mins and 180 mins compared with 60 mins (31.23 and 57.31%) while there was also a significant increase at 180 mins compared with 120 mins (19.87%). Compared with 60 mins, an extraction time of 120 mins produced a significant increase in total soluble solid content (13.24%). There were no significant differences in the total soluble solid contents of decoctions extracted using pressurized and non-pressurized methods with different extraction times. Total soluble solid content was increased as the extraction time was increased, especially for the non-pressurized method (Fig. 3).
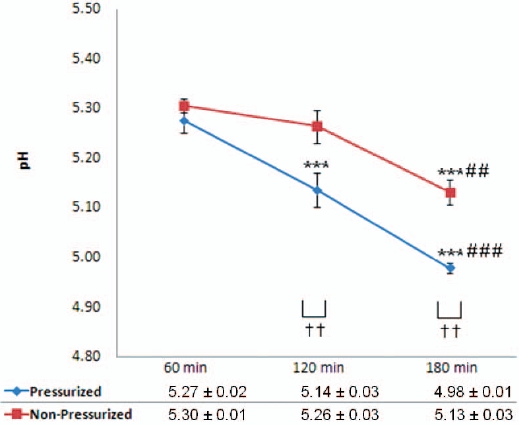
There were significant decreases in the hydrogen ion concentrations (pH) of decoctions produced by using non-pressurized extraction at 180 mins compared with 60 mins and 120 mins (3.21 and 2.47%, respectively) whereas there was a non-significant decrease at 120 mins compared with 60 mins. In contrast,
there were significant decreases in the pH as the extraction time was increased for pressurized extraction decoctions, i.e., at 120 mins and 180 mins compared with 60 mins, and at 180 mins compared with 120 mins. Compared with non-pressurized extraction, pressurized extraction produced decoctions with a significantly lower pH at 120 and 180 mins. The pH was decreased as extraction time was increased, especially for the pressurized method (Fig. 4).
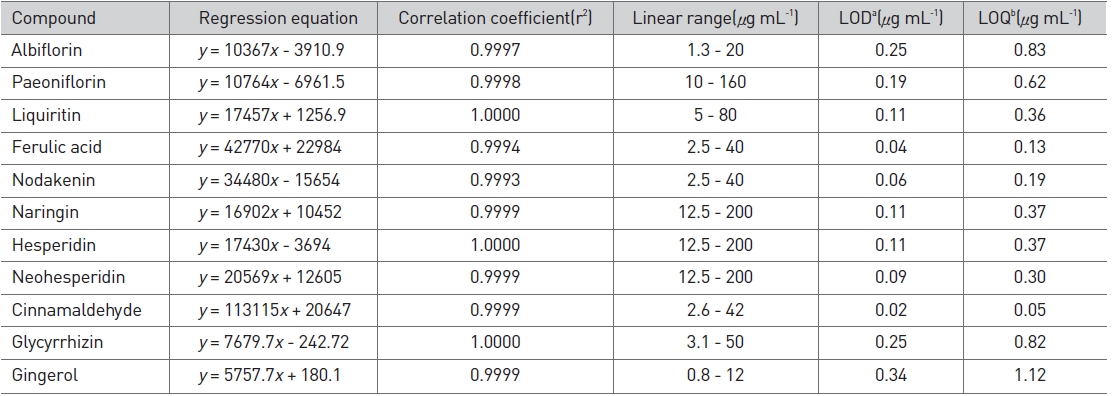
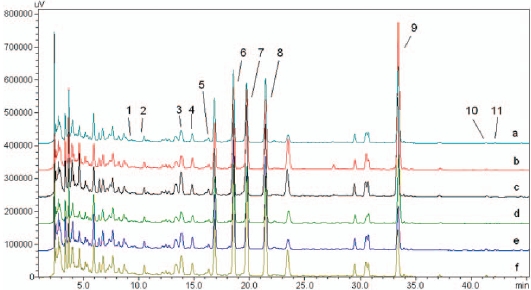
We accurately dissolved weighed standard compounds in methanol and diluted them to five different concentrations to construct calibration curves. The correlation coefficient (r2) for each compound ranged from 0.9993 to 1.0000, which indicated good linearity. The detection limit (LOD) and the quantification limit (LOQ) were calculated based on the concentration of each compound with signal-to-noise ratios of 3 and 10, respectively. The range of the LOD was 0.02-0.34 μg/mL, and that of the LOQ was 0.05-1.12 μg/mL (Table 2). The compounds detected in Ojeok-san decoction were well separated on chromatograms by using the methods described above (Fig. 5).
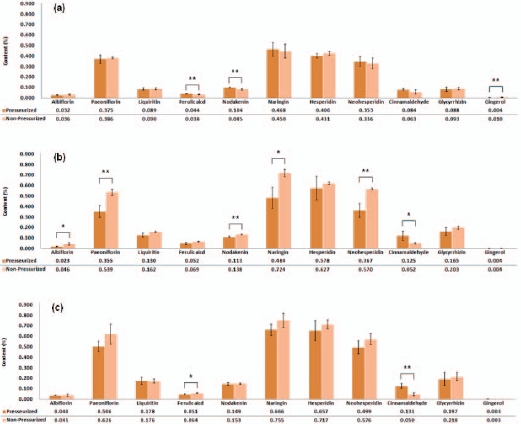
At 60 mins, there were significantly higher levels of ferulic acid and nodakenin in decoctions produced using the pressurized method compared with the non-pressurized method (15.79% and 22.35%) whereas gingerol had a higher concentration in the non-pressurized decoctions (150.0%). At 120 mins, the nodakenin level was significantly higher in decoctions produced using the non-pressurized method compared with the pressurized method (22.12%) and increases were also shown at the levels of albiflorin (100.0%), paeoniflorin (51.83%), naringin (49.59%), and neohesperidin (55.31%) in decoctions produced using the nonpressurized method. In contrast, the concentration of cinnamaldehyde was higher in pressurized decoctions than in nonpressurized decoctions (140.38%). At 180 mins, more ferulic acid was extracted by using the non-pressurized method than the pressurized method (25.29%) while the higher cinnamaldehyde concentration with pressurized extraction remained constant at 120 mins (162.0%) (Fig. 6).
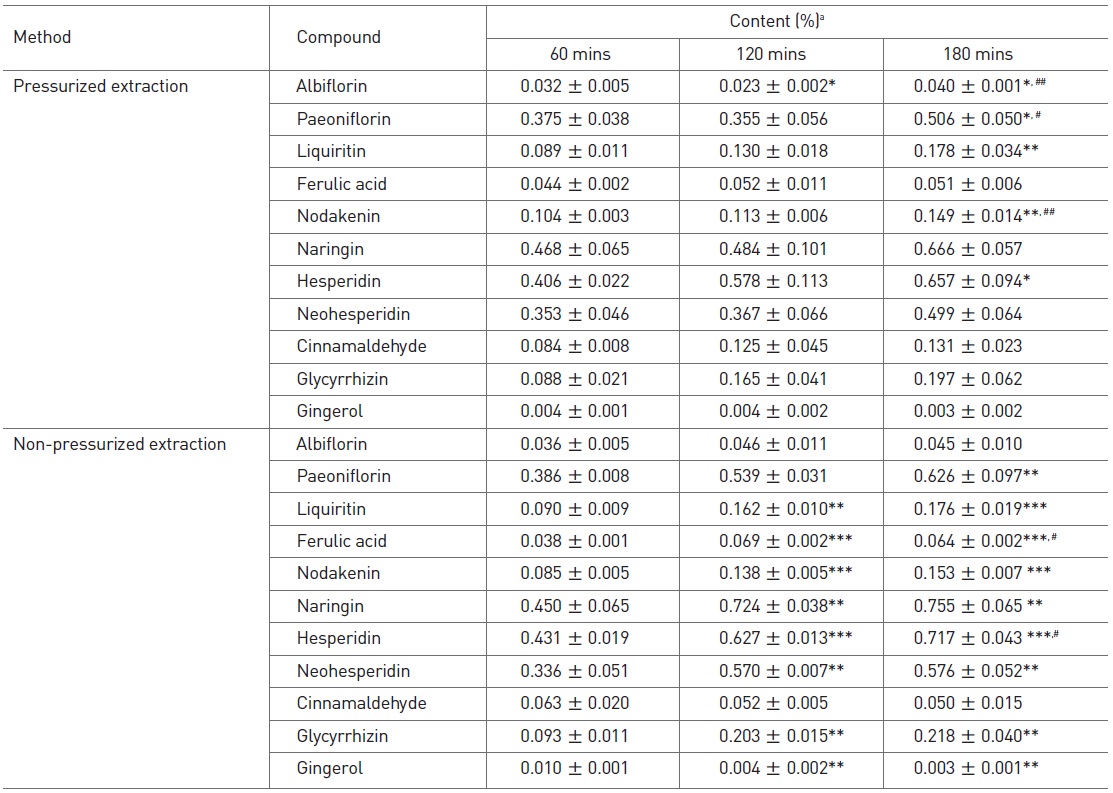
There were significant increases in the liquiritin and the hesp-

Linear range, regression equation, correlation coefficient (r2), LOD, and LOQ of standard compounds
eridin concentrations at 180 mins compared with 60 mins when using the pressurized extraction method, with percentages of 100.0% and 61.82%, respectively. The nodakenin concentration was higher at 180 mins compared with 60 mins (43.27%) and 120 mins (31.86%). At 180 mins, the albiflorin and the paeoniflorin concentrations were significantly higher than at 60 mins, with percentages of 25.0% and 34.93%, respectively. The albiflorin and the paeoniflorin concentrations at 180 mins were also significantly higher than those at 120 mins whereas the concentrations at 120 mins were lower than those at 60 mins (significant and non-significant, respectively). Over time, there were changes in the concentrations of ferulic acid, naringin, neohesperidin, cinnamaldehyde, glycyrrhizin, and gingerol, but these differences were not significant. In contrast to the pressurized decoction results, most compound concentrations, including those of paeoniflorin, liquiritin, ferulic acid, nodakenin, naringin, hesperidin, neohes-peridin, glycyrrhizin, and gingerol, were significantly higher in decoctions produced using the nonpressurized method at 120 mins and 180 mins compared with 60 mins. The cinnamaldehyde concentration decreased nonsignificantly with increasing extraction time whereas the gingerol concentration showed a significant decrease as the extraction time was increased (Table 3).
Decoctions are prepared by heating, so extraction factors such as temperature, time, or pressure can influence the yields or concentrations of the constituent compounds found in a decoction. In the present study, we tested pressure and extraction time as factors while the temperature was maintained at 100℃. The volume of the extraction water was determined through a previous test with pressurized and non-pressurized extraction methods to produce a constant volume of each decoction for 60, 120, and 180 mins (data not shown).
The extraction yield is expressed as the percentage of dry weight extract divided by the weight of the individual herbal medicine or medicines that comprise a formula, which is increased by using pressurized extraction or a longer extraction time [8-11]. In our study, the yields increased with longer extraction times when using pressurized and non-pressurized extraction methods, which agreed with previous reports [11]. However, the yields at 120 mins and 180 mins were higher in decoctions produced using the non-pressurized extraction method, which contradicts previous reports [8-10]. The same result was also found for the total soluble solid content. The total soluble solid content is composed of salts, proteins, or acids, which is affected by the extraction solvent, the extraction time, and the temperature, and it increases as a function of the extraction time and the temperature [12,13]. In the current study, the non-pressurized extraction method resulted in a higher, although non-significant, total soluble solid content, which also contradicted previous published reports. Pressure increases the boiling point of water [14], which suggests that the higher temperature found in pressurized conditions might degrade the compounds found in the decoction over time. This decomposition might have reduced the yield and the total soluble solid content.
The hydrogen ion concentration (pH) is also affected by the extraction temperature and the extraction time. The pH is decreased with higher extraction temperatures and longer extraction times [15]. In the current study, the pH decreased with longer extraction times. A previous report showed that the pH was reduced as the total soluble solid content was increased [16], which means that the decrease in the pH during the current study may have been related to the increased total soluble solid content. Thus, more substances that increase the acidity may have been extracted into the decoction with longer extraction times.
As shown in Table 3, the extraction time affected the concentration of reference compounds in decoctions produced using the pressurized and the non-pressurized methods. Most of the compounds had higher extraction rates with longer times, with the exception of cinnamaldehyde in decoctions produced using the non-pressurized method. The concentration of cinnamaldehyde decreased with increasing extraction time when using the non-pressurized method, which contrasted with an increasing concentration when using the pressurized method. Steam vapor can be released during the non-pressurized extraction method, so some of the characteristic aromatic essential oil cinnamaldehyde [17] may have evaporated over time.
In general, pressurized extraction produces higher amounts of chemical compounds, including flavonoids, lignans, carotenoids, and lipids [18-21]. However, significantly higher amounts of albiflorin, paeoniflorin, nodakenin, naringin, and neohesperidin were extracted in decoctions produced by using nonpressurized method compared with the pressurized method at 120 mins. This trend continued up to 180 mins, although the difference was not significant. The levels of these compounds were also higher in non-pressurized decoctions up to 120 mins. These results indicate that the extraction of certain types of chemical compounds may be improved by using a nonpressurized extraction method because pressurized methods disrupt the extraction of compounds from plant herbal medicine tissues or cause degradation of chemical compounds.
In conclusion, the extraction method (pressurized or nonpressurized) and the extraction time affected the physicochemical properties of Ojeok-san decoctions. Therefore, the optimum extraction conditions need to be selected to ensure the appropriate extract yield, total soluble solid content, pH, and concentration of chemical compounds.