In this paper, we discuss design considerations for an n-channel metal-oxide-semiconductor field-effect transistor (MOSFET) with a lateral asymmetric channel (LAC) doping profile. We employed a 0.35 ㎛ standard complementary MOSFET process for fabrication of the devices. The gates to the LAC doping overlap lengths were 0.5, 1.0, and 1.5㎛. The drain current (ION), transconductance (gm), substrate current (Isub), drain to source leakage current (IOFF), and channel-hot-electron (CHE) reliability characteristics were taken into account for optimum device design. The LAC devices with shorter overlap lengths demonstrated improved ION and gm characteristics. On the other hand, the LAC devices with longer overlap lengths demonstrated improved CHE degradation and IOFF characteristics.
Epoxy resin is a good material for the electrical insulating systems in heavy electric equipments because it has good mechanical and thermal properties as well as excellent electrical properties [1-3]. Therefore, new epoxy-based composites having higher performance with lower cost have been developed in the electric application fields and it was found that 65~80 wt% loading of micro-silica improved not only the mechanical and thermal properties but also the dimensional stability of the neat epoxy insulator in the heavy electric equipments which were generally operated at 40-60℃. Furthermore, a new concept of the mixture of nano- and micro-fillers for epoxy-based composites was proposed by Imai et al. [4-6], where the mixture systems were composed with micro-silica and nano-silica or nanoscaled multilayered silicate.
Generally, the multilayered silicates such as montmorillonite, saponite, hectorite, talc, mica, etc.[7-9] are naturally synthesized in bulk shape and they are purchased in fine particles of ㎛ scale. Therefore, a micro-scaled multilayered silicate should be separated each other into sheet-like monolayers in the polymer matrix in order to maximize the merit of nanosized filler [8,9]. However, it is very difficult for the polymer chains to penetrate into the hydrophilic interlayers of the multilayered silicate. Therefore, many researchers have studied to develop polymer nanocomposites with fully separated nanosilicates.
There are five synthetic methods to prepare polymer/ organoclay nanocomposites: (1) in-situ polymerization, (2) direct melt intercalation, (3) solution intercalation, (4) direct layered silicate method and (5) dispersion and aggregation method [10-12]. In the in-situ polymerization process, an organoclay is swollen in the oligomer reactants or monomers for a certain amount of time and then polymerization reaction is initiated by adding a
curing agent or a peroxide initiator, respectively. In the direct melt intercalation process, a molten thermoplastic is mixed with an organoclay and then the mixture is annealed at a temperature above the glass transition temperature of the polymer. In the solution intercalation process, organoclay is dispersed in a polar solvent such as toluene or N, N-dimethylformamide forming swelled gel structures. Then, a polymer solution is added to the swelled gel structures and the polymer chains intercalates between the clay layers. In the direct layered silicate method, the layered silicates with molecular level are directly synthesized from the clay precursor of gel shape in the polymer solution and in the dispersion and aggregation process, clay solution and polymer latex are mixed and polymer chains are penetrated into the intergallery of the layered silicate.
In this study, ultrasonication process was combine with the insitu polymerization process in order to prepare epoxy/ organoclay nanocomposites .
Cloisite® 93A(Southern Clay Products Inc., Gonzales, TX, USA) was used as a multilayered silicate, which was a natural montmorillonite modified with M2HT (methyl, dehydrogenated tallow quaternary ammonium) as a sort of quaternary ammonium salt. The molecular structure of the M2HT was as follows:

where, HT was hydrogenated tallow (~65% C18; ~30% C16;~5% C14) and the anion was chloride. The multilayered silicate was dried at 100℃ for 10 hours in vacuum oven and stored at a desiccator.
A commercialized diglycidyl ether of bisphenol A (DGEBA) type epoxy resin whose trade name was YD 128 (Kukdo Chem.Co., Seoul, Korea) was used. The epoxy equivalent weight was 184~190 g/eq and the viscosity was 11,500-13,500 cps at 25℃. Curing agent was 3- or 4-methyl-1,2,3,6-tetrahydrophthalic anhydride (Me-THPA) whose grade name was HN-2200 (Hitachi Chem. Co., Tokyo, Japan). It is widely used in the field of electrical insulation fields. A tertiary amine type accelerator was benzyl-dimethyl amine (BDMA, Kukdo Chem. Co.).
2.2 Preparation of nanocomposite
Epoxy base resin (DGEBA, 100 g) and Cloisite 93A (5 g) were well-mixed with an 500 W probe-type ultrasonicator (VC 505, Sonics & Materials Inc., Newtown, CT, USA) at a frequency of 20 kHz for 15, 30 60, and 120 minutes, and then Me-THPA (80 g) and BDMA (0.9 g) were sequentially poured into the epoxy base resin/ multilayered silicate mixture using a mechanical stirrer for 30 minutes. The mixtures were poured into a specimen mold and degassed in vacuum oven. They were cured at 150℃ for 2 hours.
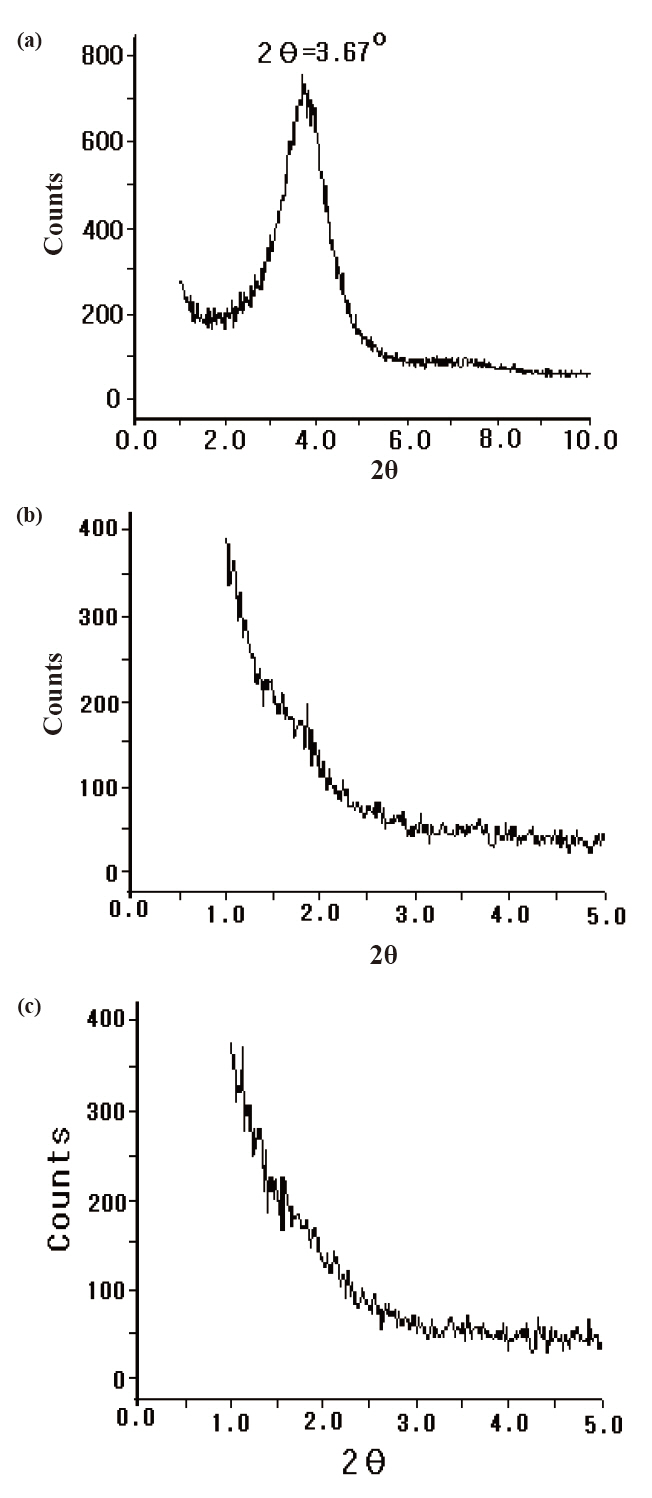
The change of interlayer distance was measured by wide-angle X-ray scattering diffractometer (WAXD, XRD30; Rigaku, MD, USA). The X-ray beam was nickel-filtered Cu K1 (λ = 0.154 nm) radiation operated at the tube voltage of 40 kV and the tube current of 30 mA. The scanning range was 2θ = 1.0-10o with a rate of 1°/min.
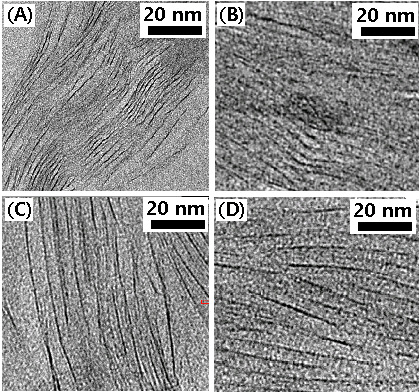
The morphology of the layered silicate in the epoxy matrix was observed by a high-resolution transmission electron microscope (TEM, Hitachi S-4100; agency Korea, Seoul, Korea). The nanocomposite was cut into ultrathin sections of about 70-90 nm by a Power TOME X microtome equipped with a diamond knife and the ultrathin sections were placed on a 200 mesh copper grid. The measurement was performed using an accelerating voltage of 200 kV.
To measure glass transition temperature (Tg), shear test was carried out by a dynamic mechanical analyzer (DMA2980, TA Instrument Ltd., USA) at a frequency of 1.0 Hz and a heating rate of 10℃/min. The specimen dimension was 12.5 mm × 7.0 mm × 3.0 mm and the nitrogen purge rate was 110 mL/min.
Flexural test was carried out by universal testing machine (SHM-C-500, Shamhan Tech., Seoul, Korea). Specimen was prepared under the recommendation of JIS B7502 and they were tested at a crosshead speed of 10 mm/min at 23℃ and 50% relative humidity.
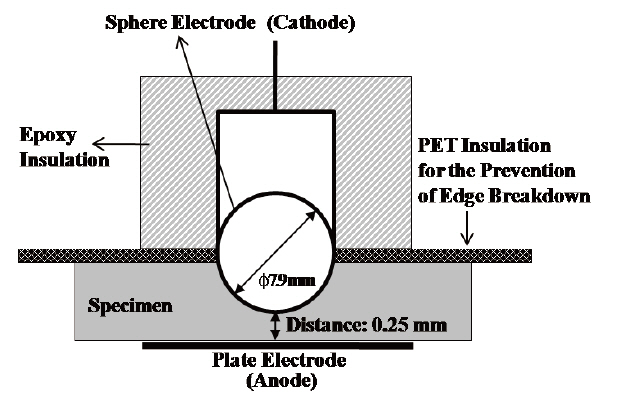
Sphere-plate electrodes were arranged to measure the AC insulation breakdown strength as shown in Fig. 1. The cast specimen was designed to be 0.25 mm thickness at the most thin point and the electrodes were arranged at the point with the expectation that the insulation breakdown would take place in that point. However, edge breakdown took place in many cases, so the upper half of the sphere electrode was insulated by epoxy resin and PET film in order to prevent the edge discharge and breakdown. The electrodes and specimen were dipped into the insulating oil at 30℃ and high voltage was applied until the electrical breakdown with rising speed of 2 kV/s.

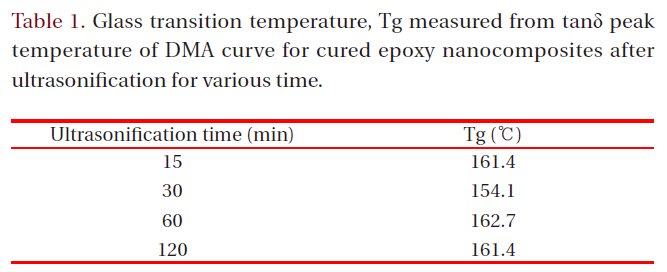
Glass transition temperature Tg measured from tanδ peak temperature of DMA curve for cured epoxy nanocomposites after ultrasonification for various time.
To evaluate the effect of ultrasonic wave on the arrangement of the silicate layers, WAXD patterns for (A) the original Cloisite 93A powder and for the cured epoxy nanocomposites after ultrasonification for (B) 15 minutes and (C) 30 minutes were shown in Fig.2. The pattern for the original Cloisite 93A showed a peak at 2θ =3.67°, which could be interpreted as the interlayer distance (dspace) of the montmorillonite to be 2.40 nm. The d-space could be calculated by introducing the 2θ value to Bragg’s formula [12], λ = 2d sinθ, where λ was the wavelength of X-ray beam (λ = 0.154 nm), d was the d-space and θ was the scattering angle. However, the peak at 2θ = 3.67° disappeared as the epoxy/Cloisite 93A mixture was cured after ultrasonification and the pattern intensity at lower angle than 2θ = 1.5° (d-value was over 5.87 nm) became strong. It meant that the Cloisite 93A was in intercalated state, but not in exfoliated state. The patterns after ultrasonification for 60 and 120 minutes were also showed the similar, which were not displayed in Fig. 2. However, the effect of ultrasonification time was very little.
The intercalation state was confirmed by TEM observation, as shown in Fig. 3. Image (A) was for the cured epoxy/Cloisite 93A system without ultrasonification treatment, where the silicate layers were displayed as dark lines with ordered arrangement and narrow interlayer distance. This implied that the conventional‘in-situ polymerization’ method for the preparation of nanocomposite for our epoxy system was not proper method. As the ultrasonification time increased, the interlayer distance became broader, as shown in the images (B)-(D), however the order
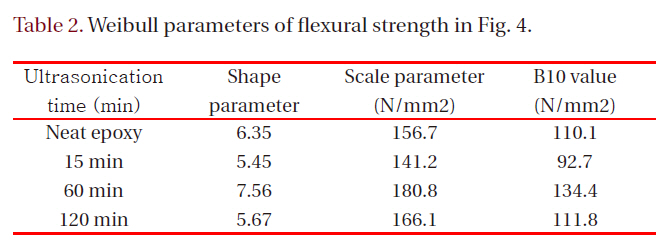
[Table 2.] Weibull parameters of flexural strength in Fig. 4.

Weibull parameters of flexural strength in Fig. 4.
[Table 3.] Weibull parameters of AC insulation breakdown strength in Fig. 5.
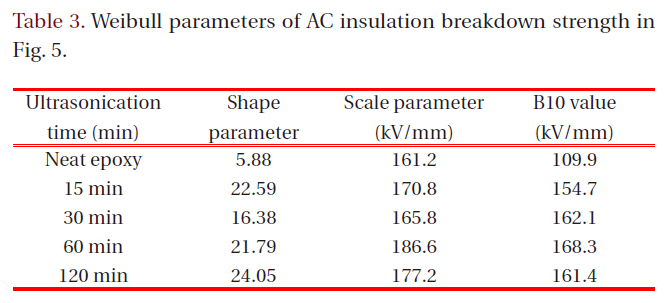
Weibull parameters of AC insulation breakdown strength in Fig. 5.
of arrangement was almost maintained without any exfoliated state. It was well-agreed with the results of WAXD analyses.
To estimate the effect of the intercalated silicate layers on the flexural strength and electrical breakdown strength, glass transition temperature, Tg was measured from tanδ peak temperature of DMA curve and it was listed on Table 1. Tg value was not dependant with the ultrasonification treatment time. Generally, silicate mineral with micro-scale may attribute to increment of Tg value owing to the hydrogen bonding between a hydroxyl group in epoxy matrix and silanol group on the silicate surface. When the silicate layers were intercalated into nano-scaled layers, its surface area became broader so that the hydrogen bonding site increased. However, increased number of nano-scaled layers maybe interrupted the cure reaction between epoxy resin and curing agent resulting low Tg. Therefore, Tg value was not dependant with the ultrasonification treatment time.
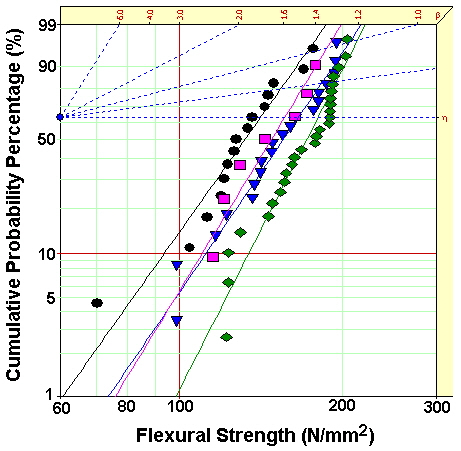
Figure 4 showed Weibull plots of flexural strength for neat epoxy resin and epoxy nanocomposites, and the Weibull parameters such as shape and scale parameters and B10 value were obtained from the Weibull plots and listed in Table 2. In here, the shape parameter could be obtained from the slope meaning the data distribution, and the scale parameter represented the flexural strength by which 63.2% of the cumulative probability was expected to fail. The B10 value referred to the flexural strength at which 10% would fail (90% would survive) under a given stress.The statistical analysis showed that flexural strength of the neat epoxy was 156.7 N/mm2 and that for the nanocomposite of 60 minutes was 180.8 N/mm2, the largest value. This result was well agreed with the result of Tg, that is, the higher Tg was the higher flexural strength was.
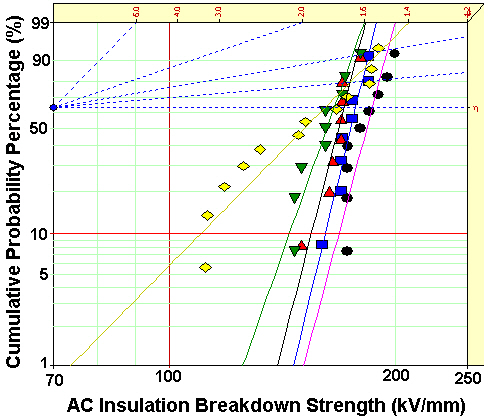
Figure 5 showed Weibull plots of AC insulation breakdown strength for neat epoxy resin and epoxy nanocomposites and the parameters were listed in Table 3. The statistical analysis showed that AC insulation breakdown strength was 161.2 kV/mm in the neat epoxy resin and those for the epoxy nanocomposites were remarkably modified by addition of intercalated silicate. Despite of the better intercalation effect in the epoxy nanocomposites after ultrasonification for 120 minutes, however, the insulation breakdown strength was highest in the epoxy nanocomposites after ultrasonification for 60 minutes. It would be because increasing number of nano-scaled monolayers maybe interrupted the cure reaction between epoxy resin and curing agent resulting low breakdown strength.
In the case of shape parameter, the value of the neat epoxy resin was 5.88 and those for the epoxy nanocomposites were greatly
increased by addition intercalated silicate. The higher the gradient became, the more homogeneous the breakdown strength data were. These results meant that the intercalated nano-size silicates with plate-shape were evenly dispersed in epoxy matrix and provided the improving AC insulation breakdown characteristics to the epoxy resin.
A new electrical insulating material for the heavy electric equipments was prepared by mixing epoxy matrix and nanosized layered silicate, where nano-sized silicate was pre-prepared from the multilayered silicate via ultrasonication process. The WAXD peak at 2θ = 3.67° (d-space = 2.40 nm) for Cloisite® 93A was disappeared in the cured nanocomposite system, and TEM observation showed that the layered silicates were in the intercalated state. Weibull statistical analysis showed that flexural strength of the neat epoxy was 156.7 N/mm2 and that for the nanocomposite of 60 minutes was 180.8 N/mm2, the largest value. Weibull statistical analysis for AC insulation breakdown strength was 161.2 kV/mm in the neat epoxy resin and those for the epoxy nanocomposites were remarkably modified by addition of intercalated silicate. These results showed that the intercalated nano-size silicates were evenly dispersed in epoxy matrix and provided the improving AC insulation breakdown characteristics to the epoxy resin.