검색 전체 메뉴
PDF
맨 위로
OA 학술지
Emission Properties from Induced Structural Degradation of a-C:H Thin Film
  • 비영리 CC BY-NC
  • 비영리 CC BY-NC
ABSTRACT
Emission Properties from Induced Structural Degradation of a-C:H Thin Film
KEYWORD
a-C:H film , Plasma enhanced chemical vapor deposition , Graphite-like , Thermal energy , Dehydrogenation
  • 1. INTRODUCTION

    Hydrogenated amorphous carbon (a-C:H) films have been widely investigated owing to their numerous potential applications in hard coatings, lithography, electroluminescence (EL)devices, field emission devices[1-4]. a-C:H’s emitting property has attracted considerable interest due to potential uses in EL devices [5,6]. Understanding thermal stability is important for the practical application of EL devices, since emission of a-C:H thin film accompanies heat generation inside the film. Photoluminescence(PL) of a-C:H thin film is known to be quantum confinement effect of localized carriers in sp2 clusters surrounded by a sp3 region of high resistivity [7]. That is, the sp3 region of high resistivity acts as a tunnel barrier and confines carriers in the sp2 cluster, leading to radiative recombination of electron and hole pair [8]. Hydrogen in a-C:H thin film is a critical factor to have a direct effect on phase stability of sp3/sp2 bonds [9,10]. Accordingly,thermal stability of a-C:H thin film must be investigated together with hydrogenation to determine the thermal effect on its PL property.

    To the best of our knowledge, the observation of microstructural change during emission has seldom been reported in a-C:H thin film. Only a couple of publications have reported the annealing effect for a-C:H thin film.

    In this letter, we report the emitting properties of a-C:H thin film during spontaneous emission using a He-Cd laser source.Additional thermal annealing was also performed to determine what kind of degradation occurred during the spontaneous emission. Detailed characterizations of the microstructure are performed to explain the relationship between the microstructure and the emission property.

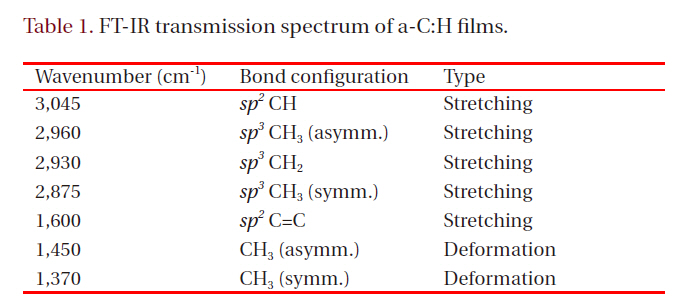
    [Table 1.] FT-IR transmission spectrum of a-C:H films.

    label

    FT-IR transmission spectrum of a-C:H films.

    2. EXPERIMENTAL PROCEDURE

    Commercial p-type Si(100) wafers were used as substrates.Si wafers were cut into 12 × 12 × 2 mm3. The substrates were treated with 10% HF (Hydrogen Fluoride) solution and rinsed with deionized water, then dried in pure N2 gas. The substrates were mounted on a stainless steel plate inside the direct current(DC) saddle-field plasma-enhanced chemical vapor deposition(PECVD). The detailed description of DC saddle-field PECVD is described elsewhere [11,12]. a-C:H films were grown at room temperature (RT) with constant substrate bias voltages of 200 V. Base pressure and working pressure were 1 × 10⁻⁶Torr and 90 mTorr, respectively.

    The 325 nm line of He-Cd laser (double spectrometer; SPEX 1403, USA) was used as a photoexcitation source. The change of PL spectra was taken during excitation. a-C:H thin films were annealed from 100℃ to 400℃ in atmospheres to determine the thermal effect during the photoexcitation. Microstructures of the films were analyzed using Fourier transform infrared (FT-IR)spectroscopy (spectrum 2000; Perkin Elmer, UK). IR transmission spectra, ranging from 400 to 4,000 cm-1, were taken in a N2 atmosphere to minimize H2O vapor influence.

    3. RESULTS AND DISCUSSION

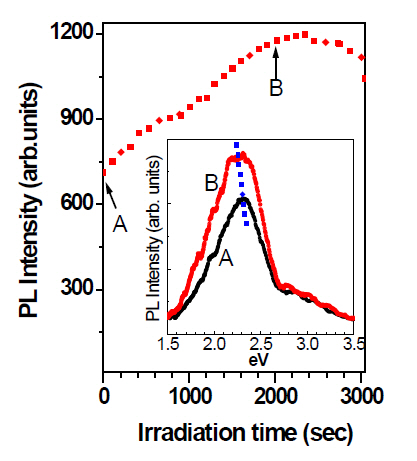
    a-C:H thin films were irradiated to a typical He-Cd laser to study emitting stability. Figure 1 shows the dependence of PL intensity on the laser irradiation time. As seen in Fig. 1, the PL intensity gradually increased by 170% with the irradiation time up to 2,000 seconds. After reaching the maximum intensity at

    around 2,000 seconds, the PL intensity started decreasing very slowly. The PL intensity was still 1.7 times higher than the initial value, even 1,000 seconds after the maximum. The inset in Fig.1 shows PL spectra for the a-C:H thin film at 0 second and 2,000 seconds that correspond to ‘A’ and ‘B’ in Fig. 1. As seen in the inset,Full width half maximum of the PL peak increased from 0.45 eV to 0.58 eV with the laser irradiation time. The center of the PL peak shifted to the lower energy to 2.28 eV after laser irradiation of 2,000 seconds.

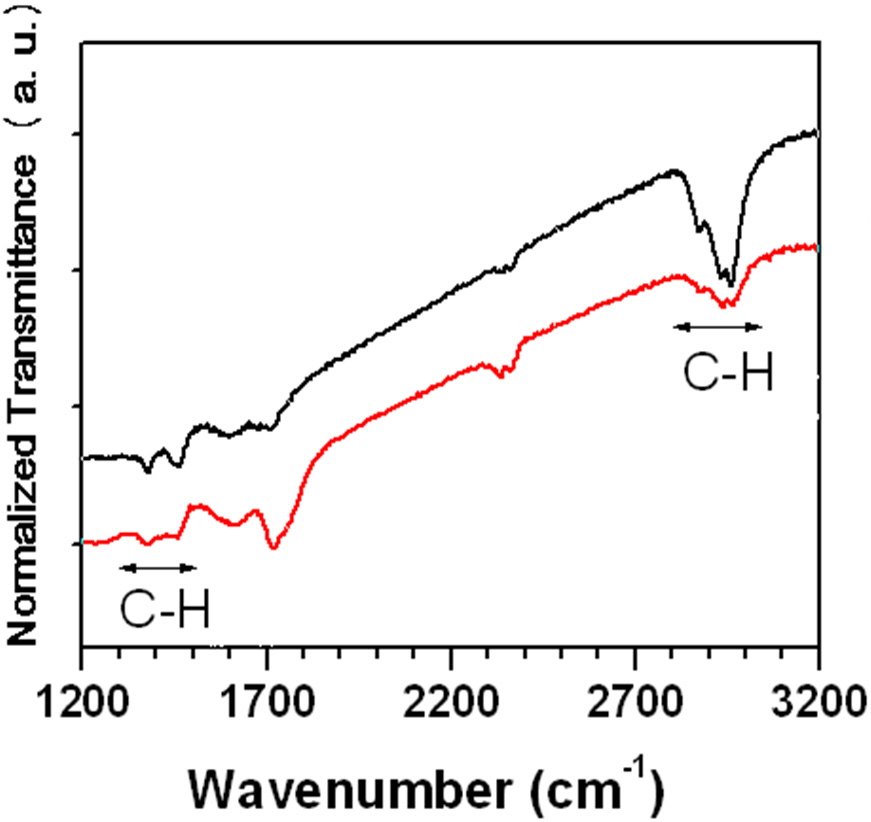
    The FT-IR method was exploited to investigate structural change of a-C:H thin film during the laser irradiation, as shown in Fig. 1. Figure 2 shows FT-IR spectra of a-C:H thin film before and after laser irradiation, at elapsed times of 0 second and at 3,000 seconds, respectively. Table 1 identifies each absorption band. The IR absorption band area between 2,700 cm-1 and 3,200 cm-1 represents the relative amount of bonded hydrogen in a-C:H film [9]. Considering this, well separated peaks of as-deposited a-C:H thin film between 2,700 cm-1 and 3,200 cm-1 advise the presence of C-H bonds in a polymer-like structure with high hydrogen content. In contrast, the a-C:H thin film deposited after laser irradiation contains fewer C-H bonds than those of the as-deposited film in terms of a drastic decrease of the absorption area in the range. This means a-C:H thin film suffers transformation from a polymer-like to a graphite-like phase under laser irradiation.

    The remaining energy is expected to be converted into heat,since only a small portion of energy from laser energy irradiating a-C:H thin film can be used to excite the radiative recombination of the electron and hole pair. In turn, the generated heat could preferentially break the weaker C-H bond (3.5 eV) than the C-C bond (25 eV), resulting in dehydrogenation. In this respect, it can be seen that the dehydrogenation by laser irradiation up to 2,000 seconds increases sizes of the sp2 bonded carbon cluster, resulting in increased PL intensity. Therefore, the confinement effects of carriers in those clusters weaken, leading to broadening and red shift of the PL curve in Fig. 1. However, excessive dehydrogenation is more likely thought to generate non-radiative defects rather than contribute to PL intensity.

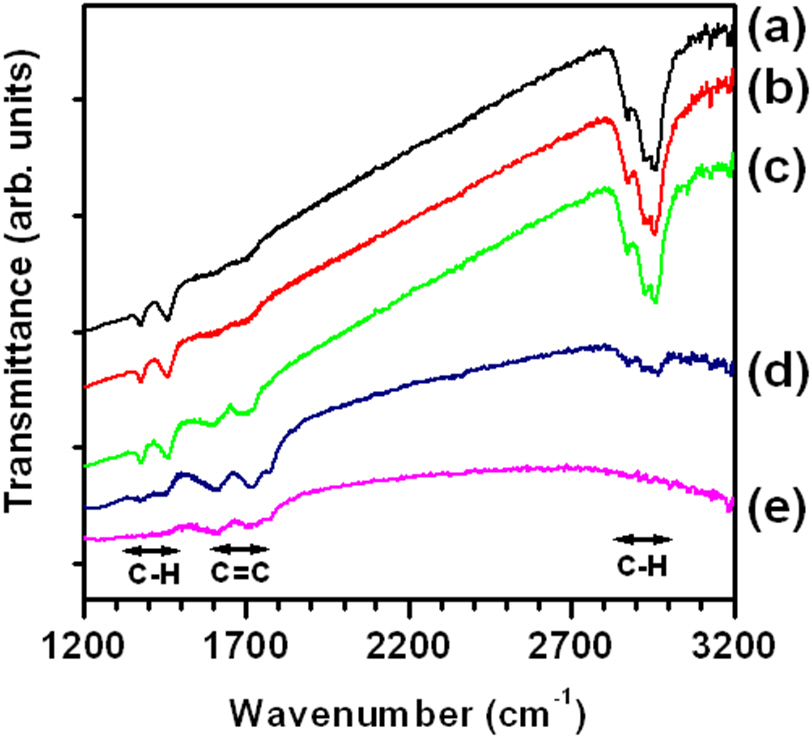
    As deposited a-C:H thin films were annealed at temperatures ranging from 100℃ to 400℃ to investigate thermal effects of laser irradiation on C-H bonding in a-C:H film.

    Figure 3 shows IR spectra of as-deposited and annealed a-C:H thin films at different temperatures. Well-separated peaks of asdeposited a-C:H thin film between 2,700 cm-1 and 3,200 cm-1 lasted up to annealing temperature of 200℃. The area of the absorption band between 2,700 cm-1 and 3,200 cm-1 showed only a slight decrease, as the annealing temperature (Ta) increased from RT to 200℃. In contrast, the area of the absorption band showed significant decrease, as Ta increased from 200℃ to 300℃or higher. This indicates that dehydrogenation significantly occurs between 200℃ and 300℃. There were no signs of C-H bonds from a-C:H thin film annealed at 400℃. Increase of temperature to 400℃ completely dehydrogenated a-C:H thin film, as seen in Fig. 3, and in turn was expected to cause red shift of the PL peak by increasing the C=C cluster size.

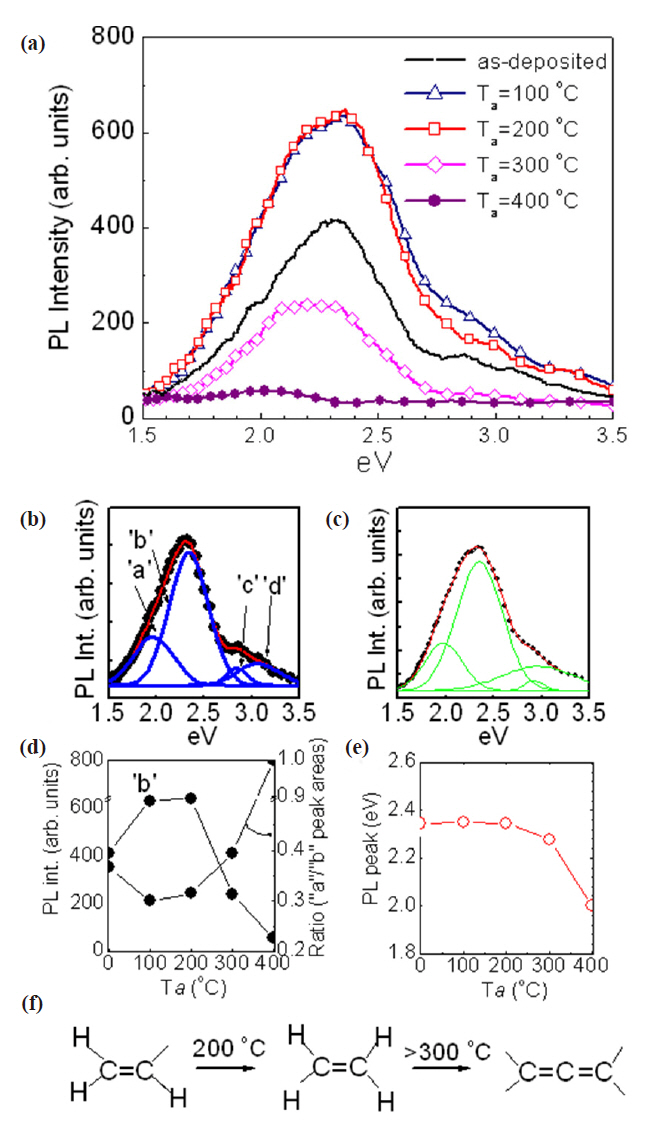
    Figure 4 shows dependence of PL on various annealing temperatures for a-C:H thin films. PL spectra were deconvoluted into four individual peaks, indicating the size of C=C cluster had various PL in a-C:H thin film. Figures 4(b) and (c) are examples of the deconvolution for as-deposited a-C:H thin films and annealed at 100℃, respectively.

    As the annealing temperature increased up to 200℃, PL intensity drastically increased and reached a maximum. After reaching the maximum, the PL intensity considerably decreased, as the annealing temperature increased from 200℃ to 400℃.

    Figure 4(d) showed intensity changes ‘b’ and ‘a’ peak and its ratio in (a) as a function of Ta. It is difficult to explain the drastic rise of PL intensity from RT to 200℃ with the growth of the sp2 cluster by increasing the annealing temperature to 200℃, since little dehydrogenation occurred up to 200℃, as seen in Fig. 3.The PL peak energy in Fig. 4(e) showed almost a constant value up to 200℃, and shifted to a lower energy from 2.35 eV to 2.0 eV,with increasing Ta from 300℃ to 400℃. This means that the shift of PL peak is proportional to the degree of dehydrogenation, as shown in Fig. 3. Although there is no obvious change in microstructure from RT to 100℃, as seen in Fig. 3, the intensity of the‘b’ peak at around 2.3 eV in Fig. 4(d) significantly increases with Ta from RT to 100℃ without red shift. This can be explained by thermal annealing up to 100℃ reducing non-radiative defects,such as dangling bonds in Fig. 4(f ) without dehydrogenation.Non-bonded hydrogen, a non-radiative defect, is so unstable,that even 100℃~200℃ annealing probably can move and bond them with dangling bonds on the sp2 cluster. Again, this does not accompany an increase of sp2 cluster size.

    The significant decrease of ‘b’ peak intensity from 200℃ to 300℃ in Figs. 4(a) and (d) corresponds to considerable reduction of the FT-IR absorption band between 2,700 to 3,200 cm-1 in Fig.3. Thus, excessive dehydrogenation occurs in the temperature range from 200℃ to 300℃. Increase of sp2 cluster size by the excessive dehydrogenation could generate non-radiative channel,resulting in a decrease of PL intensity in Fig. 4(d). The red shift of the ‘b’ peak in Fig. 3(e) represents the increase of the sp2 cluster size as well. These results assist PL change as a function of irradiation time in Fig. 1. The increase of the ratio of the “a” to “b”peak area also supports growth of the sp2 cluster as Ta decreases. Figure 4(f ) schematically depicts the structural changes, as a function of Ta from RT to 400℃.

    4. CONCLUSIONS

    a-C:H film was deposited on a Si(100) substrate by DC saddle field PECVD. A He-Cd laser was used to induce PL of a-C:H. The PL intensity achieved a maximum value that increased to 170%with the irradiation time up to 2,000 seconds. a-C:H thin film was in a polymer-like phase before laser irradiation, but suffered transformation to graphite-like phases after laser irradiation.

    Although some energies of He-Cd laser are used to excite the electron-hole pair, the remainder generates heat, resulting in structural changes in the a-C:H film. The thermal energy positively contributed to the increase of PL intensity at the initial stage, and then had a negative effect in the next stage, leading to a decrease of PL, together with a red shift of the PL peak.

    The annealing of the a-C:H thin film reveals non-radiative defects were reduced by the heat generation in the initial stage,but excessive heat generation causes dehydrogenation in the next stage, leading to an increase of non-radiative defects again.That is, thermal energy reduced non-radiative defects, mainly dangling bonds, probably by connecting them to non-bonded hydrogen at the initial stage. However, excessive thermal energy initiates dehydrogenation, which increases non-radiative defects and sp2 cluster sizes, accompanying the decrease of PL intensity and red shift of the PL peak.

참고문헌
  • 1. Robertson J 1993 [J. Non-Cryst. Solids] Vol.164-166 P.1115
  • 2. Robertson J 1986 [Adv. Phys.] Vol.35 P.317
  • 3. Wang D, Hoyle P. C, Cleaver J. R. A, Porkolab G. A, MacDonald N.C 1995 [J. Vac. Sci. Technol.B] Vol.13 P.1984
  • 4. Lo S. Y, Yeh R. H, Yu T. R, Hong J. W 2009 [IEEE Trans. Electron Devices] Vol.56 P.57
  • 5. Tsai H. C, Bogy D. B 1987 [J. Vac. Sci. Technol] Vol.A 5 P.3287
  • 6. Hamakawa Y, Toyama T, Okamoto H 1989 [J. Non-Cryst. Solids] Vol.115 P.180
  • 7. M. Koos, I. Pocsik, L. Toth 1994 [Appl. Phys. Lett.] Vol.65 P.2245
  • 8. Xu S, Hundhausen M, Ristein J, Yan B, L. Ley 1993 [J. Non-Cryst. Solids] Vol.164-166 P.1127
  • 9. Yoo Y. Z, Kim H, Jang H. K, Jeong Y, Kim G 1998 [J. Vac. Sci.Technol. A] Vol.16 P.2210
  • 10. Park Y. S, Hong B 2008 [J. Non-Cryst. Solids] Vol.354 P.3980
  • 11. Gaspari F, Kruzelecky R. V, Lim P. K, Sidhu L. S, Zukotynski S 1996 [J. Appl. Phys] Vol.79 P.2684
  • 12. Jang H. K, Kim G, Lee Y. S, Whangbo S. W, Whang C. N, Yoo Y. Z, Kim H. G 1999 [J. Vac. Sci. Technol] Vol.A 17 P.2607
이미지 / 테이블
  • [ Table 1. ]  FT-IR transmission spectrum of a-C:H films.
    FT-IR transmission spectrum of a-C:H films.
  • [ Fig. 1. ]  Dependence of photoluminescence (PL) intensity on laser irradiationtime. Inset shows photoluminescence spectra for the a-C:Hthin film at 0 second and 2000 seconds that correspond to ‘A’ and ‘B’in Fig. 1.
    Dependence of photoluminescence (PL) intensity on laser irradiationtime. Inset shows photoluminescence spectra for the a-C:Hthin film at 0 second and 2000 seconds that correspond to ‘A’ and ‘B’in Fig. 1.
  • [ Fig. 2. ]  Fourier transform infrared spectra of a-C:H thin film beforeand after the laser irradiation. as-deposited a-C:H thin film (b) afterlaser irradiation during the elapsed time of 3000 seconds.
    Fourier transform infrared spectra of a-C:H thin film beforeand after the laser irradiation. as-deposited a-C:H thin film (b) afterlaser irradiation during the elapsed time of 3000 seconds.
  • [ Fig. 3. ]  Infrared spectra of (a) as-deposited a-C:H thin film (b) annealedfilm at 100℃ (c) 200℃ (d) 300℃ and (e) 400℃.
    Infrared spectra of (a) as-deposited a-C:H thin film (b) annealedfilm at 100℃ (c) 200℃ (d) 300℃ and (e) 400℃.
  • [ Fig. 4. ]  (a) Dependence of photoluminescence (PL) on various annealingtemperatures for a-C:H thin films. The examples of the deconvolutionfor (b) as-deposited a-C:H thin films and (c) annealed films at100℃. (d) Reveals intensity changes ‘b’ and ‘a’ peak in (a) and its ratioin (a) as a function of Ta. (e) Reveals PL peak energy as a functionof Ta. (f ) Schematic of structural changes as a function of Ta fromroom temperature to 400℃.
    (a) Dependence of photoluminescence (PL) on various annealingtemperatures for a-C:H thin films. The examples of the deconvolutionfor (b) as-deposited a-C:H thin films and (c) annealed films at100℃. (d) Reveals intensity changes ‘b’ and ‘a’ peak in (a) and its ratioin (a) as a function of Ta. (e) Reveals PL peak energy as a functionof Ta. (f ) Schematic of structural changes as a function of Ta fromroom temperature to 400℃.
(우)06579 서울시 서초구 반포대로 201(반포동)
Tel. 02-537-6389 | Fax. 02-590-0571 | 문의 : oak2014@korea.kr
Copyright(c) National Library of Korea. All rights reserved.