Olive flounder, Paralichthys olivaceus were exposed to waterborne Cu (control, 50, 80, 150, and 320 μg/L) for 30 days and then depurated for 20 days to investigate the effects of waterborne Cu exposure on growth, accumulation, and elimination. The weight-specific growth rate was significantly negatively related to waterborne Cu concentrations at 150 and 320 μg/L. The order of Cu accumulation in different tissues of exposed fish was liver>intestines>gills>kidneys>muscle, suggesting that the liver is more important than other tissues for the storage of Cu in olive flounder. The accumulation factor for the gills, intestines, liver, and muscle increased with increasing exposure time, and accumulation was negatively related to exposure concentration for the gills, kidneys, and muscle. Cu concentrations in the gills, intestines, and liver continuously decreased for 20 days of depuration. The fastest elimination rate occurred in the intestines at all exposure concentrations, and the order of Cu elimination in the different tissues was intestines>liver>gills.
Toxic metal pollutants are currently being released into the environment at increasingly high rates because of industrialization. Consequently, heavy metals such as copper (Cu) are having toxic effects on aquatic organisms. Cu is an essential metal for all organisms, including fish; it plays an important role in organism metabolism, and concentrations of this metal are well regulated (Cousins, 1985). However, Cu is one of the most toxic metals to fish, affecting various blood parameters (Nussey et al., 1995), growth parameters (Langston, 1990), enzyme activity (Roesijadi and Robinson, 1994), and reproduction (Horning and Nieheisel, 1979).
Fish absorb Cu from polluted environments, resulting in accumulation in their tissues and redistribution among tissues. Cu accumulation in different tissues varies depending on the source of uptake and whether Cu is waterborne or ingested as food. Whatever the exposure method, Cu accumulates substantially in gills, intestines, and mainly in the liver and kidneys (Giles, 1988; Mazon and Femandes, 1999; McGeer et al., 2000b). Fish are an important human food resource as well as crucial components of aquatic ecosystems; thus, assessing the effects of Cu on fish is vital from both an anthropogenic and ecological perspective. Bioaccumulation patterns of metals in fish tissues can serve as effective indicators of environmental metal contamination (Larsson et al., 1985). Moreover, tissue-specific accumulation of metals may be a key indicator of chronic exposure (Bergman and Dorward-King, 1997). Although the subchronic toxic effects of Cu on fish are well documented, studies have primarily focused on freshwater fish (Pelgrom et al., 1995; Marr et al., 1996; De Boeck et al., 1997; Mazon and Femandes, 1999; McGeer et al., 2000a), whereas few studies have examined the effects of Cu on marine fishes. Therefore, the kinetics of Cu accumulation in fish tissues are of great importance, particularly for marine fish.
The elimination of metals from the tissues of fish is affected by several factors, including time, temperature, interacting agents, fish age, fish metabolic activity, and the biological half-life of the metal (Larsson et al., 1985; Douben, 1989; Woo et al., 1993; Heath, 1995; Kargin, 1996; Nielsen and Andersen, 1996). Metal elimination studies are important in terms of fish health, as they help to determine the self-cleansing ability of contaminated organisms and to assess the biological half-life for various metallic contaminants.
The olive flounder,
>
Experimental fish and treatments
Juvenile olive flounder
>
Experimental design and setup
After 3 weeks in the acclimating tanks, randomly selected olive flounder were transferred to 12 50-L PVC exposure tanks (52×36×30 cm), with running seawater systems (flow=0.4 L/min) and continuous aeration. After transfer to the exposure tanks, the fish were acclimated to experimental conditions for 2 weeks. Cu stock solution was added as CuSO45H2O (Aldrich, St. Louis, MO, USA). The experimental concentrations of Cu were 0 (control), 50, 80, 150, and 320 μg/L. The experiment was designed to first expose the fish to Cu for 30 days and then transfer them into Cu-free seawater for another 20 days. To maintain a constant concentration of Cu in the experimental tanks, a diluted Cu stock solution was added constantly using a peristaltic pump (BVK C; Ismatec, Glattbrugg-Zurich, Switzerland). Seawater temperature was maintained at 18.0±0.2°C in a constant temperature room. All flounder were maintained and tested under a 12 h light (09-21 h)/12 h dark illumination cycle. Seawater quality was measured every 5 days during the experimental period, and the fish were fed 3% body weight per day.
>
Biological sampling and Cu analysis
The experimental fish were starved for 24 h prior to sampling to allow all food to be excreted. The gills, intestines, kidneys, liver, and muscle were sampled every 10 days for analysis of Cu concentrations. Eight fish were removed from each test concentration and the control. Body weight and total length were recorded for each individual, and the gills, intestines, kidneys, liver, and muscle were then sampled for Cu analysis.
Tissue samples were freeze-dried at -80°C and kept in a refrigerator until further analysis. Dry tissue was digested using 1:1 HNO3 (Suprapur grade, Merck), and samples were fumed to near dryness on a hot plate at 120°C overnight. After digestion, the residue was dissolved in 20 mL 0.2 N HNO3 and kept in a refrigerator until analysis of the trace metal. Cu concentrations of tissues were measured using an inductively coupled plasma-mass spectrometer (ICP-MS, DRC-e, Perkin-Elmer). The accuracy and precision of the analytical procedures were checked using certified reference material, DOLT-2 (dogfish liver), from the National Research Council of Canada (NRC). These reference materials were treated and measured using the same procedure as the samples, and results were in close analytical agreement with the certified values (certified: 25.8±1.1 μg/g; observed: 26.6±0.57 μg/g; recovery: 103.1%). To prevent contamination during experimental procedures, containers and experimental-ware were washed in a sequence of phosphate-free soap, soaked in 1:1 HNO3, and rinsed with distilled water. All procedures, including sample analyses, were carefully undertaken in a “100 class” clean room to reduce potential contamination. Cu concentrations in the tissues were expressed as μg/g dry weight. The accumulation factor (AF) is often used to compare the body burden of an organism with the degree of contamination in the water. The following equation was used in the present study: AF={[Me]exp?[Me]control}/[Me]water, where [Me]exp, [Me]control, and [Me]water are the metal concentrations in the experimental group, control group, and water, respectively. The elimination rate (%) is the percentage decrease in the initial value (after 30 days).
Growth parameters were calculated as follows: specific growth rate (SGR)=100×[{1n(end mass)?ln(start mass)}/time]; liver somatic index (LSI)=(liver weight/body weight)×100; condition factor (CF)=(weight×length?3 )×100. Data are expressed as means ±SEM . All statistical analyses were performed using the SPSS/PC+ statistical software package (SPSS Inc., Chicago, IL, USA). Prior to analysis, all data were tested for homogeneity of variances among groups using the Bartlett test. Comparisons of normalized data between control and treatment groups were performed using one-way analysis of variance (ANOVA), followed by Duncan’s multiple comparisons test of mean values if significant differences were found (
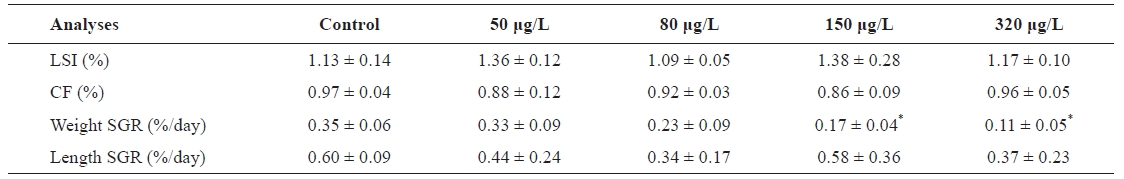
No mortality occurred during the subchronic Cu exposure experimental periods. No differences were observed in LSI and CF compared to the control (Table 1). Weight SGR of flounder exposed to Cu significantly differed from controls, and weight gain was significantly negatively related to waterborne concentrations of Cu at 150 and 320 μg/L. The weight SGRs of exposed flounder were 51.43% and 68.57% lower than controls at 150 and 320 μg/L Cu, respectively; although they were also lower at 50 and 80 μg/L, the differences were not significant. Length SGR decreased slightly, but not significantly, with Cu concentration. Cu concentration caused a gradual decline in growth rate compared to the control, although all fish continued to gain weight and length during the experiment. During the first 20 days, weight gain did not vary significantly within all Cu exposure treatments. At the end of the exposure period (30 days), exposure to Cu concentration as high as 320 μg/L caused significant reductions in weight gain compared to control fish. Although Cu exposure had ended, 6.18% and 8.15% reductions in weight gain (compared to controls) occurred at concentrations of 150 and 320 μg/L, respectively, 40 days into the experiment. At 50 days, the fish experienced 8.67% and 11.17% reductions in weight gain in the 150 and 320 μg/L Cu exposure groups, respectively. After 20 days of depuration, fish exposed to 80 μg/L Cu exhibited significantly lower weights than controls, but those exposed to 50 μg/L Cu did not significantly differ from controls.
[Table 1.] LSI CF and SGR of Paralichthys olivaceus exposed to different Cu concentrations

LSI CF and SGR of Paralichthys olivaceus exposed to different Cu concentrations
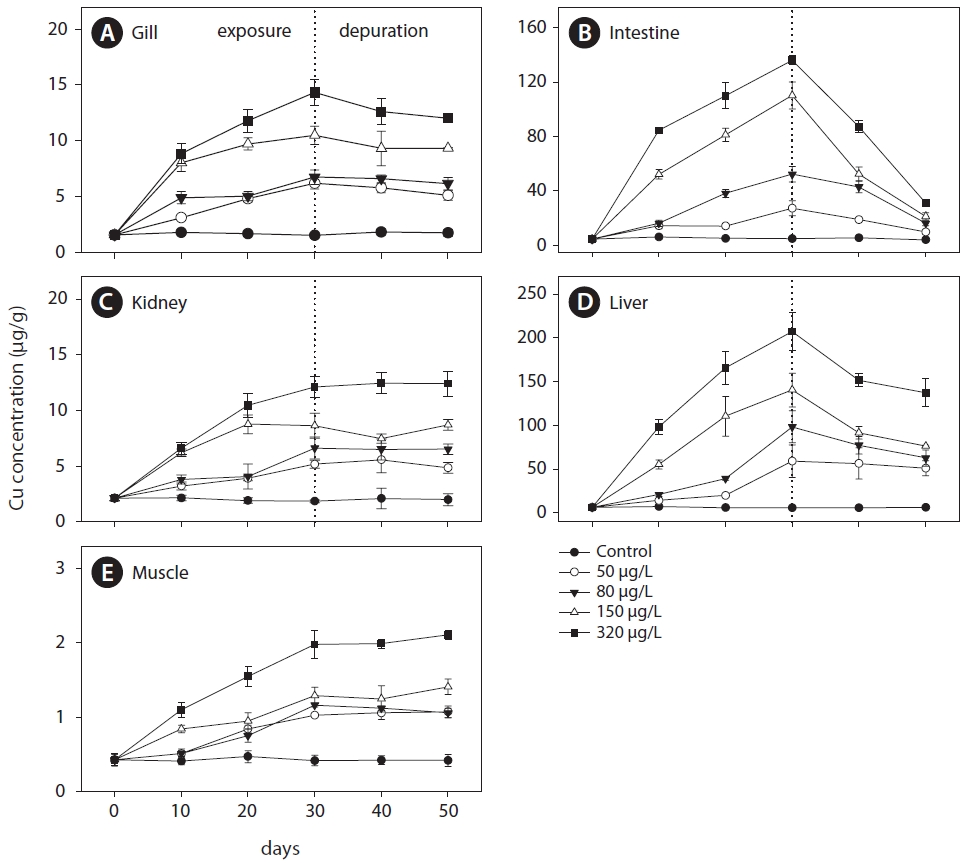
Cu accumulation was monitored during the 30-day exposure period in the gill, intestine, kidney, liver, and muscle tissues (Fig.1 ). Cu accumulation in these tissues increased with exposure period and concentration. For the flounder exposed to 320 μg/L Cu, the following linear relationships were observed:
Gill=0.41 days+2.92 (r2=0.93, P<0.05)
Intestine=4.20 days+20.76 (r2=0.91, P<0.05)
Kidney=0.34 days+2.74 (r2=0.97, P<0.05)
Liver=6.70 days+18.77 (r2=0.97, P<0.05)
Muscle=0.05 days+0.50 (r2=0.99, P < 0.05)
Gill Cu accumulation at all exposure concentrations was significantly elevated above that in the control group (P<0.05) (Fig.1 A). After exposure, Cu accumulation values were 6.20±0.51, 6.74±0.67, 10.49±0.84, and 14.34±1.77 μg/g at 50, 80, 150, and 320 μg/L, respectively; the values were approximately 4- to 10-fold higher than those of the controls. For the intestine, Cu accumulation was significantly higher than control values after 10 days of exposure (Fig.1 B). Although the accumulation profile was similar to that of the gill, accumulation in the intestine was about an order of magnitude higher than in the gill. Throughout the 30-day exposure, intestine Cu accumulations were 27.22±5.54, 52.44±5.79, 110.08±9.95, and 136.07±3.38 μg/g at 50, 80, 150, and 320 μg/L, respectively.
Cu accumulation in the kidney was about an order of magnitude lower than that in the intestine and liver, and accumulation increased significantly after 10 days in all exposure groups (Fig.1 C). Unlike the intestine, the accumulation profile in the kidney showed a gradual increase, similar to the gill profile. Accumulation in the liver significantly increased with both time (30-day exposure period) and concentration (Fig.1 D). During the first 10 days, Cu concentration increased sharply, reaching 98.12±8.54 μg/g (a 16-fold increase compared to the control) in the 320 μg/L Cu exposure group. Cu accumulation significantly increased after the first 10 days in the 150 and 320 μg/L exposure groups. Finally, after 30 days of exposure at 150 and 320 μg/L, concentrations in the liver reached
140.61±19.25 and 207.26±21.79 μg/g dry weight and were approximately 23 and 34 times higher, respectively, than in the control group. In contrast, accumulation in the liver exhibited gradual increases in the 50 and 80 μg/L exposure groups during the first 20 days of exposure. At the end of exposure, Cu concentrations were 59.33±18.49 (a 10-fold increase compared to controls) and 98.44±18.36 μg/g (16 times higher than controls) at 50 and 80 μg/L exposure, respectively.
Low accumulation was observed in muscle but it increased linearly in the 150 and 320 μg/L exposure groups (Fig.1 E). During the 30 days of exposure, Cu accumulation significantly increased in the 150 and 320 μg/L exposure groups compared to controls. In the 50 and 80 μg/L exposure groups, accumulation did not differ significantly from controls during the first 10 days but significantly increased after 20 days. After exposure, accumulation values in muscle were 1.03±0.01, 1.16±0.02, 1.29±0.11, and 1.98±0.19 μg/g at 50, 80, 150, and 320 μg/L exposure, respectively. After 30 days of exposure, the order of accumulation in tissues was liver>intestines>gills>kidneys>muscle.
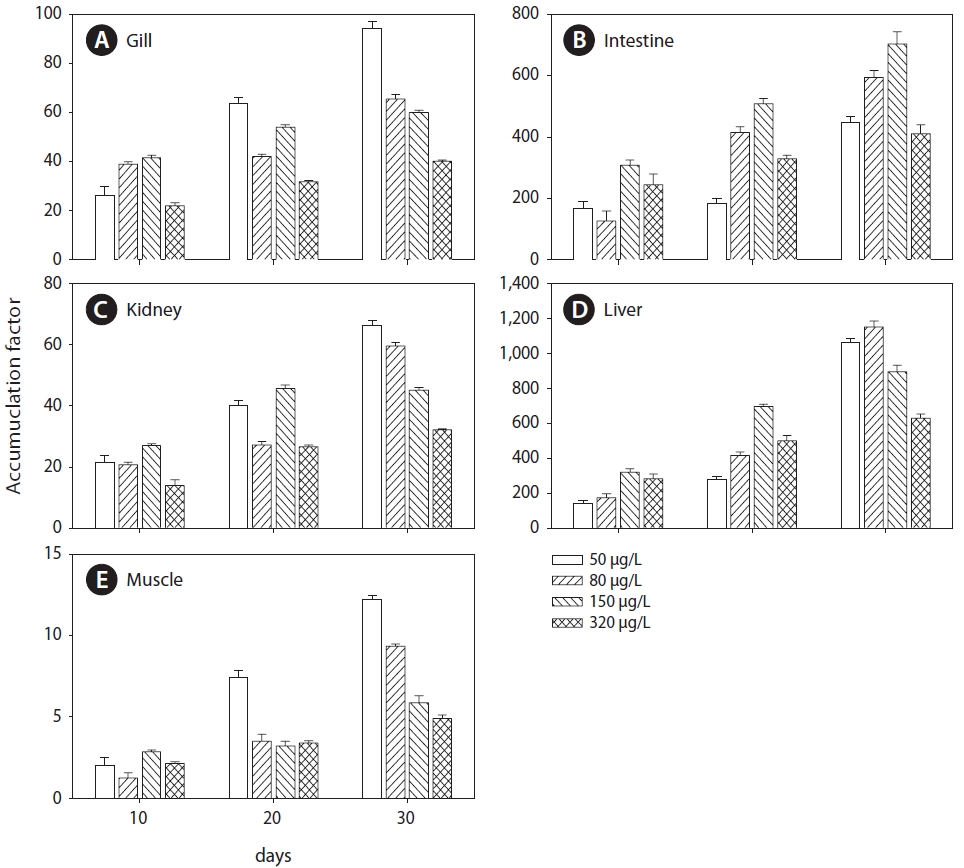
The AFs increased with exposure period in the gills, intestines, liver, and muscle, but not in the kidneys (Fig.2 ). At the end of exposure, an inverse relationship was observed between AF and exposure concentration in the gills, kidneys, and muscle. The AF in the liver and intestines increased with exposure period but not with exposure concentration.
Cu elimination in the tissues of
Cu concentration in the kidney did not vary significantly and remained constant after the end of dietary Cu exposure
(Fig.1 C). At the end of depuration, Cu concentration values were 4.85±0.48, 6.51±0.46, 8.69±0.49, and 12.39±1.15 μg/g at 50, 80, 150, and 320 μg/L, respectively, similar to those after 30 days. Cu elimination in the liver was about an order of magnitude lower than that in the intestines (Fig.1 D). After 20 days of depuration, the elimination rates were 45.55% in the fish exposed to 150 μg/L and 33.70% in those exposed to 320 μg/L.
In muscle tissue, Cu concentration slowly increased or remained constant (Fig.1 E) and did not vary significantly (
In this study, Cu exposure resulted in reductions in olive flounder growth rates, which were negatively related to concentrations of Cu exposure. Hansen et al. (2002) observed 20% and 33% reductions in growth rates in rainbow trout
Metal accumulation in tissues of aquatic animals depends on exposure concentration and period as well as other factors such as salinity, temperature, interacting agents, and metabolic activity of tissue (Ay et al., 1999). Moreover, metal accumulation in tissues of fish also depends on the rate of uptake, storeage,and elimination (Roesijadi and Robinson, 1994; Heath, 1995). Cu accumulation in the gills, intestines, kidneys, liver, and muscle of olive flounder increased with both exposure period and concentration after 30 days of exposure to waterborne Cu.
The gills of teleost fish play an important role in ion regulation, gas exchange, acid-base balance, and nitrogenous waste excretion, thus playing a key role at the interface of the fish and their environment. Because the branchial epithelium of teleost gills is a tissue where both active and passive exchange occurs, this tissue is also likely to be a site for heavy metal activity (Ay et al., 1999). The gills are assumed to be major sites of Cu uptake due to the large surface area and direct contact with the aquatic environment. However, Cu accumulation in the gills of olive flounder was lower than in the liver and intestines. Similar results have also been observed in rainbow trout (Miller et al., 1993; McGeer et al., 2000b), tilapia (Pelgrom et al., 1995), Senegales sole (Arellano et al., 1999), and sea bream (Wong et al., 1999). Mazon and Femandes (1999) suggested that these results were attributable to continuous Cu regulation, during which the gills absorb Cu and subsequently transfer it into the bloodstream. Although little information is available regarding this apparent discrepancy, the results for flounder may have been caused by redistribution and regulation of Cu transported in the blood through the intestines.
Cu accumulation in the intestine of olive flounder was approximately 9-11 times higher than in the kidney in the high-exposure group (320 μg/L). Wong et al. (1999) found that the highest concentration occurred in the intestines of sea bream (
In fish, the liver tends to concentrate metals and plays a major role in the detoxification and excretion of metals through induction by metal-binding proteins, such as metallothionein (MT). MT is closely related to heavy metal exposure, and metal taken up from the environment can be detoxified by binding to these proteins (Roesijadi and Robinson, 1994). As the present study has shown, Cu accumulation in the liver of flounder was approximately 23 and 34 times higher in the 150 and 320 μg/L Cu exposure groups, respectively, compared to the control diet group. The order of Cu accumulation in tissues was liver>intestine>gill>kidney>muscle. Mazon and Femandes (1999) reported that after exposure to 25 and 29 μg/L Cu, accumulation in the liver of piranha was progressive and significantly higher than in control fish. De Boeck et al. (1997) observed that Cu accumulation at the two highest Cu exposures (0.55 and 0.80 μM) occurred mainly in the liver tissue of common carp
Generally, the kidneys play a major role in the detoxification and excretion of toxins via the induction of metal-binding proteins such as MT (Roesijadi and Robinson, 1994), similar to the liver. Therefore, tissues such as the kidneys, which are major producers of MT, show high accumulation of Cu in fish (Pelgrom et al., 1995; Mazon and Femandes, 1999; McGeer et al., 2000b). However, Cu accumulation in the kidney of flounder was about an order of magnitude lower than in the intestine and liver. Freshwater teleosts incorporate dissolved metals through the gills and accumulate it mainly in the kidneys, whereas marine teleosts take in metal by drinking seawater and accumulate it mainly in the liver (Hawkins et al., 1980). Kidney function in marine teleosts differs from that of freshwater teleosts, i.e., freshwater teleosts produce a large volume (3.44-10.0 mL h?1 kg?1) of dilute urine, whereas marine teleosts produce very low (0.31 mL h?1 kg?1) amounts, about 5-10% of the drinking rate (Jobling, 1995). Although information regarding differences in kidney function across species is scarce, the kidney of the olive flounder is presumably a less important storage tissue for Cu than the liver, gill, and intestine. Moreover, the target tissues for Cu clearly vary strongly across species and habitats (e.g., seawater versus freshwater).
In this study, low Cu accumulation was observed in muscle but it increased linearly at Cu exposures of 150 and 320 μg/L. Similarly, several previous studies documented lower Cu accumulation in the muscle compared to other tissues (De Boeck et al., 1997; Ay et al., 1999; Mazon and Femandes, 1999; Wong et al., 1999). These results are consistent with the hypothesis that accumulation in muscle becomes important only when the maximum storage capacity of the liver has been reached (Lauren and McDonald, 1987).
The route of Cu elimination may include urinary, branchial, biliary, and fecal excretion, which are the principle Cu excretion routes in mammals (Gregus and Klaassen, 1986). In this study, Cu elimination in the tissues of flounder was time-dependent until the end of the depuration period, except for in kidney and muscle tissue. The order of the Cu elimination rate in the tissues of flounder during the depuration period was intestine>liver>gill. Muramoto (1983) observed that the sequence of increasing elimination rates in the tissues of carp
During the 20 days of depuration, Cu concentrations in the kidney increased and then remained constant. Harrison and Klaverkamp (1989) found that cadmium (Cd) elimination from the kidneys of rainbow trout