Fishing-gear systems consist of netting and ropes,which are flexible structures. The features of these systems are affected by various forces in ocean environments, and will change shape accordingly.This is why mathematical modeling of the fishing gear system is difficult. However, mathematical modeling of fishing-gear systems is essential to understand their movement for designing appropriate gear.
Several studies have described theoretical models for underwater flexible systems, including a fishinggear system. These models are mathematiccally interpreted with the aid of advanced formulation skills, numerical calculation methods, and computer systems (Geradin and Rixen, 1997; Bessonneau and Marichal, 1998; Lee and Cha, 2002; Takagi et al., 2002; Tsukrov et al., 2002; Lee et al., 2005, 2008). Some software tools have been developed for designing and simulating the dynamic movement of fishing-gear systems (Vincent, 2001; Lee et al., 2005; Vincent and Marichal, 2005). Software tools help predict the shape and motion of the gear quantitatively in relation to operational conditions and design parameters.
Fishing effort, as an index of fishing intensity, has been calculated using the number of gear deployed and tow duration (FAO, 1993). The definition of fishing effort and associated parameters varies and is open to interpretation. However, the true fishing effort exerted on a marine ecosystem is dependent on the fished volume of the gear in the water, which has a three-dimensional configuration (Mangel et al., 2010). The latest fishing techniques aimed at maxi-mizing fishing effort and catch performance have been achieved through improved gear design, but the method for evaluating fishing effort has not changed. We suggest that fishing effort should be evaluated differently according to the size of the fished space of the gear, such as the swept volume for towed gear and the surrounding volume for purse-seine gear. Therefore, a suitable method to accurately estimate the fishing effort of fishing gear is required that considers its working space.
The swept or surrounding volume of fishing gear,one of the most important factors influencing catch size, changes with the size and structure of the gear and the method of operation. Using simulation tools, it is possible to analyze the fished space quantitatively, considering the structure of the fishing gear and the operational conditions during fishing.
The purpose of this study was to present an evaluation method for fished space based on a mathematical analysis using simulation tools for trawl and purse-seine fisheries, which are representtative fishing methods in Korea. We first describe a generalized modeling method that simulates dynamic movement and fishing-gear shape. This model is then applied to simulate trawl and purse seine gear to quantitatively calculate their shapes. We then analyze the fished space for the trawl and purse seine fisheries in Korea. Finally, we discuss the definition of fishing effort, incorporating the concept of fished space for quantitative fishery resource surveys.
>
Mathematical fishing-gear model
The theoretical model used to mathematically calculate the movement of fishing gear is the massspring model (Lee, 2002). It is assumed that elements constituting the gear consist of a physical system divided into mass points of finite number, connected with an elastic rope. Additional rigging parts, such as sinkers and buoys, are assumed to be mass points.The mesh number of the actual net is approximated as a small number of mass points to allow for a rapid calculation. The mathematical calculation method has been described in detail in previous studies (Lee et al., 2005) and is summarized here. The motion equation for a fishing-gear system is represented as
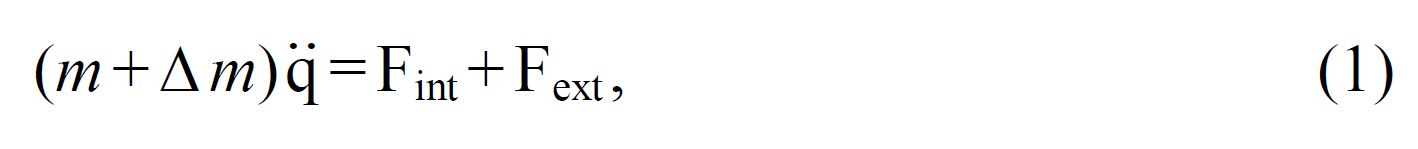
where
The added mass of a mass point is given by the following:
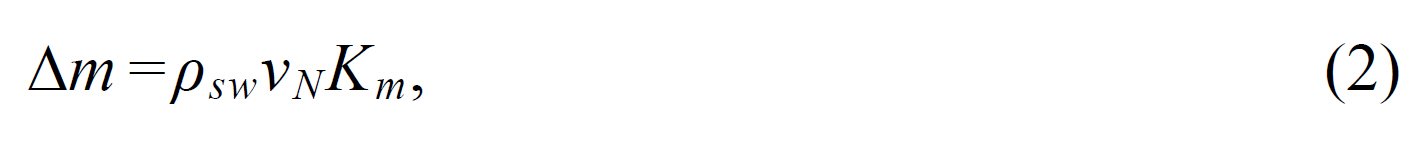
where
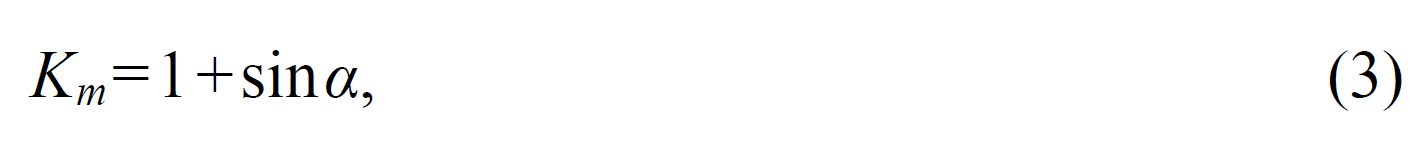
where α is the angle of attack.
The internal force is the force that is applied to the lines connecting the mass points, and because the lines are assumed to be a spring in this study, it is the force from the elongation of the spring. The internal force applied to each mass point is
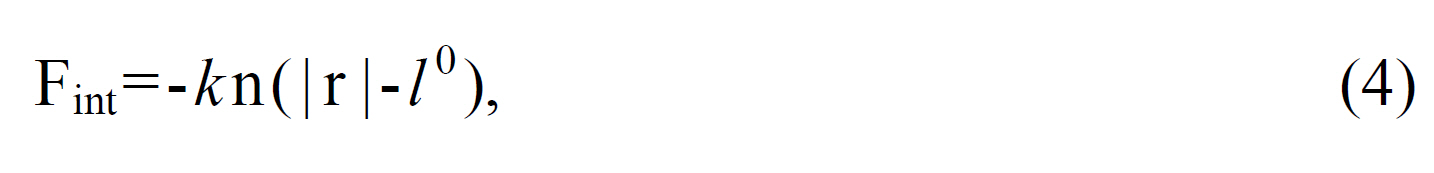
where
where
The external force, Fext, is the force that is applied to each mass point from the outside, and it consists of drag, FD, lift force, FL, buoyancy, and sinking force, FR:
Drag and lift forces are described as follows:
where
where
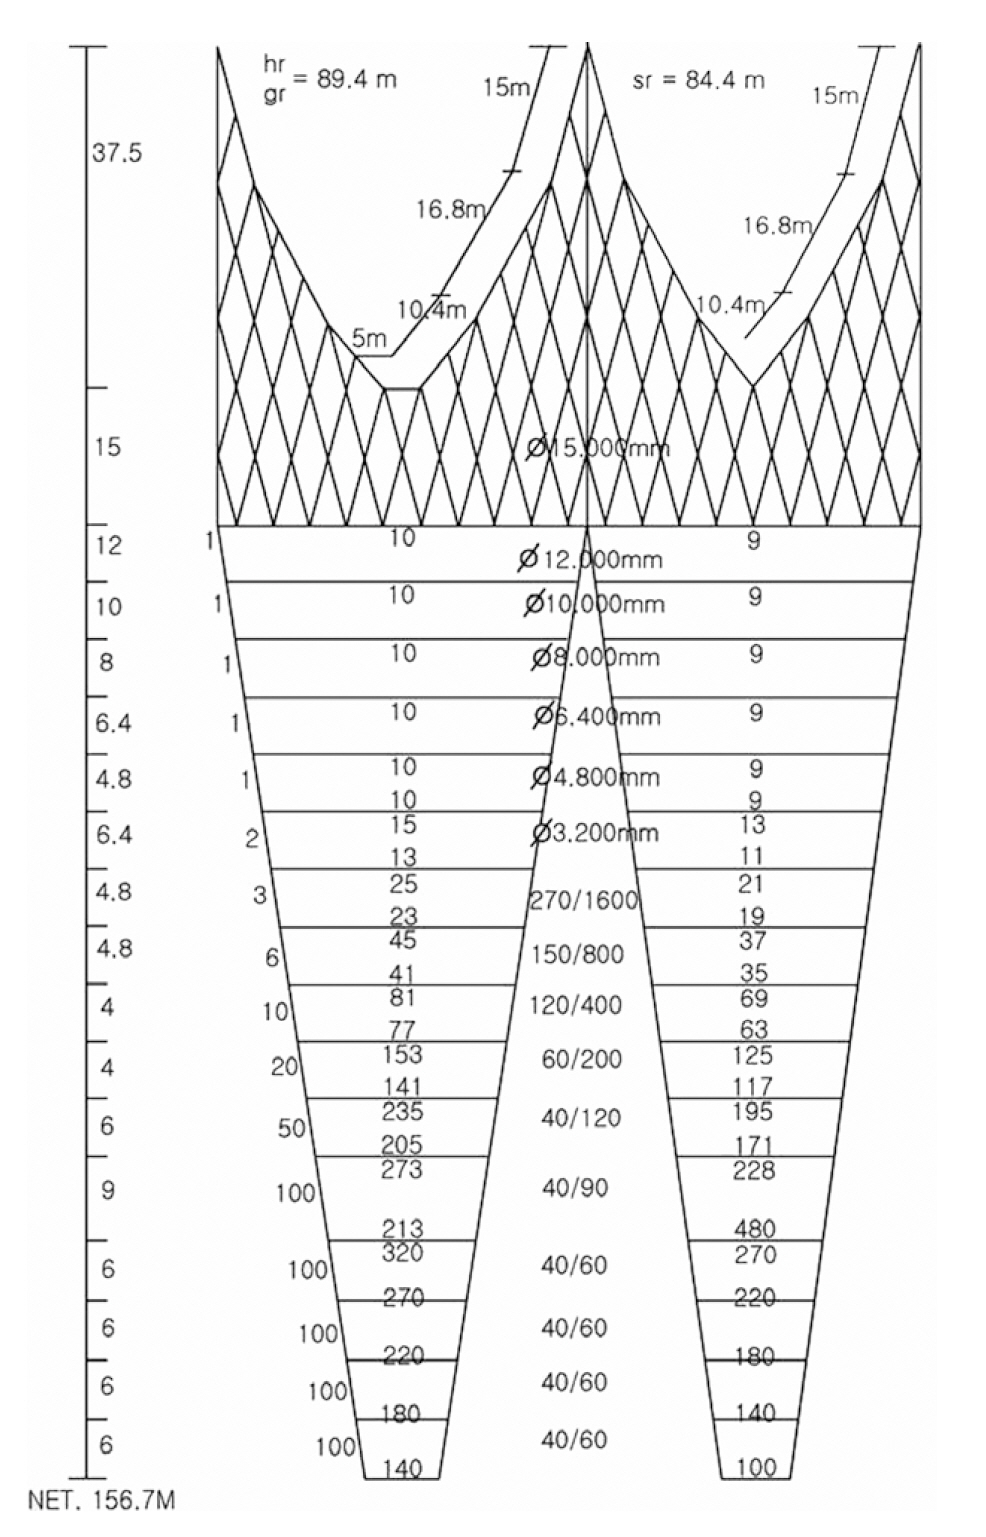
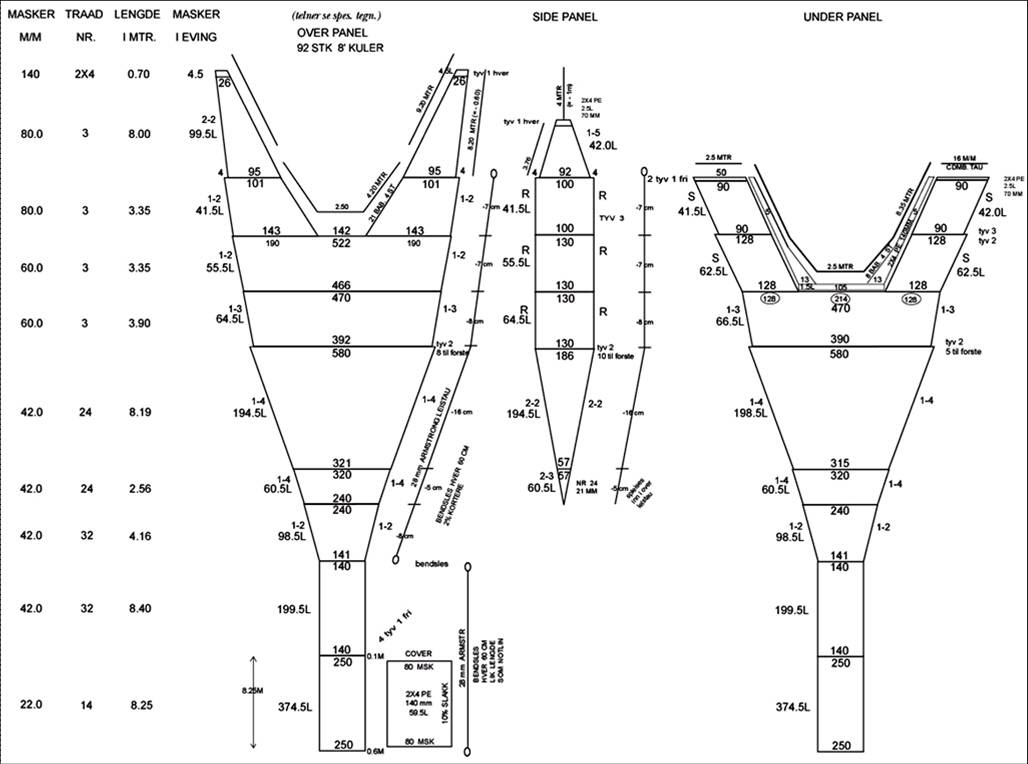
The midwater trawl, the bottom trawl, and the purse seine were the three types of large-scale commercial fishing gear surveyed. For the midwatertrawl simulation, the large-scale trawler was 139 t and 1,300 hp, and the net was a four-seam large-mesh pelagic gear (Fig. 1). The fishing season was usually from July to April of the following year. The number
of shootings was about three times per day, and the towing speed was 3-3.5 knots. The average tow duration was about 4 h.
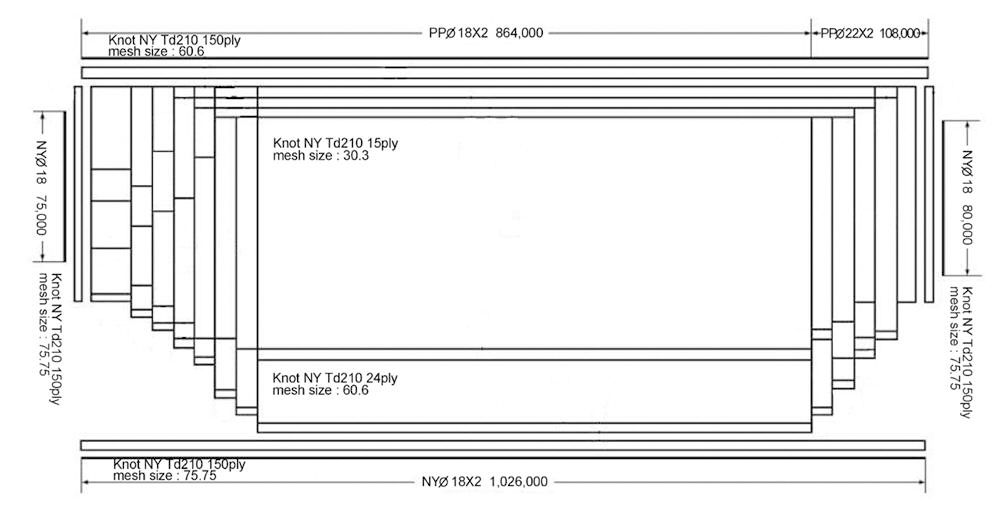
For the bottom-trawl simulation, the trawler was 100 t and 600 hp, and the fishing gear is shown in Fig.2. Bottom trawls are used year round except from May to June when repairs to the boat and the fishing gear are made. One cruise takes approximately 10 days. The number of shootings was five times per day,and the towing speed was usually 2-3 knots, with a tow duration of about 3 h.
The large offshore purse seiner was 129 t and 1,600 hp and used gear as shown in Fig. 3. The fishing season was year round, and one trip was approximately 25 days except during the full moon period. The number of shooting was 2-3 times per day. The shooting speed was 10-12 knots.
To precisely calculate the fished space, the validity of the mathematical model should be verified by comparing numerical solutions derived from the mathematical model with the results of full-scale experimental models, as shown by Lee and Cha(2002) and Kim et al. (2005). Then, direct measurements using acoustic trawl-instrumentation equipment can be replaced by the computation method. The reliability of the simulation software adopted in this research has been validated by sea trials for the trawl (Lee and Cha, 2002) and purse-seine (Kim et al., 2005) gear systems.
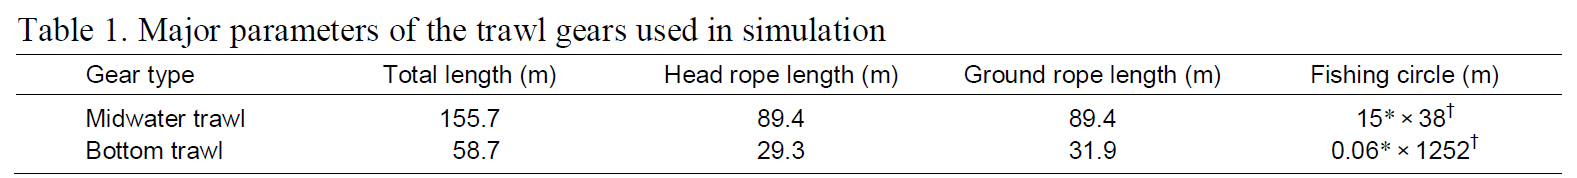
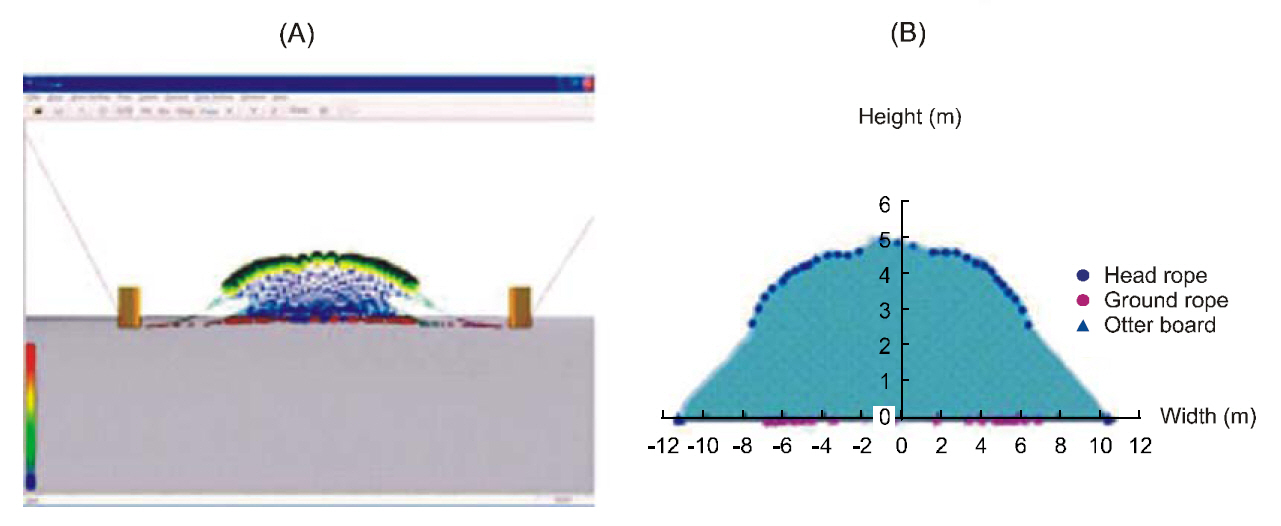
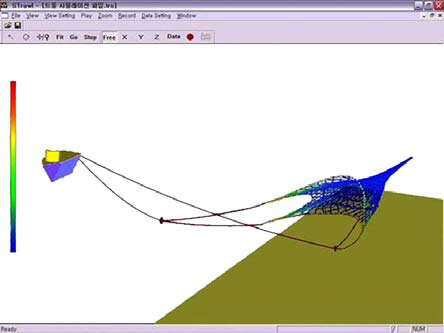
The swept volume of towing gear was calculated as the product of the net mouth area and the distance fished. The trawl-gear design and simulation tool were used to calculate swept volume following the method of Lee et al. (2005). Fig. 4 shows the underwater shape of the midwater-trawl gear as simulated on a computer. Table 1 shows the important parameters for simulating midwater- and bottom-trawl gear.
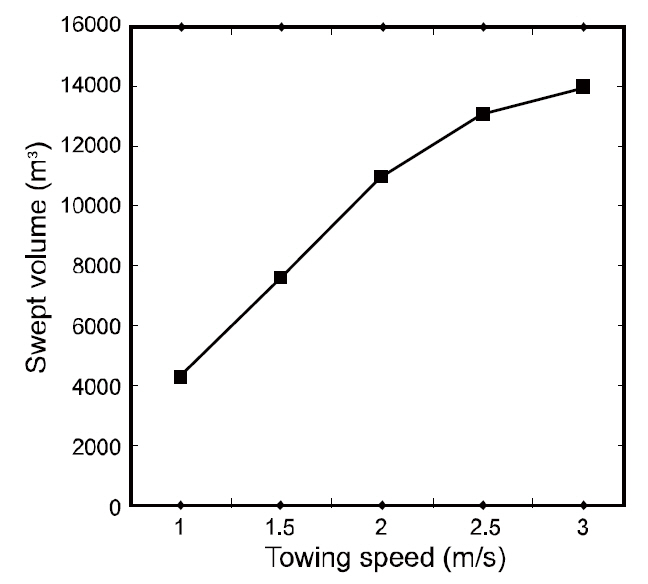
The swept volume of towed fishing gear was calculated based on the area of the net mouth, fishing time, and towing speed. As shown in Fig. 5, swept volume for a trawl net (
[Table 1.] Major parameters of the trawl gears used in simulation

Major parameters of the trawl gears used in simulation
where
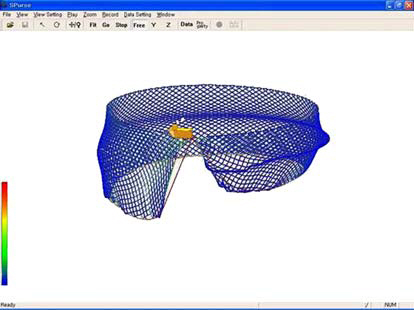
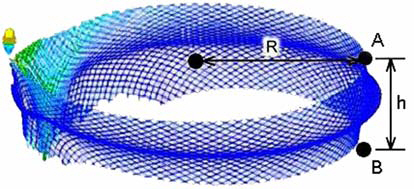
Fig. 6 shows the simulated purse-seine gear used in this investigation. Surrounding volume for a purse seine was calculated based on the encircling area surrounded by the float line and the depth of the sinker line. A numerical simulation on a computer was required for a more precise calculation because the surrounding volume of a purse seine differs with the length of the float line, the depth of the net, and the oceanic conditions during fishing (Kim et al., 2005). As shown in Fig. 7, surrounding volume can be described as:
where R is the radius of the circle formed by the float line after shooting, and
[Table 2.] Net-height and net-width of the mid-water trawl in relation to the towing speeds
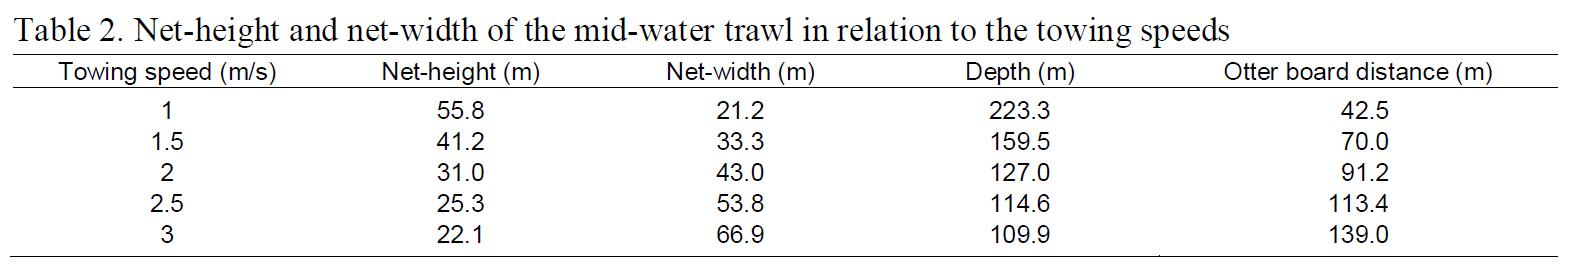
Net-height and net-width of the mid-water trawl in relation to the towing speeds
simulation was measured at the middle part of the net between A and B in Fig. 7.
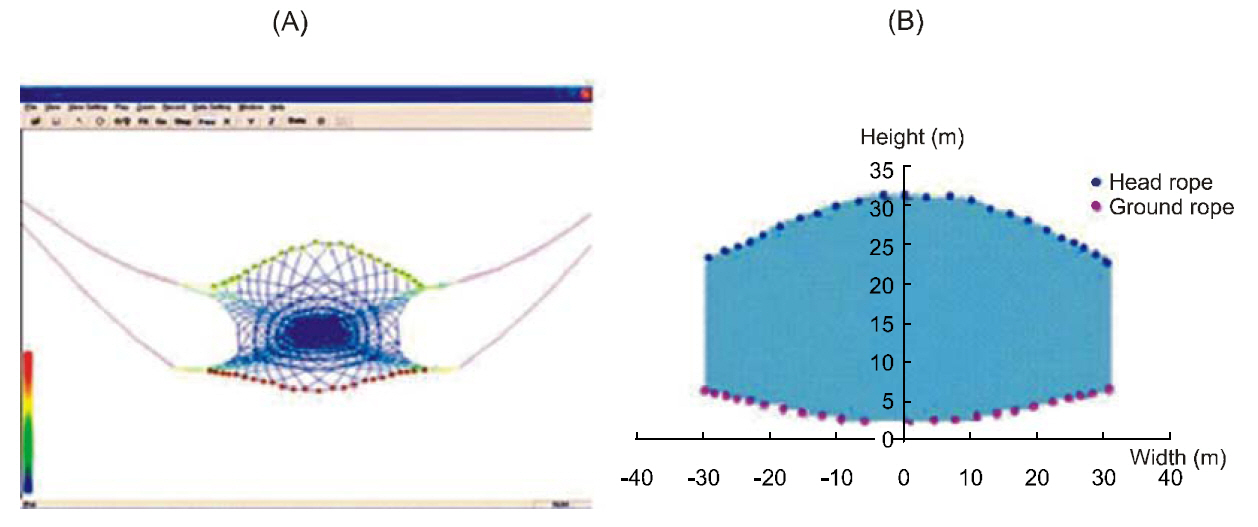
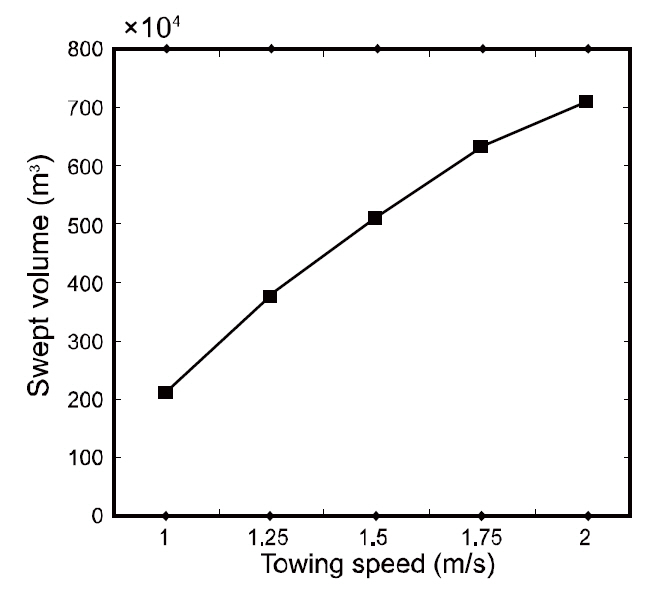
The shape of the net mouth for a midwater trawl is almost oval. In this study, the herding effect by the bridles and trawl doors was not considered (Somerton,2004). Fig. 8 shows the position and coordinates of the head and ground ropes during a midwater-trawl simulation. Table 2 shows the geometry of the net mouth, and Table 3 shows the swept volume per day in relation to the towing speed of a midwater trawl.The net mouth area was the largest when towing speed was 2 m/s. The swept volume increased as speed increased, but the rate of increase was reduced when towing speed exceeded 2.25 m/s (Fig. 9).
The swept volume of a bottom trawl is the product of the net mouth area and the distance of movement of the fishing gear during towing. In the case of a bottom trawl, mud in the seabed can be stirred up by the otter boards and ground ropes. The swept area of the net for a bottom trawl includes the otter boards and the bridle wires because they herd fish (Foster et al., 1981; Fuwa, 1989; Winger et al., 2004).
The positions and coordinates of the head and ground ropes as well as the otter boards when simulating the shape of the fishing gear are shown
[Table 3.] Swept area and volume per day of the midwater trawl in relation to the towing speeds
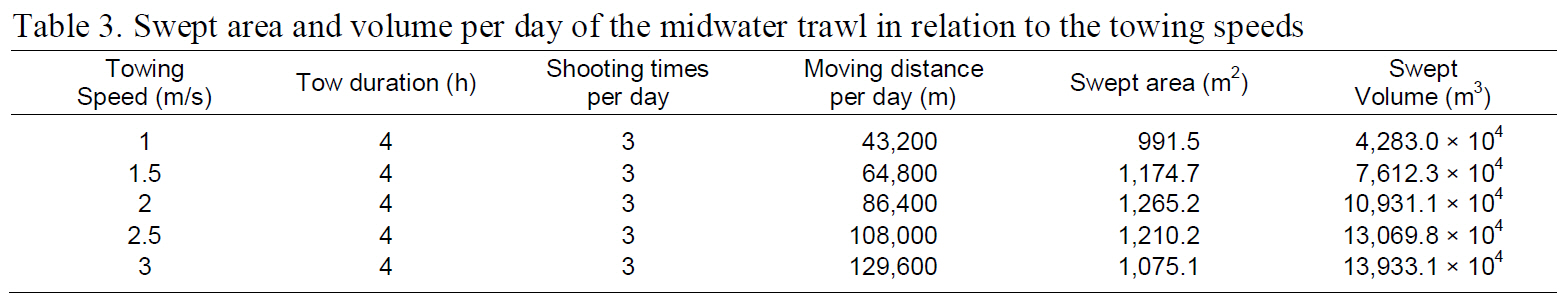
Swept area and volume per day of the midwater trawl in relation to the towing speeds
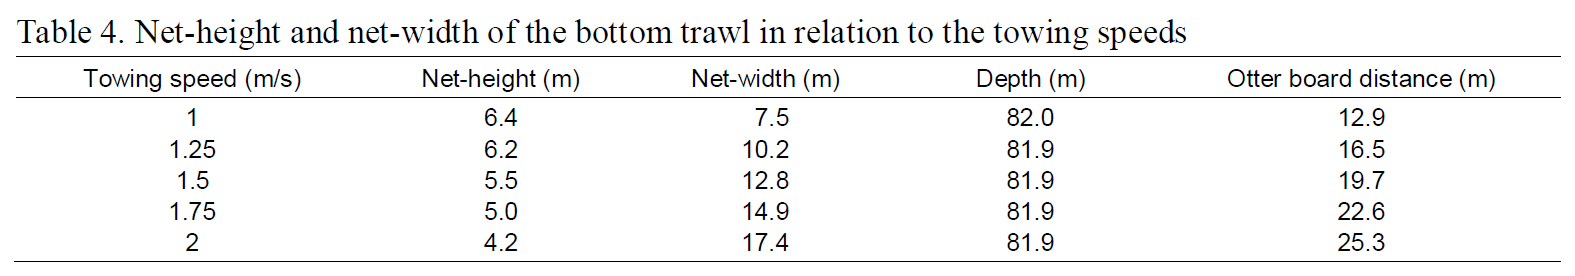
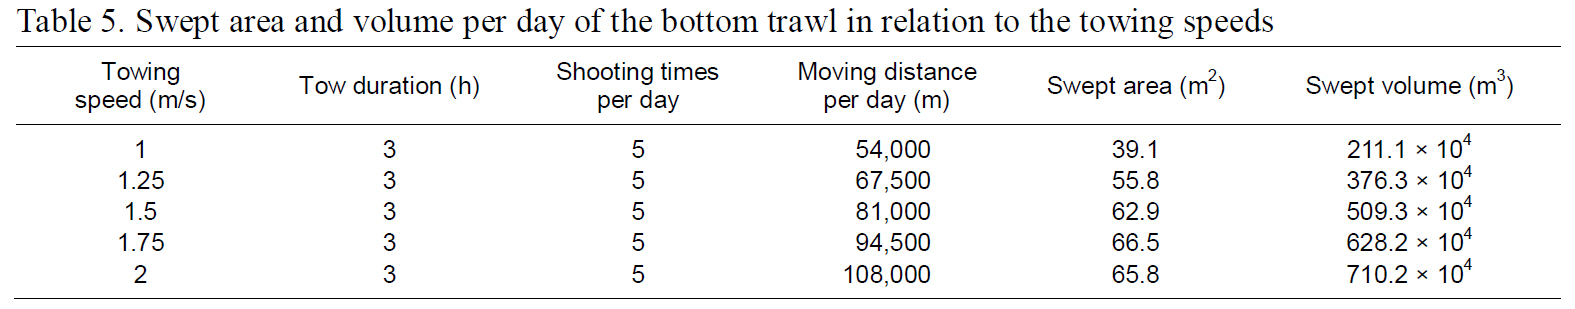
(Fig. 10). Table 4 shows the geometry of the net mouth, and Table 5 shows the swept volume per day in relation to the towing speed of a bottom trawl. In the case of a bottom trawl, the swept area of the net was largest when towing speed was 1.75 m/s. The swept volume increased with towing speed, but the rate of increase was reduced when towing speed exceeded 1.75 m/s (Fig. 11).
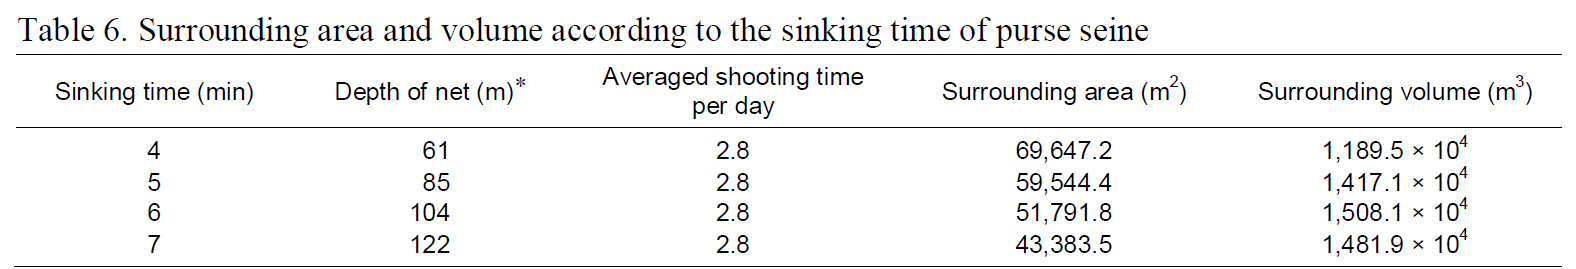
The surrounding volume of the purse-seine gear was the product of the area of the circle formed by the float line and net depth. The encircling area, which is determined by the float line, can be calculated using numerical integration because the float line coordinates can be obtained through a computer simulation (see Fig. 6 or 7). The depth of the net in relation to sinking time is also shown in a simulation.Thus, the surrounding volume can be calculated based on these data. Table 6 shows the surrounding area of the float line, the surrounding volume, and the depth of the net in the water column in relation to time. Although the surrounding area was reduced as time progressed, the surrounding volume increased due to an increase in fishing-gear depth.
Fished space per day for the midwater trawl,bottom trawl, and purse seine under general fishing conditions were compared. The towing speed of the midwater trawl was 1.75 m/s, whereas that of the bottom trawl was 1.5 m/s. The sinking time for the purse seine was 6 min. The midwater trawl had the largest swept and encircling volume at 9,222.8×104 m3, the purse seine had a volume of 1,508.1×104 m3, and the bottom trawl had the smallest volume at 509.3×10⁴ m3. These volumes are not proportional to catch size, because each gear type has different target species, working depths, and catching mechanisms.
[Table 4.] Net-height and net-width of the bottom trawl in relation to the towing speeds

Net-height and net-width of the bottom trawl in relation to the towing speeds
[Table 5.] Swept area and volume per day of the bottom trawl in relation to the towing speeds

Swept area and volume per day of the bottom trawl in relation to the towing speeds
Fishing effort is a useful and important parameter when evaluating fishing intensity and assessing resources. Fishing effort has been calculated based on the number of gear deployed or hours fished for active fishing gear, or the number and length of fishing gear for passive fishing gear. However,fishing gear has been continually improved to increase catch and to reduce bycatch. If examined by the size of the working space, as analyzed in this study, the swept volume of the towed fishing gear used today has increased by a factor of ten during the last 30 years, and the surrounding volume of the surrounding nets has also increased by several times compared with that of nets used 30 years ago (National Fisheries Research and Development Institute, 1970).
The size of the swept volume analyzed here was a key factor affecting catch performance. The latest fishing gear exerts a much greater catch pressure on the ecosystem compared with past gear. Therefore,fishing intensity may be underestimated if the previous fishing-effort index is used today, and errors would be unavoidable if it is used for resource assessment. However, improving and developing fishing gear aimed at higher catch performance will continue, so these kinds of errors will continue to increase during the evaluation process.
Although the use of indices such as swept and surrounding volumes for fishing effort are more representative, the problem becomes how to calculate precise volumes. Of course, the use of acoustic gear instrumentation makes it possible to determine the depth and distance of important fishing-gear parts.Swept volume can be estimated using a rudimentary assumption about net mouth shape, but the direct measurement method provides data only about the actually operating gear. However, the simulation method provides correct movement data for fishing gear without their being in operation. Furthermore,the tool can simulate gear performance on different fishing grounds and under the influence of different oceanic factors, as well as considering different modifications to the structure and material composition of the gear. As a result, the simulation method is a more convenient and economical way to calculate and assess fishing effort.
Fishing gear with fixed wing spreads or doors spread has generally been used in resource surveys because the swept area is easy to interpret, but such gear is difficult to use in precise resource surveys.
[Table 6.] Surrounding area and volume according to the sinking time of purse seine

Surrounding area and volume according to the sinking time of purse seine
In contrast, the precise swept volume of fishing gear is rarely used because it is difficult to estimate the size of a flexible entrance. However, if recent computation methods are utilized, the swept volume of fishing gear with a flexible entrance can be determined easily. Thus, swept volume can be used in resource-sampling surveys. If the latest simulation tools are used, the underwater configuration for any fishing gear can be calculated precisely, and fixed wing or door spread when sampling fishing-gear configurations is no longer required. Equation 11 is not valid when the float line of a purse seine does not create a circle during actual fishing. Therefore, this equation is applied after finishing the shooting process. Calculating the encircling area can also be overcome using the latest simulation tool. We can design and examine the performance of new sampling-gear systems without the constraints on shape or structure of gear associated with experimental sea trials.
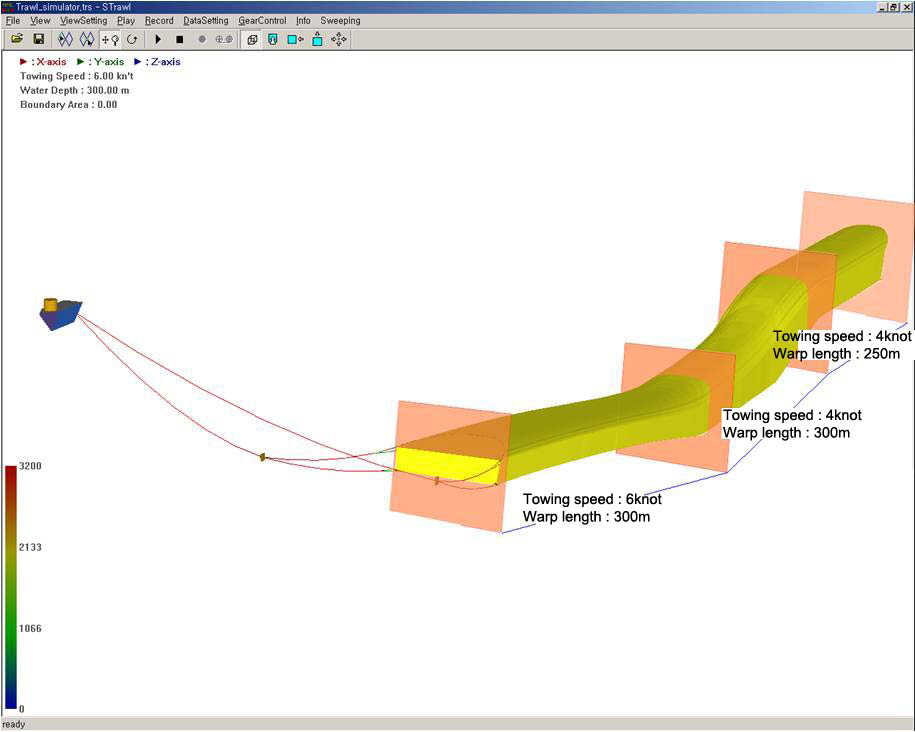
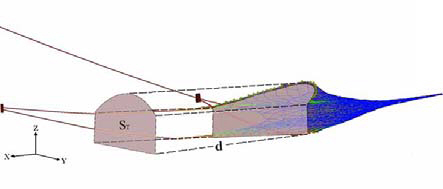
Fig. 12 is a three-dimensional picture showing the swept volume calculated using a simulation tool. Even in cases in which the warp length is changed or the towing speed is altered, the towing path, depth of the gear, and swept volume can be calculated precisely. A more precise approach to ecosystem modeling can be realized if the acoustic images detecting fish schools are integrated.