Ichthyoplankton has been investigated in estuaries or bays because these areas are easily influenced by human activity (i.e., pollution) (Lasker, 1987). In Korea, ichthyoplankton has been surveyed at various sites, including Jinhae Bay (Yoo et al., 1992), Yoja Bay (Yoo et al., 1993), Kwangyang Bay (Yoo and Cha, 1988; Cha and Park, 1994), Asan Bay (Kim et al., 1994), Sunchon Bay (Han et al., 2001), the Youngsan River estuary (Kim et al., 2003), and Yeongil Bay (Han et al., 2003). All of these studies focused on the role of bays as spawning or nursery grounds for fishes.
Yeoja Bay is characterized by its shallow water(average depth ~5.4-m) and narrow entrance,resulting in poor water exchange between areas inside and outside of the bay (Yoo et al., 1993; Kim et al.,2009). In contrast, Gamak Bay is characterized by slightly deeper water (average depth ~6.8-9 m) and wide entrance, resulting in three different water masses (An et al., 2009). Thus, although these two neighboring bays are close to one another, they have some differences in topographic and oceanographic conditions. In a recent study, Kim et al. (2009) used dragnets to compare the community structure of young fish between the eelgrass beds in Yeoja Bay and those in Gamak Bay. The results showed no differences in community structure, but slight differences in the abundance and growth rate of
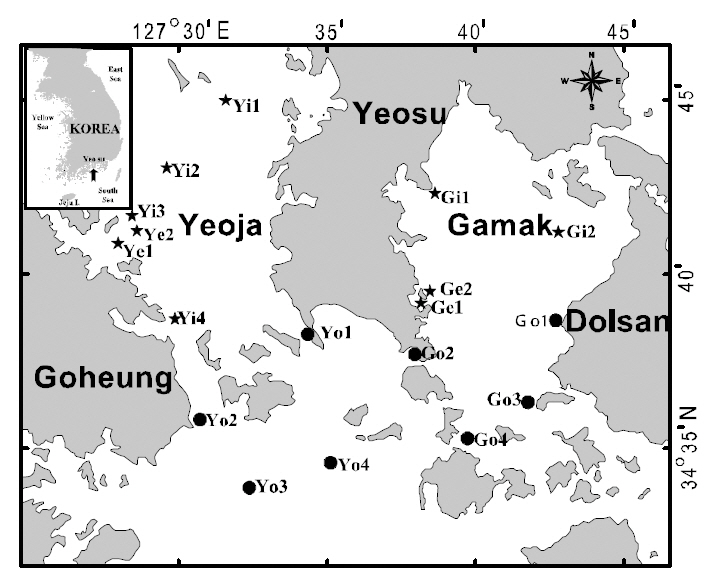
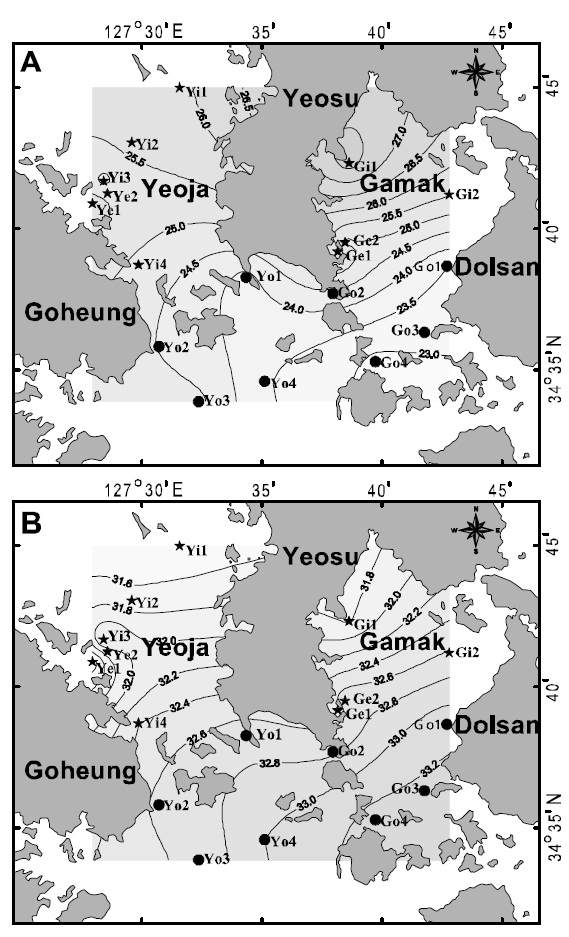
Water temperature, salinity, pH, and dissolved oxygen (DO) were measured and ichthyoplankton was collected by horizontal hauls using an RN80 net(diameter of net mouth 80 cm, mesh size 330 ㎛) for 10 min once a month between January and December 2007 at 18 stations in the Yeoja and Gamak bays of Yeosu, in the South Sea of Korea (Fig. 1). The locations of stations were determined by the method of Margalef (1978). The volume of water filtered by the net was measured by a flow meter (Hydro Co.,USA) attached at the mouth of the net. Collected samples were fixed in 5% neutral formalin on board the research ship before being transferred to the laboratory for sorting, species identification, and measurement. Species were identified according to Okiyama (1988). We classified the stations into four areas: inside Yeoja Bay (Yi1, Yi2, Yi3, Yi4, Ye1, Ye2),outside Yeoja Bay (Yo1, Yo2, Yo3, Yo4), inside Gamak Bay (Gi1, Gi2, Ge1, Ge2), and outside Gamak Bay (Go1, Go2, Go3, Go4) to better understand the distribution characteristics of the fish larvae. Of these sampling sites, Ye1-Ye2 and Ge1-Ge2 are located in eelgrass beds inside Yeoja Bay and Gamak Bay, respectively
On the basis of the number of larval fish caught each month, a species diversity index (H′; Shannon and Weaver, 1948) was calculated, and a dendrogram was constructed using the unweighted pair group with arithmetic mean (UPGMA) method after the Bray-Curtis similarity was calculated for cluster analysis(Zar, 1999). For the cluster analysis, species contribution to the grouping was evaluated according to SIMPER analysis. All statistical analyses were performed using PRIMER ver. 5.0.
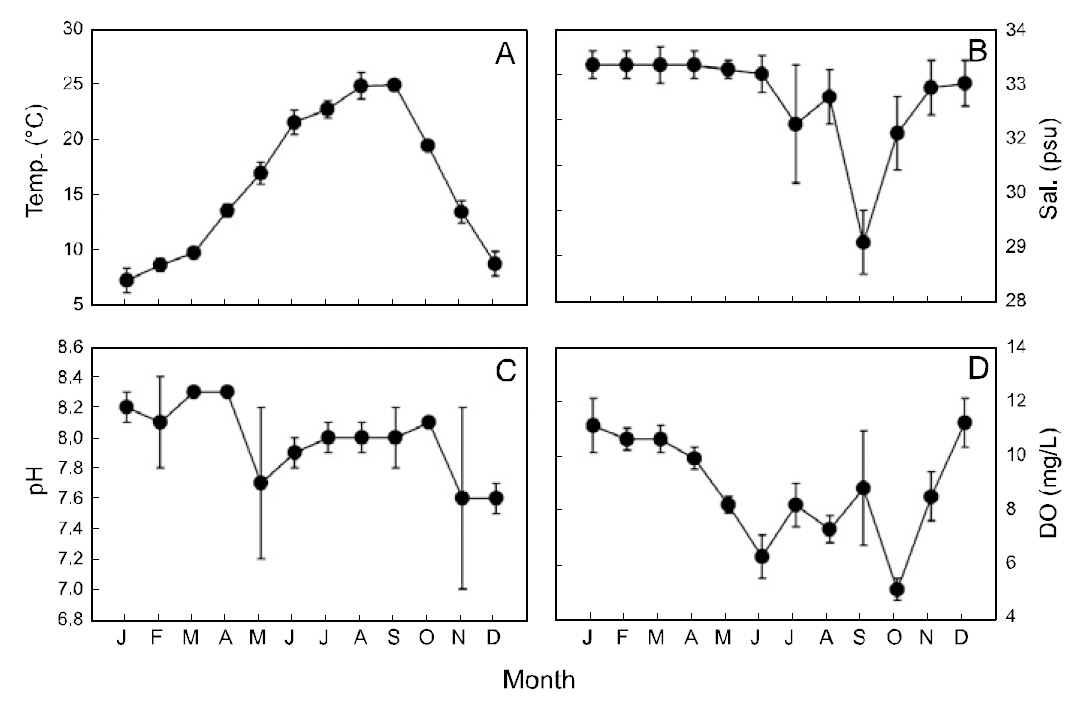
Sea surface temperature (SST) in the study area ranged from 7.2-24.9°C (mean±SD: 15.9±0.8°C)and was lowest in January and highest in September(Fig. 2A). The sea surface salinity was 29.3-33.2-psu(mean±SD: 32.5±0.5-psu), with lowest values in September and highest values in January-April (Fig.2B). Sea surface pH was 7.6-8.3 (mean±SD: 8.0±0.2) and was lowest in November-December (Fig.2C). Sea surface DO ranged from 5.1-11.2-mg/L(mean ± SD: 8.8±0.8-mg/L), with lowest values in October and highest values in December (Fig. 2D).
>
Larval fish species composition and distribution
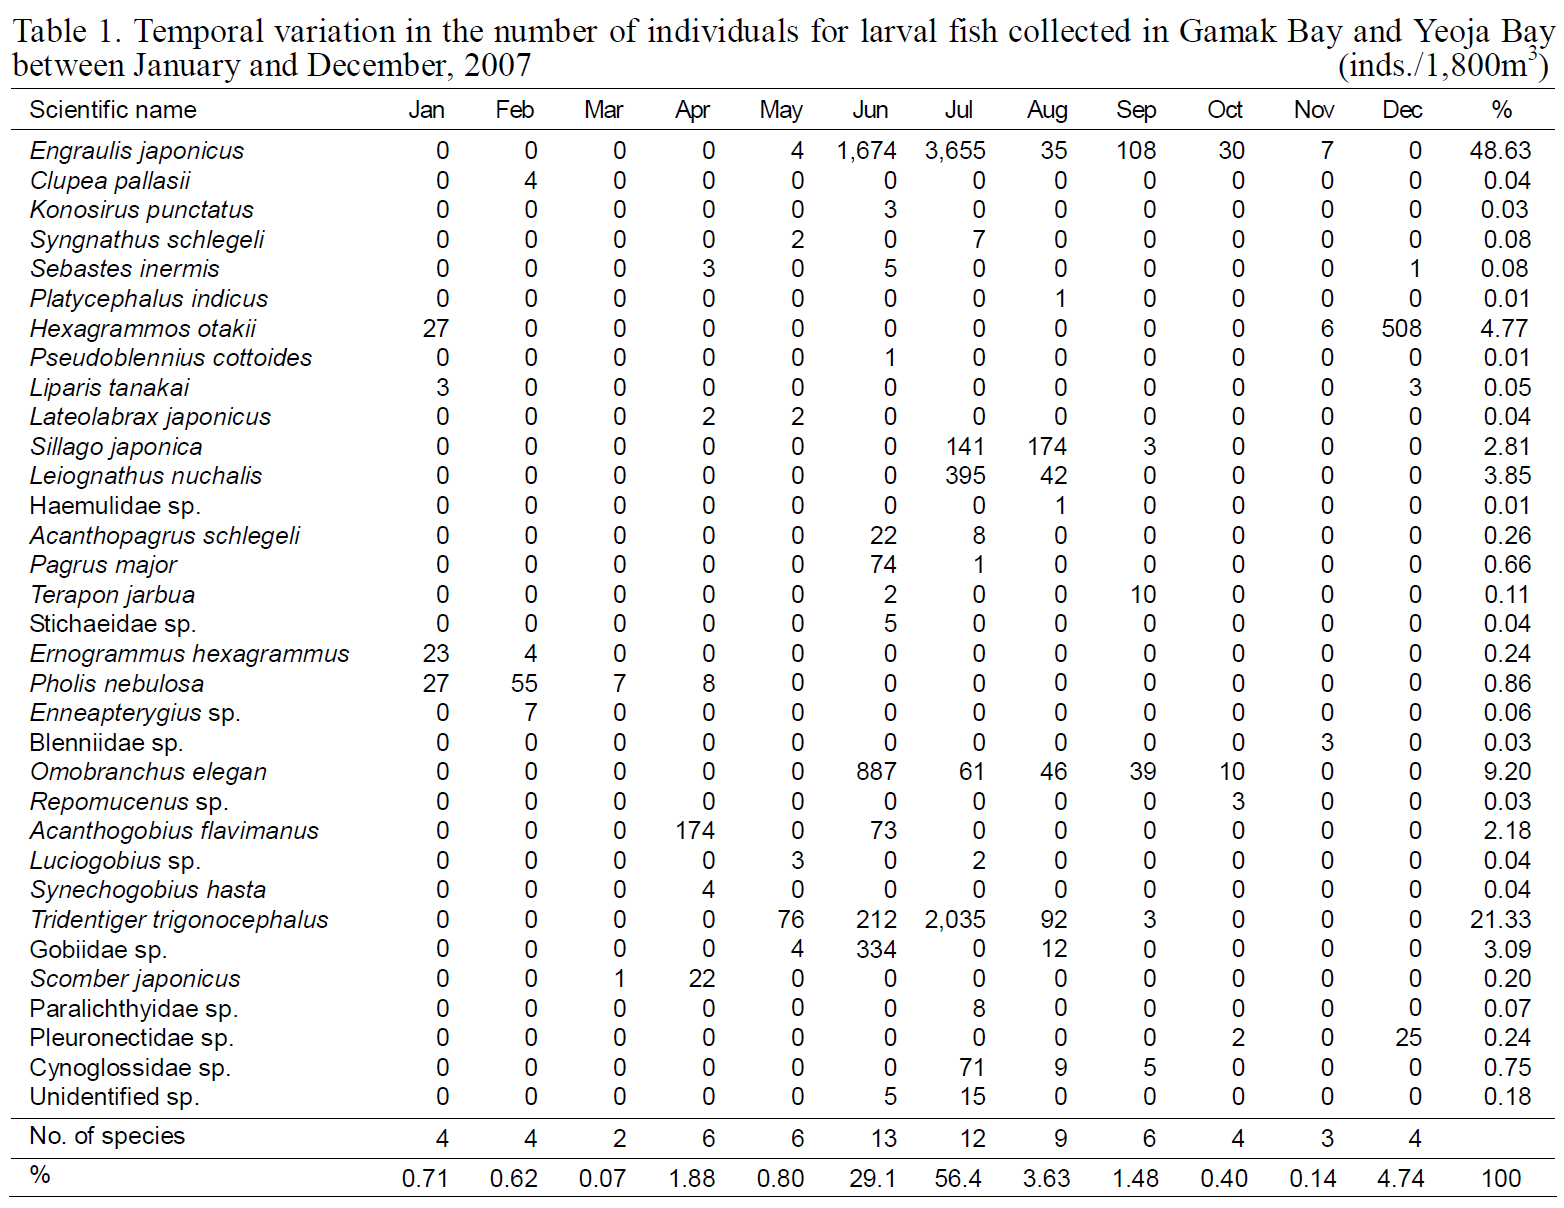
Fish larvae were classified into four orders, 24 families, and 33 species; 22 species were identified to the species level. Of these,
>
Relationship between larval fish occurrence and SST
Samples collected during June and November 2007 contained 7-3,655

Temporal variation in the number of individuals for larval fish collected in Gamak Bay and Yeoja Bay between January and December 2007
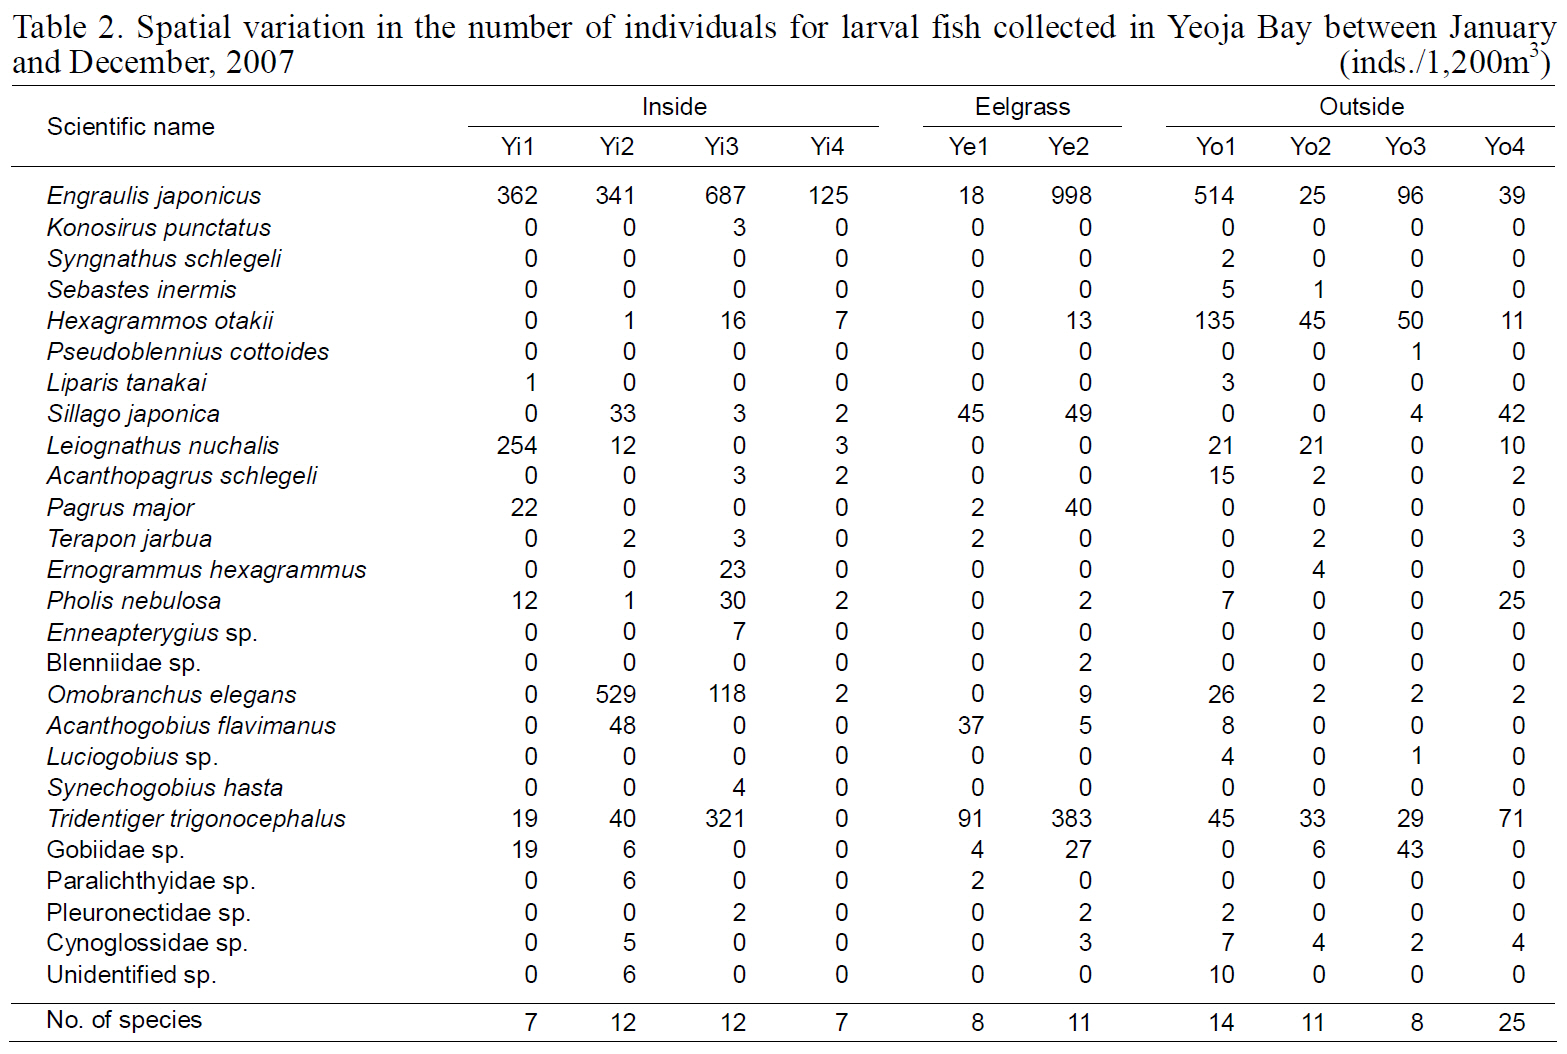
Spatial variation in the number of individuals for larval fish collected in Yeoja Bay between January and December 2007
SSTs of 20.3-23.3°C. There were 6-508 individuals/100 m3 of
>
Diversity and community structure
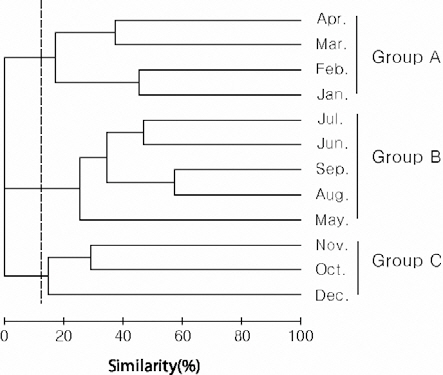
Species diversity ranged from 0.24-1.60 (0.92± 0.39) and was lowest in December and highest in August. Cluster analysis based on the number of individuals collected in each month yielded three groups: group A (January-April), group B (May-September), and group C (October-December) (Fig.3). In group A, the contribution of
This study compared larval fish compositions in Yeoja Bay and Gamak Bay with the compositions of young fish previously reported by Kim et al. (2009)to further clarify the function of bays including

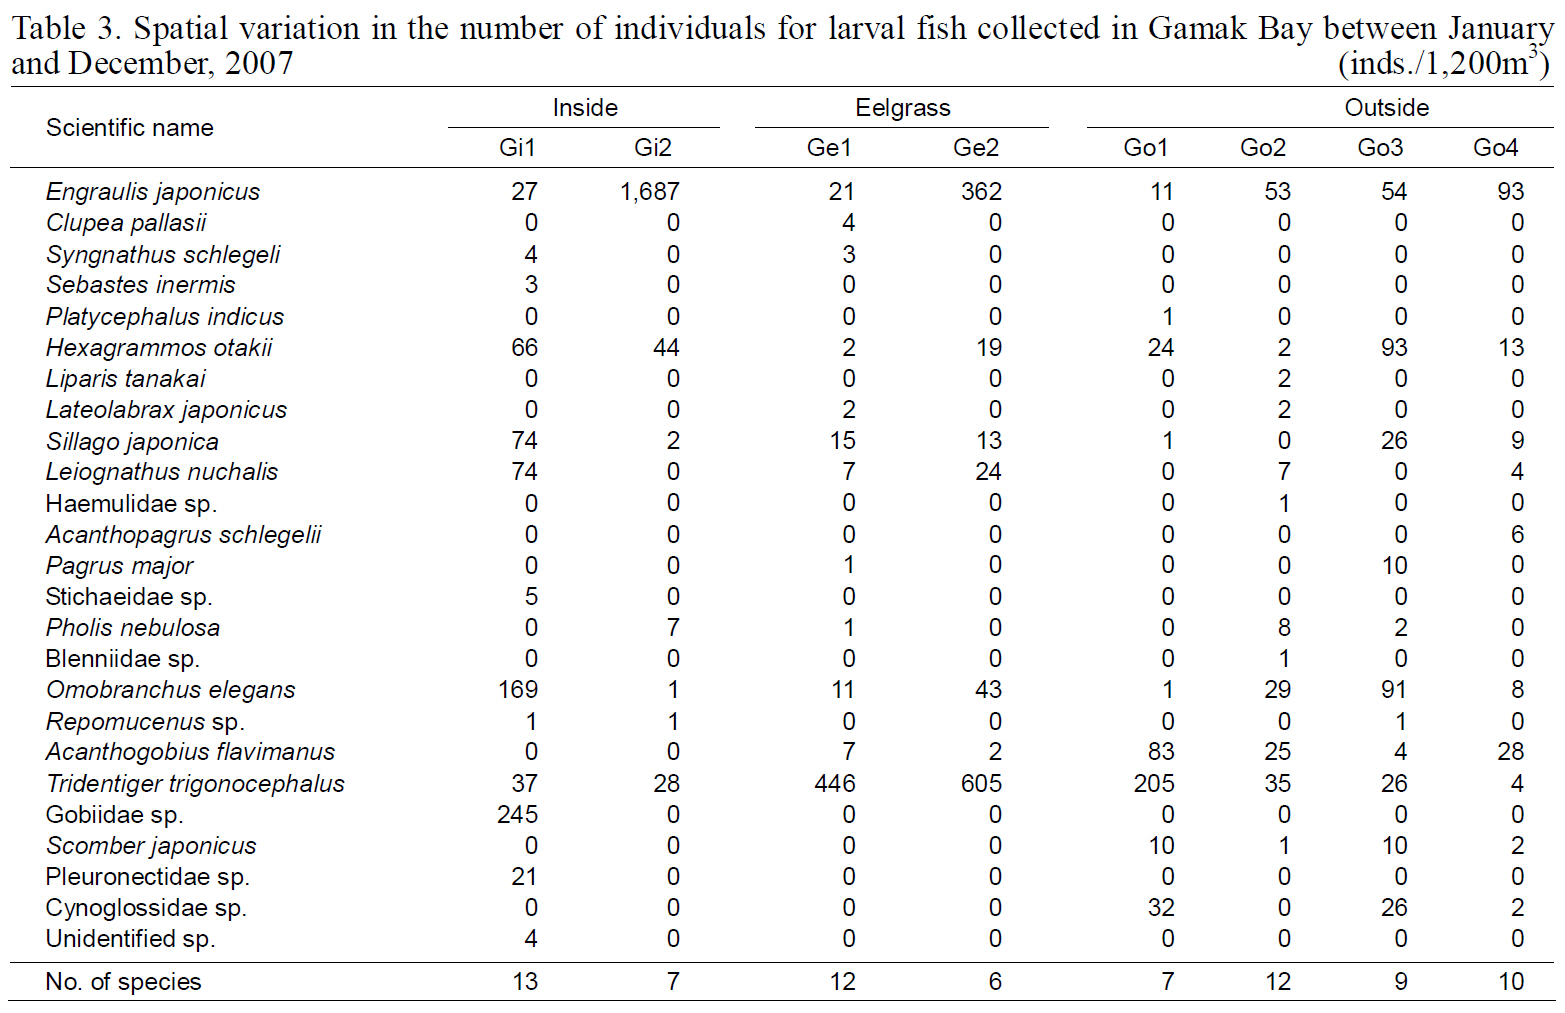
Spatial variation in the number of individuals for larval fish collected in Gamak Bay between January and December 2007
eelgrass (
The diversity index was highest for larval fish in August and for young fish in July (Kim et al., 2009).These data indicate that both larval and young fish are most diverse in Yeoja and Gamak bays during warm months. No meaningful differences were found when comparing the species composition and abundance of fish larvae in eelgrass beds (Ye1, Ye2,Ge1, and Ge2) with those at stations inside and outside the bay (Table. 2, 3).
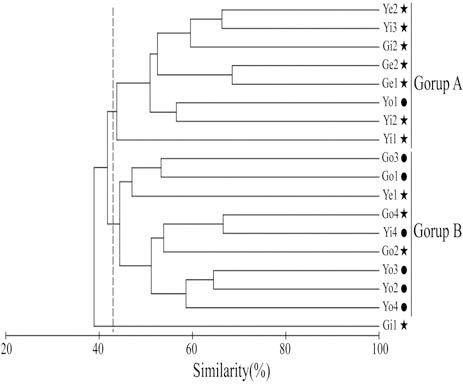
Hannan and Williams (1998) suggested that optimal recruitment of ocean-spawned juveniles to seagrass habitats may depend on the availability of suitable habitat near a bay entrance. In contrast, in this study, cluster analysis produced two groups,inside (group A) and outside (group B) the bays (Fig.4). For August, when species diversity was highest, the two bays tended to be slightly divided into inside and outside areas according to the criteria of 25°C SST (Fig. 5A) and 32.6 psu salinity (Fig. 5B).
juveniles collected during April-May were 19-27 mm,the size estimated by Han et al. (1999) to characterize fish 2-3 months after hatching. This result suggests that this species does not spawn near eelgrass beds,but instead spawns and hatches offshore and approaches bays as it grows, to live as young fish in eelgrass beds with abundant food. However,

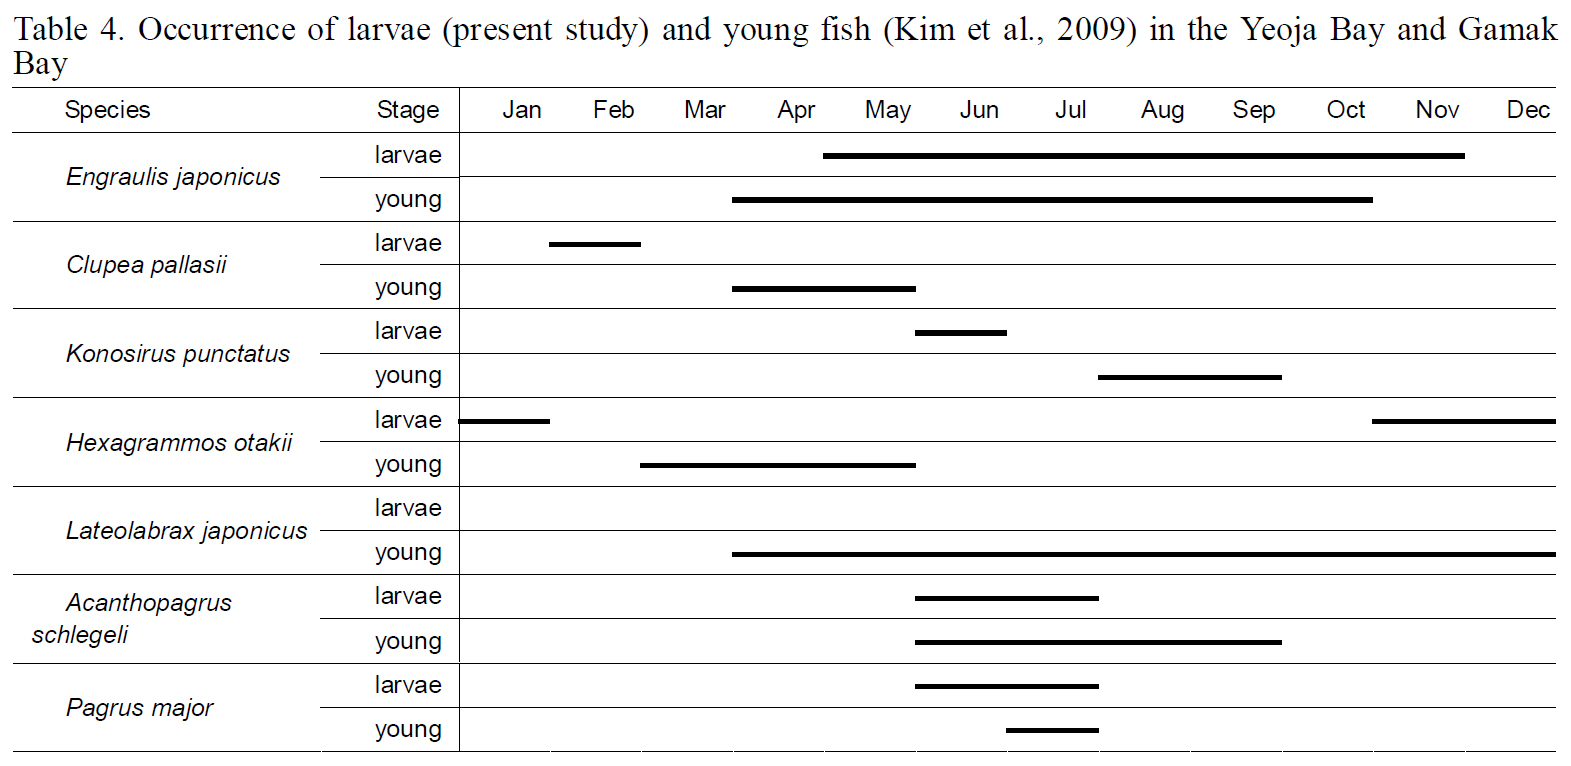
Occurrence of larvae (present study) and young fish (Kim et al. 2009) in the Yeoja Bay and Gamak Bay
April and young fish in January-June, suggesting that this fish also uses waters inside the bays as spawning and nursery grounds. When the numbers of larval individuals inside and outside the bays were compared by species,
inside the bays, which offer abundant food supply and shelter, strategically as spawning and nursery grounds.